How I Spot Trading Opportunity – Part IILast week, we discussed how to spot trading opportunities using multiple asset classes. I also created multiple tabs for each asset class, such as currencies, commodities, and indices. Within each asset class, there are multiple products.
The whole idea is this: if you already have a trading methodology that is working well for you in a particular asset, say gold or silver, and you have been trading it for a long time, why not apply the same trading methodology across other markets?
It is not too difficult to pick up trading ideas fairly quickly from the market at any point in time. And I am going to share with you how I do that.
Micro E-mini Nasdaq Futures & Options
Ticker: MNQ
Minimum fluctuation:
0.25 index points = $0.50
Disclaimer:
• What presented here is not a recommendation, please consult your licensed broker.
• Our mission is to create lateral thinking skills for every investor and trader, knowing when to take a calculated risk with market uncertainty and a bolder risk when opportunity arises.
CME Real-time Market Data help identify trading set-ups in real-time and express my market views. If you have futures in your trading portfolio, you can check out on CME Group data plans available that suit your trading needs www.tradingview.com
Market insights

The Aussie on the brink: annual highs under siegeFollowing the bullish impulse initiated at the end of November, the Aussie is now challenging its annual highs. With the latest monetary policy decisions largely digested and implied volatility declining, the market is refocusing on microstructure and flows.
Fundamental Analysis
The RBA’s latest hold, the third in a row, confirmed a “hawkish hold” bias that continues to support the Australian dollar. The central bank acknowledges that inflation is proving broader than initially expected and remains alert to second-round risks, keeping real rate expectations elevated for Australia. The RBA Rate Tracker, which measures the implied probability of a rate change, is also starting to price in a moderate chance of a hike in 2026.
On the US side, while the official message remains cautious, the market has mainly noted the inability of US yields to re-establish a sustained upward trend. This is compounded by a well-established seasonal factor, as December has historically been a period of USD underperformance, driven by hedging flows and profit repatriation.
The broader global backdrop is also supportive for the AUD given its strong correlation with commodities, with copper and gold trading at historically high levels.
Technical Analysis
From a technical standpoint, the daily chart of 6AH6 shows a clear structure of higher lows and higher highs since the November trough. Prices are trading above key moving averages, notably the 55-day average, which is acting as dynamic support. The current consolidation is taking place above former value areas, a typical feature of a market accepting higher prices rather than one in distribution.
Volume analysis provides additional insight. Upward phases have been accompanied by rising volumes, while recent pullbacks have occurred on more moderate volume. This suggests an absence of aggressive selling pressure. The visible volume profile on the chart shows a high concentration of trading activity around 0.6550–0.6600, corresponding to a former equilibrium now located below the market. Since the bullish recovery, price has moved into a low-volume area above, indicating that the market is exploring levels with limited historical trading.
The current zone around 0.6650–0.6670 appears more like a pause than a definitive resistance. As long as price remains above the core of the volume profile, probabilities favor continuation or, at a minimum, a high-level consolidation.
Sentiment Analysis
Retail sentiment on spot AUD/USD is particularly skewed, with retail traders heavily net short. Some platforms even show ratios exceeding 80% or 90% short positions. This configuration is typical of market phases where retail participants attempt to anticipate a top based on psychological levels or visible resistance, without waiting for a confirmed reversal signal.
From a contrarian perspective, this positioning represents potential fuel for further upside. It indicates that the market is not overloaded with fragile speculative longs, but instead crowded with sellers who may be forced to cover if key levels are broken.
On the institutional side, no major desks appear to be arguing for an immediate, structural bearish reversal in AUD/USD.
Options Analysis
In the options space, calls are more in demand and more expensive, confirming a dominant short-term bullish bias and a market that is primarily expecting extension.
The options heatmap also shows large clusters of call options at the 0.6700 and 0.6750 strikes. In the event of an approach to or break above these levels, call sellers could find themselves short gamma and forced to hedge via futures buying, thereby amplifying the bullish move.
Trade Idea (6AH6)
With a lighter news calendar and market liquidity gradually declining, there is limited likelihood of sufficient catalysts to reverse the trend before year-end. In this context, a directional bullish strategy remains the most coherent, at least over the next two weeks.
Entry zone: on pullbacks toward 0.6620–0.6630
Stop loss: below the 55-day average, currently around 0.6540
Primary target: 0.6750
Extended target: 0.6850 in the event of an options-driven squeeze
Final Thoughts
Even though the AUD has shown some hesitation over the past few sessions, signals continue to converge toward an intact bullish potential. Fundamentals are supportive, technical analysis points to acceptance of higher prices, retail sentiment is heavily contrarian, and options positioning highlights the risk of a squeeze above well-identified levels.
In this type of environment, the market’s ability to force weak hands out should not be underestimated, particularly during periods of lower liquidity. As long as the structure remains intact, a bullish extension beyond the annual highs remains the most coherent scenario into year-end, ahead of a likely consolidation phase in early 2026.
---
When charting futures, the data provided could be delayed. Traders working with the ticker symbols discussed in this idea may prefer to use CME Group real-time data plan on TradingView: tradingview.com/cme/ .
This consideration is particularly important for shorter-term traders, whereas it may be less critical for those focused on longer-term trading strategies.
General Disclaimer:
The trade ideas presented herein are solely for illustrative purposes forming a part of a case study intended to demonstrate key principles in risk management within the context of the specific market scenarios discussed. These ideas are not to be interpreted as investment recommendations or financial advice. They do not endorse or promote any specific trading strategies, financial products, or services. The information provided is based on data believed to be reliable; however, its accuracy or completeness cannot be guaranteed. Trading in financial markets involves risks, including the potential loss of principal. Each individual should conduct their own research and consult with professional financial advisors before making any investment decisions. The author or publisher of this content bears no responsibility for any actions taken based on the information provided or for any resultant financial or other losses.

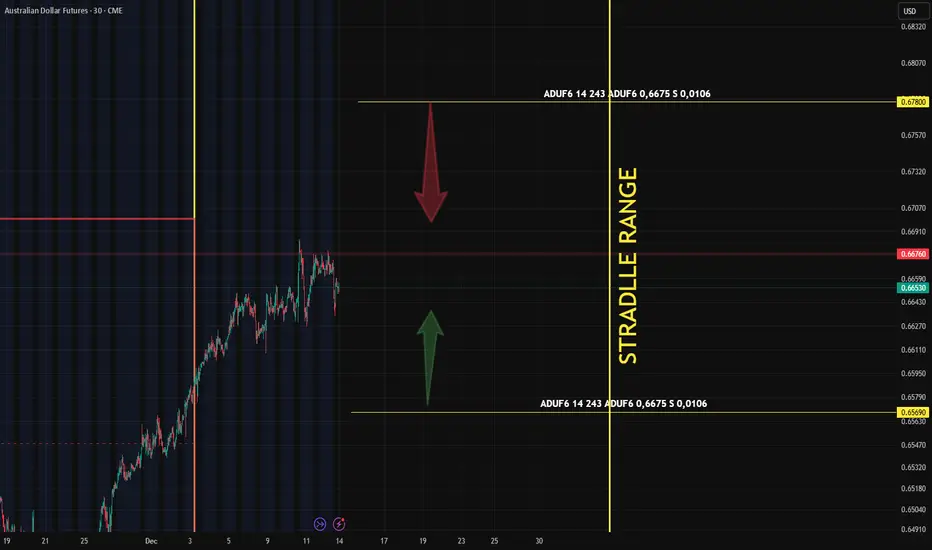
AUD Buy & Sell Levels (Statistical Based)📌 AUD ER Levels for Monday
Worth noting: a Straddle has been placed right at the second tier of key support/resistance levels.
Not massive — ~$200K in premium — but straddles on AUD are rare.
This one deserves attention.
When a straddle aligns with ER boundaries, as it does now, those edges become high-probability reaction zones — ideal for limit entries and stop-loss placement.
📌 Bottom line:
If the Aud soars or crashes next week — and with a packed news calendar ahead, volatility is likely —
we’ll know exactly where to place our limits…
and hide our stops.
Are you using ER? Or still guessing support/resistance?
P.S. Transparency first. No hype. Just real results.
6A/Audusd sellI am looking to sell Audusd because it is at a high level supply area so I expect price to drop from he.
6A futures sell limit / Audusd cfd sell limit.
Entry @ 0.66740(6A) 0.66729(Audusd)
SL @0.67380( futures) 0.67369(cfd)
Tp @ 0.65390( futures) 0.65379(cfd)

Bulls Cornered at Historic Oversold Zone - Spring Loads📊 To see my confluences and/or linework, step 1: grab chart, step 2: unhide Group 1 in object tree, step 3: hide and unhide specific confluences. 🎨
🎯 6A1!: Bulls Cornered at Historic Oversold Zone - Spring Loads
The Market Participant Battle:
Bears have systematically trapped bulls into a proven demand zone (Point 2 at 0.65880), creating a powerful compression pattern that's about to snap. The numbered reference points on the chart show how Point 3 closed above Point 1, making Point 2 a battlefield where proven buyers are congregating. At Point 4, we're returning to this exact zone where institutional buyers previously defended aggressively. This is a classic case where oversold bears have overplayed their hand, and smart money is quietly accumulating for a violent reversal.
Confluences:
Confluence 1: Proven Buyer Zone & Anchored VWAP Deviation
The chart shows a powerful setup where price has returned to a proven buyer zone at 0.65880 (Point 2). What's particularly compelling is the anchored VWAP from Point 1, where price has pulled back to the 2nd deviation before bouncing above the 1st deviation. This is textbook mean reversion behavior indicating bears are exhausted and buyers are stepping in with conviction.
Confluence 2: Fixed Range Volume Profile POC Magnet
The Fixed Range Volume Profile from Points 0→3 reveals the Point of Control (POC) sits exactly where Point 4 is testing. This is institutional positioning at its finest - the highest volume traded area acts as a massive magnet pulling price back for accumulation. Smart money doesn't ignore these levels.
Confluence 3: Footprint Chart Bullish Imbalances
The footprint chart reveals stacked bullish imbalances with positive delta on large red bars - a clear sign absorption is occurring. On Friday the 19th at 3pm, we see positive delta on a massive red bar with price closing above a bullish imbalance. Bears tried to push through but were absorbed by aggressive buyers.
Confluence 4: Second-Degree Bullish Divergence
This is where it gets interesting - we have a double-layered bullish divergence. Price made a lower low at Point 4, but both RSI and MFI made higher lows. Additionally, we see candle-level bullish divergence forming. Both indicators are oversold at Point 4, creating a powder keg setup.
Confluence 5: OBV Breakout & Bollinger Band Squeeze
On-Balance Volume (OBV) has broken two down-sloped trendlines, indicating incoming buyers despite price weakness. Monthly VWAP shows price crossed under and is now back above, while price has been touching the lower Bollinger Band repeatedly - a self-similar pattern to previous major reversals.
Web Research Findings:
- Technical Analysis: Multiple analysts noting AUD/USD holding above crucial 0.6600 support despite weak employment data
- Recent News/Earnings: RBA surprisingly held rates at 3.85%, defying market expectations for cuts
- Analyst Sentiment: COT data shows fastest short covering in 4.5 years - institutional repositioning underway
- Data Releases & Economic Calendar: Fed cut rates by 25bp to 4.00-4.25% range on September 17, weakening USD
- Interest Rate Impact: Rate differential narrowing as Fed cuts while RBA holds - bullish for AUD
Layman's Summary:
Think of this like a rubber band stretched to its limit. The Australian Dollar has been beaten down so severely that even bad news can't push it lower. When everyone's betting one way (shorts), and the fundamentals start shifting (Fed cutting, RBA holding), you get explosive reversals. The smart money is quietly switching sides while retail remains bearish.
Machine Derived Information:
- Image 1: Trend channel setup showing Points 1-3 progression - Significance: Clear bullish channel break and retest pattern - AGREES ✔
- Image 2: Bollinger Bands with R/R overlay showing Gap Zones - Significance: 4.99 risk/reward ratio potential with clear zones - AGREES ✔
- Image 3: OBV/RSI/MFI indicator panel - Significance: Triple bullish divergence with OBV trendline breaks - AGREES ✔
- Image 4: Object tree revealing hidden confluences structure - Significance: Professional multi-layer analysis with VWAP and Volume Profile - AGREES ✔
- Image 5: Fixed Range Volume Profile visualization - Significance: POC sitting exactly at current test level confirming support - AGREES ✔
Actionable Machine Summary:
All charts unanimously confirm the bullish reversal setup. The combination of technical structure (channel support at proven buyer zone), volume analysis (POC magnetic effect drawing price), momentum divergences (RSI/MFI/OBV all signaling reversal), and footprint absorption patterns creates an A+ institutional accumulation setup. Entry at 0.66080 with stop at 0.65410 targeting 0.67045 provides exceptional 4.99:1 risk/reward with clear invalidation levels.
Conclusion:
Trade Prediction: SUCCESS ✅
Confidence: High
This setup represents a textbook case of market participants getting trapped at extremes. Bears have pushed too far into a proven demand zone, COT data shows record short covering beginning, and technical indicators are screaming oversold with multiple divergences. The risk/reward of 4.99:1 with clear invalidation makes this a must-take opportunity. When institutions flip from record shorts to covering, the momentum shift can be violent. Take the trade with confidence.

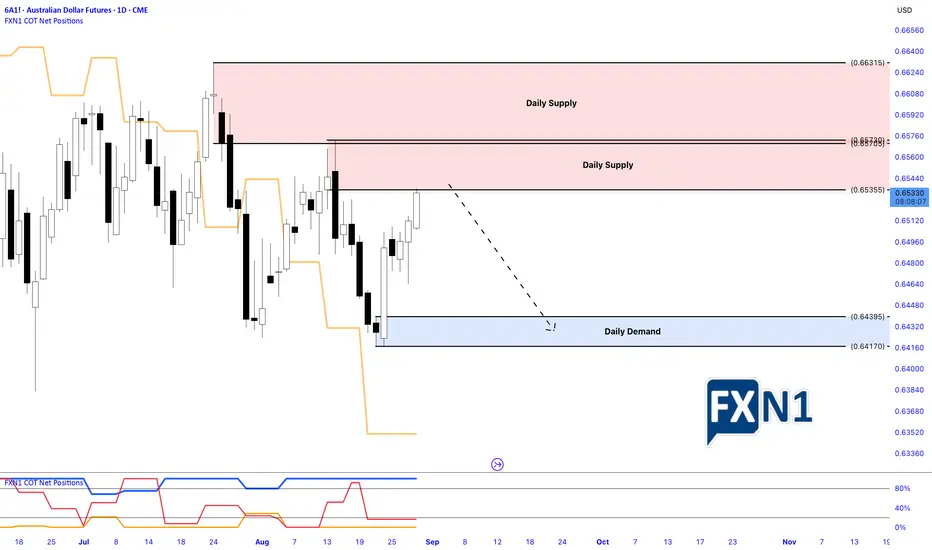
AUD: Revisit Key Supply Zone, Potential Short Setup.The AUD Futures 6A1! has revisited a key supply zone established earlier this month, presenting a potential opportunity for another short trade setup. According to the latest COT report, non-commercial traders have increased their short positions, indicating a bearish sentiment. However, it's crucial to keep an eye on the DXY, as recent price movements over the past two days suggest a possible shift in its trend. Given that August often brings uncertainty and lack of clear direction, this environment requires careful monitoring. Consider this analysis as one of several factors in your trading decision-making process.
✅ Please share your thoughts about 6A1! in the comments section below and HIT LIKE if you appreciate my analysis. Don't forget to FOLLOW ME; you will help us a lot with this small contribution.
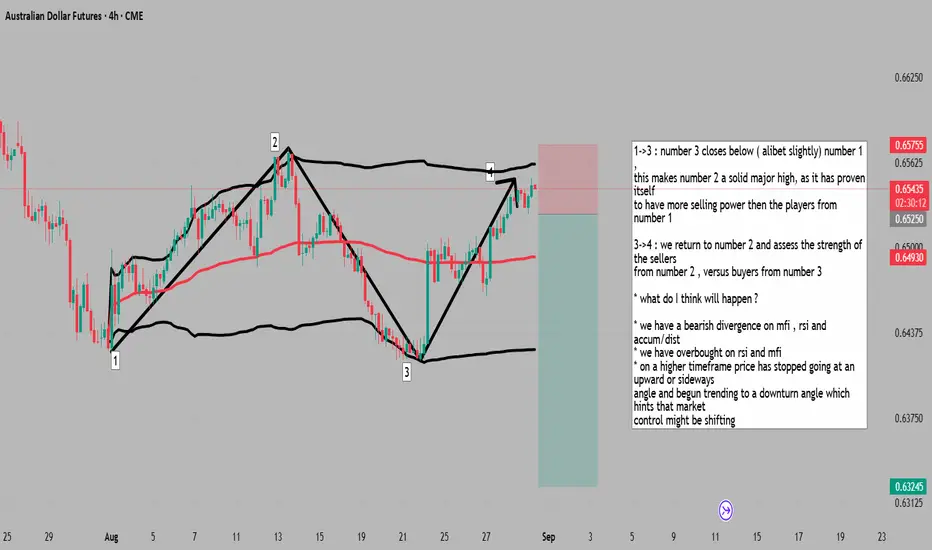
a return to dominant sellers origin presents a =BUYers world1->3 : number 3 closes below ( alibet slightly) number 1 ,
this makes number 2 a solid major high, as it has proven itself
to have more selling power then the players from number 1
3->4 : we return to number 2 and assess the strength of the sellers
from number 2 , versus buyers from number 3
* what do I think will happen ?
* we have a bearish divergence on mfi , rsi and accum/dist
* we have overbought on rsi and mfi
* on a higher timeframe price has stopped going at an upward or sideways
angle and begun trending to a downturn angle which hints that market
control might be shifting
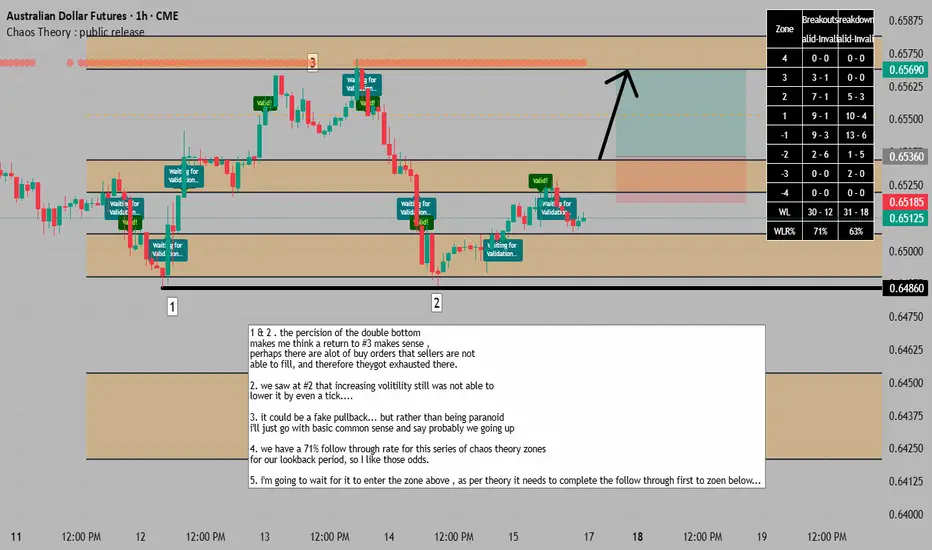
percise double bottom alongside mfi+rsi oversold points upside1 & 2 . the percision of the double bottom
makes me think a return to #3 makes sense ,
perhaps there are alot of buy orders that sellers are not
able to fill, and therefore theygot exhausted there.
2. we saw at #2 that increasing volitility still was not able to
lower it by even a tick....
3. it could be a fake pullback... but rather than being paranoid
i'll just go with basic common sense and say probably we going up
4. we have a 71% follow through rate for this series of chaos theory zones
for our lookback period, so I like those odds.
5. i'm going to wait for it to enter the zone above , as per theory it needs to complete the follow through first to zoen below...
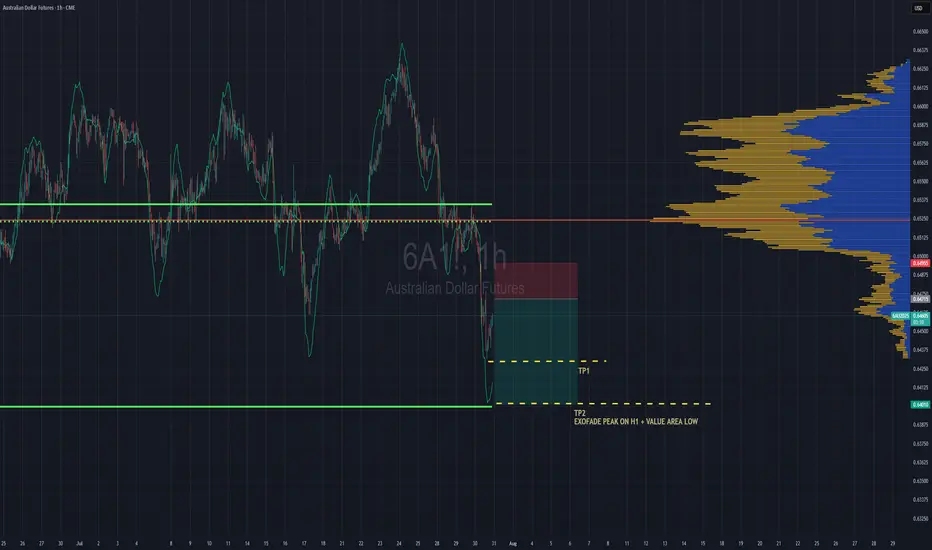
Aussie Shorts Looks Promising This is a pullback trend trade anticipating trend continuation. Entry is based on LVN (low volume node) for entry. Also looking on the footprint chart there is a high volume node with -ve delta that was traded at 0.64715.
If the sellers return to defend that price then this pullback should give some strong rejection once we pierce the entry zone and send bulls packing.
TP1 - First swing low
TP2 - Value area low of the range, which also is in confluence with the ExoFade peak on the 1HR timeframe. ExoFade peaks always gets taken out in a strong trend, that's why i love using them as price targets for exits. ExoFade is free on Tradingview for those curious about it. Just search for it.
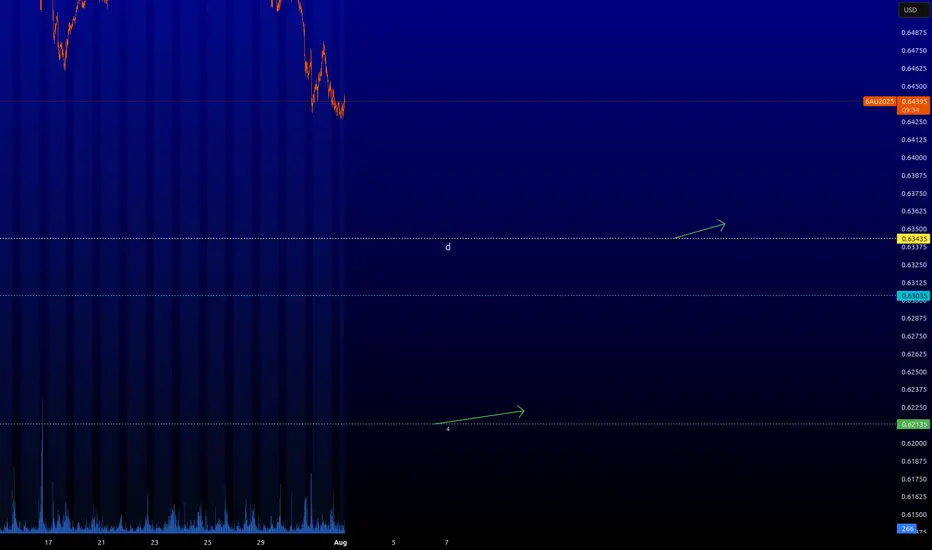
6A : Key LevelsThat's the picture on this tool. It is possible to take short-term longs from two levels with arrows. I do not recommend trading them on Forex. The spread can eat up all the profit.
⚠️ VOLATILITY WARNING ⚠️
Trading around major news can be extremely unpredictable. Trade responsibly!
Australian dollar rose 0.8% but there is a "Wall" of naked callsAustralian dollar is up 0.8% in 24h — and almost eyeing the 0.66–0.665 zone .
That’s exactly where we’ve been seeing a systematic build-up of naked calls on the futures.
More “bricks” added to the wall yesterday.
Early, looking at the CME data , there’s been a meaningful inflow in deep-out-of-the-money call options at the 0.665 strike . And this has been happening for several days for now
We can’t say it’s one single player — CME reports don’t show that.
But the pattern is too consistent to ignore.
🧠 Why it matters:
As I’ve said before — these long call stacks can easily turn into zero-cost put spreads by selling futures at those levels.
🎯 Bottom line:
Seems the market isn’t betting on a rally in long term.
It’s preparing to defend the range .
Strategy: open shorts at "build-up" resistance zone

Mid-Session Market InsightsMid-Session Market Insights
In today's session, I'm closely monitoring eight different futures markets: S&P 500, NASDAQ 100, Russell 2000, Gold, Crude Oil, Euro Dollar, Yen Dollar, and Aussie Dollar.
S&P 500: We're seeing a rotational pattern within the prior day's value area and the CVA. I'm eyeing long opportunities from the prior value area low up to the high.
NASDAQ 100: The market is a bit choppy around the PVA and CVA highs, with a slight upward intraday trend. I'm staying cautious here.
Russell 2000: Also choppy, but we've got acceptance within the CVA. I'm looking for long opportunities from the CVA low, which aligns with the prior day's low.
Euro Dollar: I'm currently short from the CVA high, with the first target at the prior day's low. We've broken below the prior value area, so I'll trail this trade and see how it develops.
Yen Dollar: It’s been a bit of a mixed bag. I took a short below the CVA and prior day's low, got stopped out, but it was still a decent setup.
Aussie Dollar: I took some long positions that weren't the best setups, as it was quite choppy near the CVA high and prior day's low. Lesson learned for next time.
Crude Oil: I took a short from the CVA and PVA highs, hit my target at the low of those areas, and we’re currently hovering around that level.

Quiet Before the Move — What AUD Options Are Telling UsThe AUD is stuck inside its recent range — trading has gone sideways, and trying to predict a breakout direction ahead of key moves would be premature (for more on the “Suffering Trader” concept, click here ).
Price is consolidating just below a cluster of previously opened retail longs. This "failure to achieve" undermines the case of shorting this level right now. So for the time being, I’ll stay in observation mode and watch which side ends up suffering the most.
Now, looking at the CME data , there’s been a meaningful inflow in deep-out-of-the-money call options at the 0.665 strike . That’s interesting.
Also worth noting: just above, at the 0.67 strike , we saw a similar inflow a couple of days ago — and that portfolio remains static. No repositioning or outflows so far.
That silence could mean something. Or nothing — yet.
We’re watching closely.

(6A1!) – Bullish Continuation SetupDescription:
6A1! (AUD/USD Futures) is currently coiling inside a symmetrical triangle structure, developing a textbook compression pattern after reclaiming a key low-volume demand zone. The price action shows signs of bullish continuation, supported by structural higher lows and the recent mitigation of a local Fair Value Gap (FVG).
Market Structure & Context:
After a sharp drop into premium demand, price formed a structural bottom near 0.6500 and began carving out higher lows.
Price is now consolidating beneath a descending trend line, forming a symmetrical triangle, typically a neutral pattern but here it follows a strong impulsive move from demand, giving it bullish continuation potential.
A Fair Value Gap (FVG) formed on the most recent impulsive candle and is now being actively tested if reclaimed and held, it could act as a launchpad for upside continuation.
Key Technical Levels:
Entry Zone: 0.65320 (Break and retest of triangle support + micro demand)
Fair Value Gap: 0.65380–0.65440 (needs a clean close above)
TP1: 0.65480 (Previous structural resistance)
TP2: 0.65670 (Full premium supply mitigation zone)
Invalidation: Below 0.65200 (would break triangle and invalidate bullish thesis)
Quantitative Confluence:
Volume tapering off within the wedge = compression
Efficient rejection of thin liquidity zone suggests institutional accumulation
Symmetrical triangle resolution statistics historically favoUr continuation of prior move (bullish impulse precedes consolidation)
Risk Considerations:
FVG rejection could trap breakout traders wait for clear close above + retest
CPI/News events during Asia or London may cause fake out wicks — avoid premature entries
Final Thoughts:
This setup offers a high-probability breakout scenario if price can hold above 0.65320 and reclaim the FVG zone. A clean breakout of the triangle and fair value gap would open the path to premium inefficiency fill around 0.65670. However, a breakdown below 0.65200 flips the script bearish and could target the lower demand block around 0.65000.

Stuck in a Squeeze, Fade the TopAs the Australian Dollar, a currency traditionally correlated with risk, has been trading in a range since mid-April, fading rallies near the top of that range appears to offer the best odds in the current environment. Here’s the breakdown.
Fundamental Analysis
The Australian Dollar continues to move without clear direction as the Reserve Bank of Australia (RBA) pursues a clearly dovish path. The RBA’s most recent 25bp rate cut, bringing the official cash rate down to 3.85%, was justified by the central bank’s confidence that inflation is returning to target, coupled with lingering global uncertainties. According to the RBA Rate Tracker, markets are now assigning a 70% probability to yet another 25bp rate cut at the next meeting, an outlook that continues to weigh heavily on AUD yields and the currency’s appeal.
On the other side of the Pacific, the CME FedWatch Tool shows that traders do not expect any policy easing from the Federal Reserve before late summer at the earliest. This means the US-Australia interest rate differential is likely to increase, making it even more expensive to hold AUD against the greenback.
Compounding the challenges for the Aussie is the ongoing economic slowdown in China, Australia’s largest trading partner. With Chinese demand for commodities muted, there is little external support for the AUD.
Technical Analysis
Technically, after a sharp rebound in early April, the Aussie has remained stuck in a frustratingly tight range, unable to regain any significant upward momentum. Since its highs at the end of September, the currency is still down almost 7%. Price action has been confined to a broad consolidation zone between 0.6350 and 0.65 USD for over a month, with sellers consistently capping rallies at the upper end.
The volume profile analysis reveals a heavy concentration of traded volume in the 0.6440–0.6465 band, reinforcing this area as a significant battle zone where sellers are likely to defend their ground. For the bulls to regain control, a sustained break above 0.6520 would be needed, something that appears unlikely in the current macro context.
Sentiment Analysis
From a positioning perspective, the CFTC’s Commitment of Traders (COT) report shows that large speculators continue to hold net short positions in the Aussie, signaling ongoing professional bearish bias.
Retail sentiment paints a similarly contrarian picture: broker data from FX/CFD platforms indicates a slim majority of retail traders remain long AUD/USD, with some brokers showing more than 70% long positions. This crowded long condition means there is still fuel for further downside, especially if key support levels give way. Notably, retail stop losses are clustered between 0.6400 and 0.6350, and these could act as accelerants if triggered by a downside break.
In addition, risk sentiment remains fragile. While the VIX has eased somewhat, it struggles to remain sustainably below 20, a sign that investor nerves are still on edge and defensive flows are likely to persist.
Listed Options Analysis
The options market continues to reinforce the idea that rallies will struggle to gain traction. Open interest on call options remains heavily concentrated above spot, particularly at the 0.6500, 0.6525, 0.6550, and 0.6600 strikes, creating a robust technical ceiling. This makes it difficult for the Aussie to stage any sharp or lasting rallies.
In contrast, open interest on put options is moderate and scattered, with the largest concentrations around 0.6400 and 0.6450, but there is no significant put wall below spot. The put/call open interest ratio is close to parity, indicating a relatively balanced positioning between calls and puts, with no strong directional bias from the options market.
Implied volatility for the front month remains elevated around 9.8–10.1%, and the risk reversal remains slightly negative, suggesting a modest preference for downside protection, but markets are not in panic mode. The heavy concentration of call OI above spot still introduces some gamma risk: if the market rallies into the 0.6500–0.6550 zone, a short squeeze could briefly occur, but such moves are likely to encounter renewed selling pressure and fade quickly.
Trade Idea
With the RBA set to remain dovish, China’s demand subdued, and global risk aversion remaining elevated, the Aussie remains a tactical short on rallies. The macro, technical, and sentiment picture all favor a bearish stance.
Entry: Short Australian Dollar (6AM5) on rallies to 0.6440–0.6465
Stop: 0.6520 (just above high-volume node and call OI cluster)
Target: 0.6350 (support, stop loss cluster below 0.64)
The trade provides a risk/reward ratio close to 2:1, thanks to a tight stop above resistance and a realistic profit target near support.
However, the outlook could change if the Fed pivots more dovishly than expected after the recent Moody’s downgrade of US debt. The FX landscape could shift rapidly and trigger a covering rally in AUD/USD.
For now, though, the odds favor playing from the short side. We’ll monitor stops closely and be ready to adapt if the macro winds start to shift.
When charting futures, the data provided could be delayed. Traders working with the ticker symbols discussed in this idea may prefer to use CME Group real-time data plan on TradingView: tradingview.com/cme/.
This consideration is particularly important for shorter-term traders, whereas it may be less critical for those focused on longer-term trading strategies.
General Disclaimer:
The trade ideas presented herein are solely for illustrative purposes forming a part of a case study intended to demonstrate key principles in risk management within the context of the specific market scenarios discussed. These ideas are not to be interpreted as investment recommendations or financial advice. They do not endorse or promote any specific trading strategies, financial products, or services. The information provided is based on data believed to be reliable; however, its accuracy or completeness cannot be guaranteed. Trading in financial markets involves risks, including the potential loss of principal. Each individual should conduct their own research and consult with professional financial advisors before making any investment decisions. The author or publisher of this content bears no responsibility for any actions taken based on the information provided or for any resultant financial or other losses.

Australia will flourishThis is a trade of the years… look at the price and decide for yourself. .80 on the line

15-M AUDUSD Daily income idea, Long play Potential long play, places limit order, take a look at my (SET). Good R to reward, Saver play would be to target the 4-H demand zone, but higher chance of not getting filled.

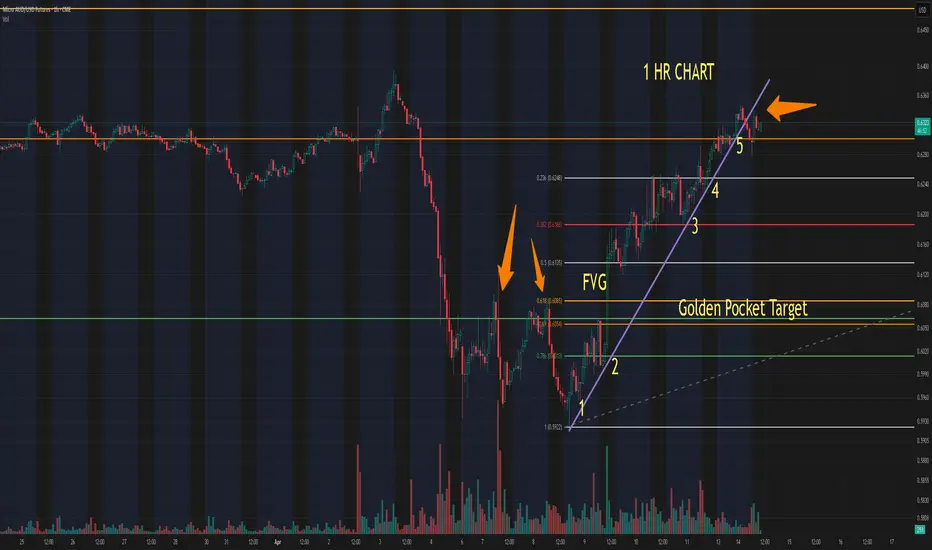
M6A1!.. Updated.. After taking a shot yesterday I pulled the trigger too early.. didnt wait for conformations.. still waiting but very close to the top here. looking for either a candle close out of the trendline or for a clering of the wicks at the top. It hit the wicks already not fully cleared but maybe good enough. Again easy SL above the wicks and ride it down to the FVG thats also the golden pocket fib. Using 2 contracts and will take profit at the 0.5 fib and let 1 run to target .. hopfully

AUDUSD SELL IHR1) Resistance line 0.64182 tested multiple times
2) Breakout on the uptrend suggests a SELL entry
3) Entry : 0.63809
4) StopLoss : 0.64236
5) TakeProfit 1 : 0.63129
6) TakeProfit 2 : 0.62354

M6A! short IDEAThis one seems pretty simple.. obviously with the world right now nothing is simple but the idea. So on the 1 Hr we broke Trend retested and back down. also there is a big fair value gap that perfectly lines up with the golden pocket fib that also lines up with the top of the candles from the bottom. Easy SL above the wicks .. you could go higher above the wicks on the left but going above these local wicks would invalidate the trade regardless. 1/8 reward. Well see
AUDUSD F BEARISH ?in 4h and 1h Order Block Bearish
Long trend line beariah
IFVG and Order Block in same place....
Sell maybe Monday ?

6A Swing Long Trade idea based on supply and demand, intermarket analysis, COT positioning and cross market valuation. Following a structured approach with clear entry, risk management, and confluence factors.

Bullish AUDUSD Trade IdeaThe AUDUSD pair is showing strong signs of bullish momentum as we anticipate further upside potential. With an overall positive outlook on the Australian Dollar and supportive technical indicators, this pair is poised for a potential rally. Watch for favorable market conditions that could drive the price higher in the coming sessions.
