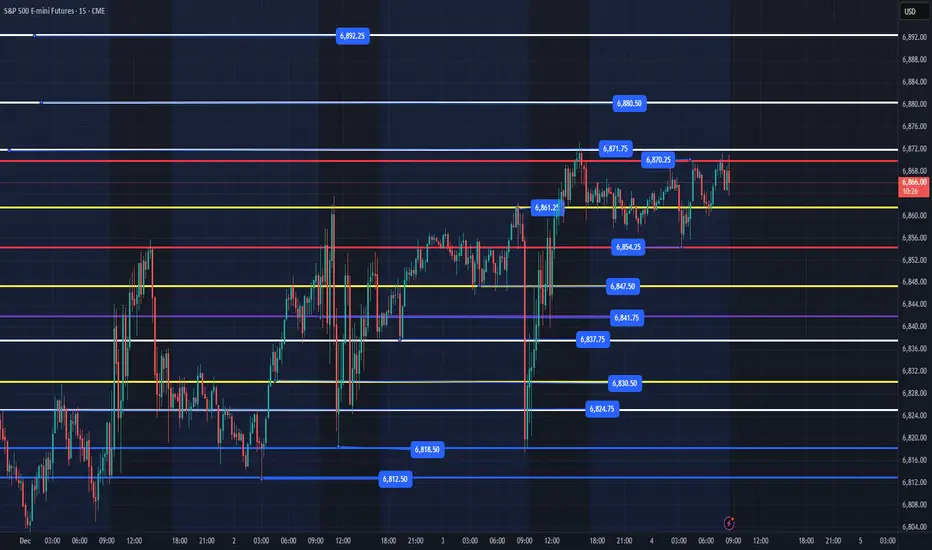
ES - December 4th - Daily Trade PlanDecember 4th- Daily Trade Plan - 8:30am
*Before reading this trade plan, if you did not read yesterday's take the time to read it first! (You can view the posts in the related publication section) *
If my posts provide quality information that has helped you with your trading journey. Feel free to
Related futures
Day 80 — From Green to Red: The Danger of OverstayingEnded the day -$256 trading S&P Futures. I was actually up +$250 early in the session, but I made the mistake of itching for more after playing it safe with small gains all week. I decided to size up to 6 contracts on a Buy signal that looked solid, but the market had other plans. We saw a "flash cr

Day 78 — Surviving the Chop: When Nothing WorksEnded the day +$36.64 trading S&P Futures. Today was super stressful despite the small green finish. The market structure was flipping up and down constantly, with no real trend and moving averages/zones failing to hold. It honestly felt like one of those days where the Market Makers are specificall

ES - December 5th - Daily Trade PlanDecember 5th- Daily Trade Plan - 7:30am
*Before reading this trade plan, if you did not read yesterday's take the time to read it first! (You can view the posts in the related publication section) *
If my posts provide quality information that has helped you with your trading journey. Feel free to

S&P 500 Key Levels to Monitor:Trading Approach:
If you're LONG now: Consider taking partial profit or tightening stop
If you're FLAT: Wait for retest at 6,814-6,780 to enter long
If it bounces hard at 6,814: That's your buy signal for 7,000 target
You're reading the chart well — the rejection at 6,864 + weak 15-min candle = rete
Day 81 — 100% Signal Accuracy & Back in RhythmEnded the day +$287.49 trading S&P Futures. After the stress of the last few sessions, I’m finally feeling better and getting back into a solid rhythm. Today was one of those rare days where the system was absolute perfection—we went 6 for 6 on the signals. With the market clinching a 4-day winning

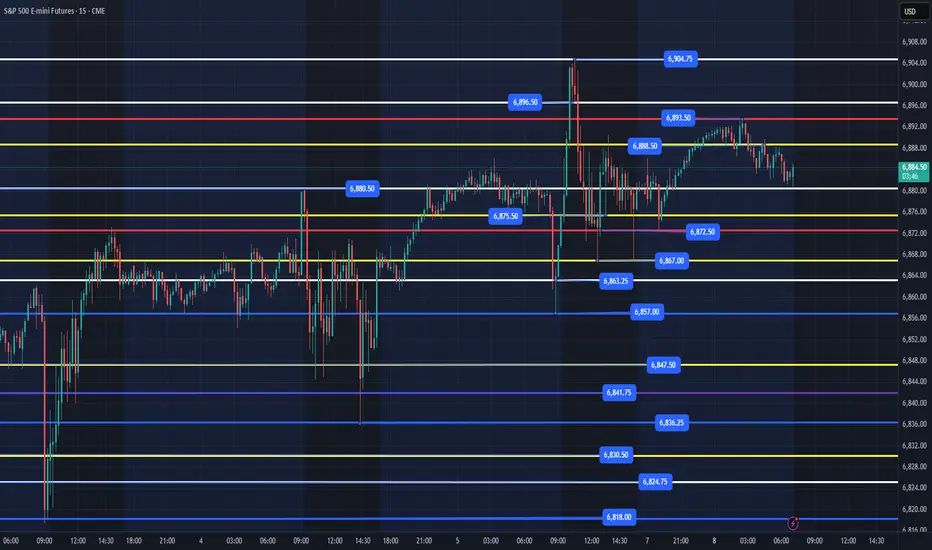
ES - December 8th - Daily Trade PlanDecember 8th- Daily Trade Plan - 7:10am
*Before reading this trade plan, if you did not read yesterday's take the time to read it first! (You can view the posts in the related publication section) *
If my posts provide quality information that has helped you with your trading journey. Feel free to
S&P500: Futures Stuck in Tight Range S&P 500 futures traded mostly sideways yesterday, remaining confined within a tight range. In our primary scenario, however, we anticipate that magenta wave (4) will soon resume its downward move. During this phase, the index is expected to initially break below the support levels at 6540 and 6371 p

ES (SPX, SPY) Analysis, Key-Zone, Setups for Fri (Dec 5th)Market Overview
The daily trend remains firmly upward, with prices pressing against the November swing-high band, characterized by a sequence of higher lows and a gradual ascent toward previous peaks. Momentum indicators on both the daily and 4-hour charts are on the rise, yet they have not entere
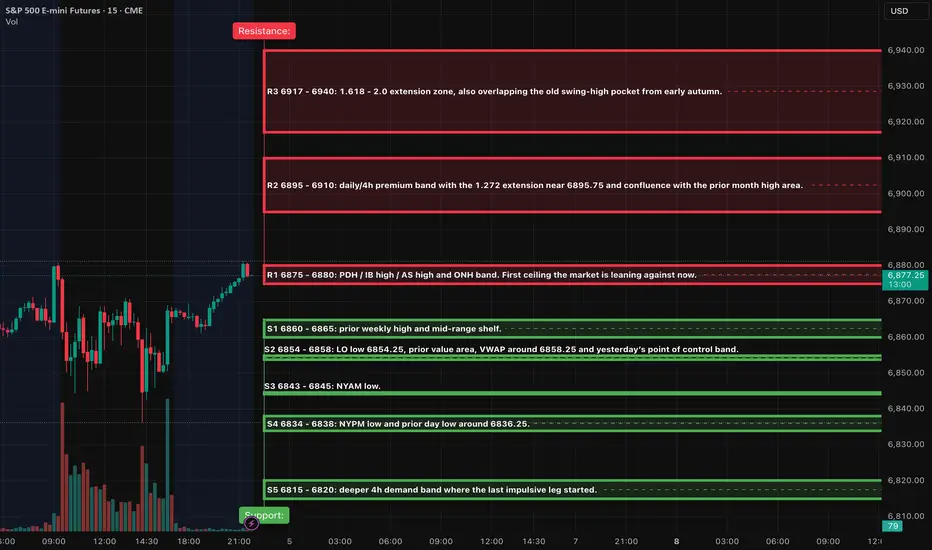
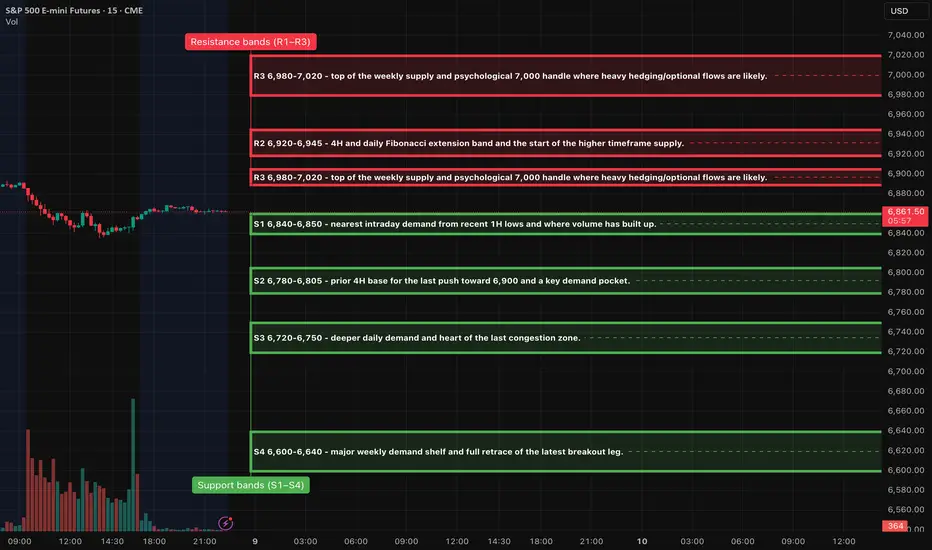
ES (SPX, SPY) Analysis, Key-Zones, Setups for Tue (Dec 9th)ES Market Overview (Daily/4H/1H)
The daily trend in the ES market remains bullish, with prices consistently above the most recent higher low while approaching a significant multi-month supply zone characterized by the 6,980-7,020 range. Although momentum has moderated, it has not completely revers
See all ideas
Summarizing what the indicators are suggesting.
Neutral
SellBuy
Strong sellStrong buy
Strong sellSellNeutralBuyStrong buy
Neutral
SellBuy
Strong sellStrong buy
Strong sellSellNeutralBuyStrong buy
Neutral
SellBuy
Strong sellStrong buy
Strong sellSellNeutralBuyStrong buy
A representation of what an asset is worth today and what the market thinks it will be worth in the future.
Displays a symbol's price movements over previous years to identify recurring trends.
Frequently Asked Questions
The current price of E-mini S&P 500 Futures (Mar 2027) is 7,118.75 USD — it has fallen −0.34% in the past 24 hours. Watch E-mini S&P 500 Futures (Mar 2027) price in more detail on the chart.
Track more important stats on the E-mini S&P 500 Futures (Mar 2027) chart.
The nearest expiration date for E-mini S&P 500 Futures (Mar 2027) is Mar 19, 2027.
Traders prefer to sell futures contracts when they've already made money on the investment, but still have plenty of time left before the expiration date. Thus, many consider it a good option to sell E-mini S&P 500 Futures (Mar 2027) before Mar 19, 2027.
Open interest is the number of contracts held by traders in active positions — they're not closed or expired. For E-mini S&P 500 Futures (Mar 2027) this number is 1.00. You can use it to track a prevailing market trend and adjust your own strategy: declining open interest for E-mini S&P 500 Futures (Mar 2027) shows that traders are closing their positions, which means a weakening trend.
Buying or selling futures contracts depends on many factors: season, underlying commodity, your own trading strategy. So mostly it's up to you, but if you look for some certain calculations to take into account, you can study technical analysis for E-mini S&P 500 Futures (Mar 2027). Today its technical rating is buy, but remember that market conditions change all the time, so it's always crucial to do your own research. See more of E-mini S&P 500 Futures (Mar 2027) technicals for a more comprehensive analysis.