FED Rate Cuts Aren’t the Blessing You Think — History Proves ItIn this video I ll take you thru historical macro events and we will see how it all rhymes with current markets conditions.
Here is link to my initial article with the data
Remember: Macro takes time to play and price can be going for months before the crash happens watch charts Im mentioning a
Related futures

ES - September 5th - Daily Trade PlanSeptember 5th - 7:55am
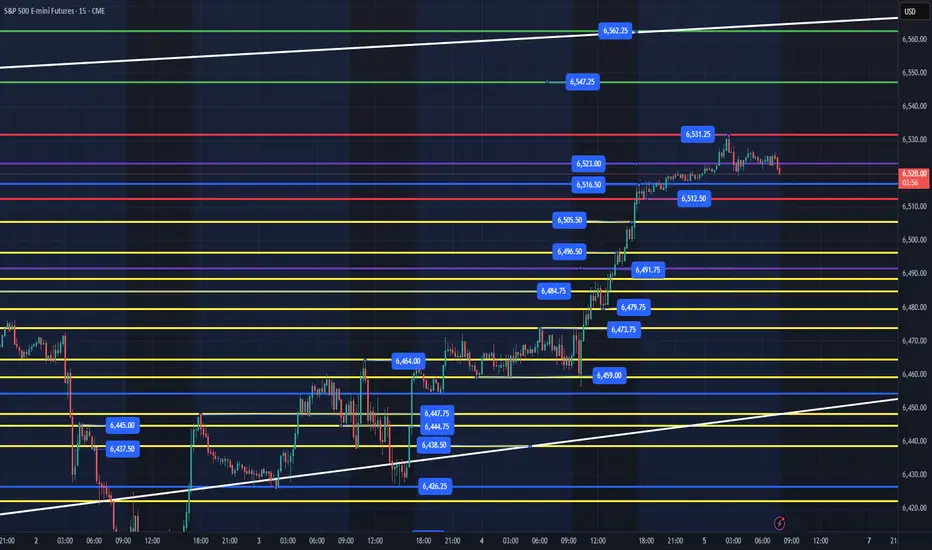
Last night session I stated - "My lean is we grind sideways and up into the 6523 level overnight and then we will need to wait for the employment report and NYSE to try and get some level losses and reclaims to finish the week at our targets of 6547, 6563+."
Our overnight s
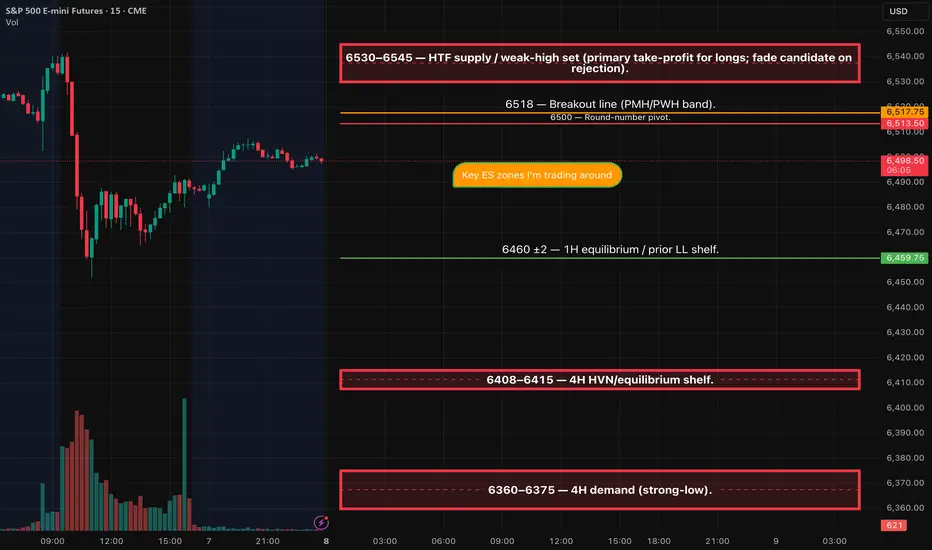
ES (SPX) Weekly: Levels & Setups - Sep 8-12, 2025Price is camped under a higher-timeframe supply/“weak-high” band. Trend remains constructive on the Weekly/Daily, but 4H/1H are coiling beneath resistance. I’m neutral into mid-week inflation data and will only engage on clean acceptance above the prior-high band or a rejection back into range.
Ev
ES - September 9th - Daily Trade PlanSeptember 9th - 5:45am EST - Daily Trade Plan
Yesterday, I did not make a trade. I was waiting on price to flush a lower level and all we got in the afternoon was the 6493 level that was the 2am low and produced a low-quality setup based on my edge. When we are trading in such narrow ranges, it can

Day 24 — Trading Only S&P Futures | +$264 Overnight WinWelcome to Day 24 of Trading Only S&P Futures!
Today was all about patience and levels. I noticed the market had already made a huge move yesterday, so I bet it couldn’t push much further overnight. I shorted at 6525 and woke up to a $250+ profit by market open.
That was enough for me — the plan w

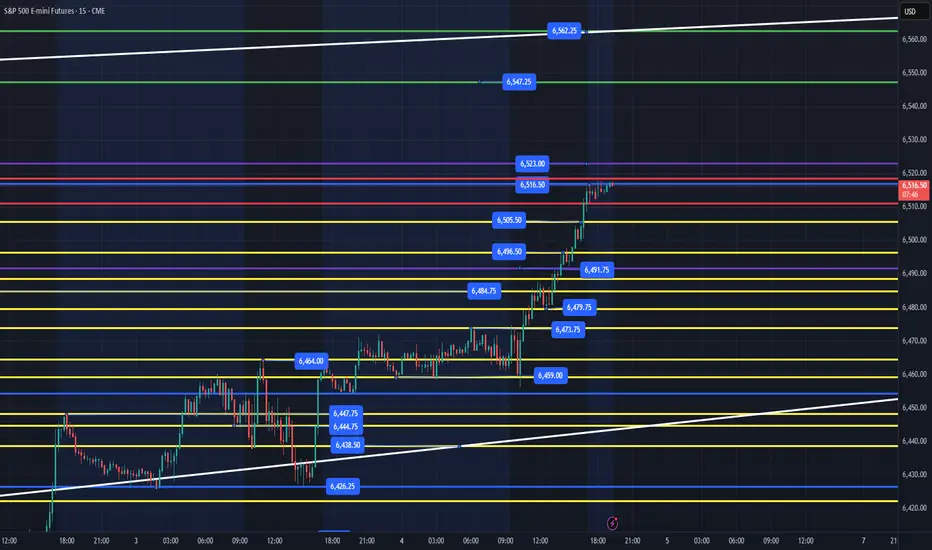
ES - September 5th - Daily Trade Plan - Evening SessionSeptember 4th - 7:15pm
In today's daily trade plan, I said - "Ideally, we lose 6454, flush and reclaim for a move higher. I expect another choppy day, and we need to clear 6491 to keep this rally moving higher."
At 10:16am price dropped down to 6456.25 and took off higher. You can look at a 4hr ch
ES (A++) — Intraday Analyses & Setups for Thu, Sep 4, 2025 (ET)We’re parked beneath a well-defined 6468–6475 ceiling. Tomorrow the clean A++ is either: (A) Breakout-acceptance long > 6475 (retest holds), or (B) Rejection short after a test of 6468–6475 that sends price back through 6453 with 15-minute bearish confirmation. TP ladders are mapped to ~6490 / 6501
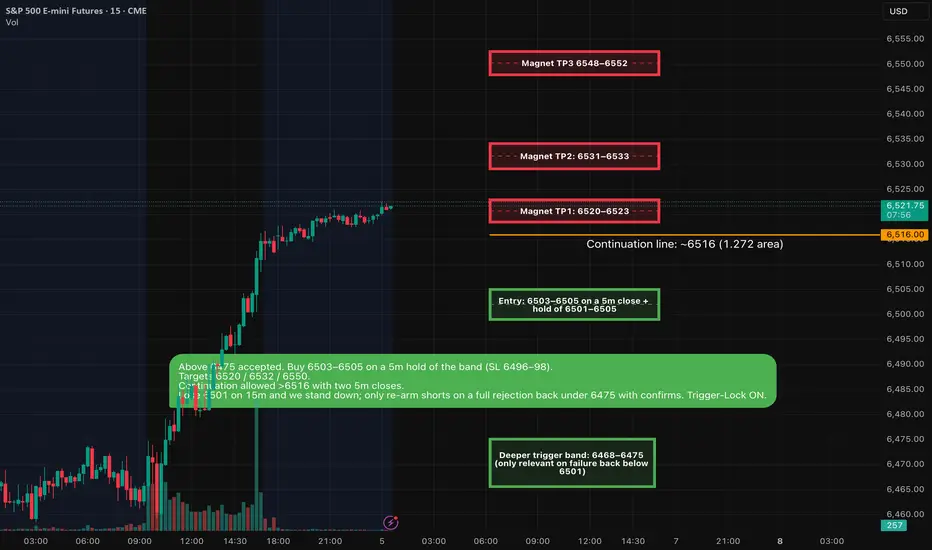
ES — Intraday Analyses & A++ Setups (Fri Sep 5, 2025) • Demand (reclaim): 6501–6505 — now support; Trigger-Lock ON
• Continuation line: ~6516 (1.272 area)
• Upside magnets: 6520–6523, 6531–6533, 6548–6552
• Deeper trigger band: 6468–6475 (only relevant on failure back below 6501)
A++ Long Setup
Retest-Hold LONG
• Entry: 6503–6505 on a 5m cl
Its Non-Farm: How much will ES Move?Hi all - Happy Non-Farm Friday!
I haven't done this in a while and thought it might be helpful to share my process for estimating the size of the move that we may get on ES after the Non-Farm Payrolls data is released.
I'm not trying to make a prediction on direction here - but more understand w

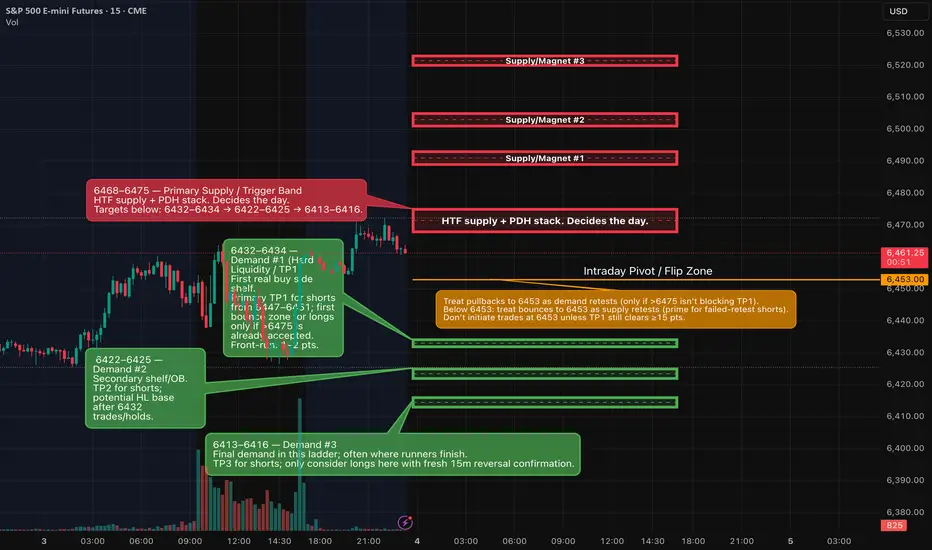
ES (Sep 3): short pops into 6420–6435; watch JOLTS & Beige BookHTF still skews bearish; intraday bounce stalled into overhead supply. For Wednesday (Sep 3), I’m planning sell-the-pop into 6420–6435 with confirmation. News risk: JOLTS 10:00 ET, Factory Orders 9:00 ET, Fed Beige Book 14:00 ET. ISM Services & ADP are Thursday (not Wed).
HTF bias (top-down)

See all ideas
Summarizing what the indicators are suggesting.
Neutral
SellBuy
Strong sellStrong buy
Strong sellSellNeutralBuyStrong buy
Neutral
SellBuy
Strong sellStrong buy
Strong sellSellNeutralBuyStrong buy
Neutral
SellBuy
Strong sellStrong buy
Strong sellSellNeutralBuyStrong buy
A representation of what an asset is worth today and what the market thinks it will be worth in the future.
Displays a symbol's price movements over previous years to identify recurring trends.
Frequently Asked Questions
The current price of Micro E-mini S&P 500 Index Futures (Sep 2025) is 6,516.00 USD — it has risen 0.15% in the past 24 hours. Watch Micro E-mini S&P 500 Index Futures (Sep 2025) price in more detail on the chart.
The volume of Micro E-mini S&P 500 Index Futures (Sep 2025) is 734.57 K. Track more important stats on the Micro E-mini S&P 500 Index Futures (Sep 2025) chart.
The nearest expiration date for Micro E-mini S&P 500 Index Futures (Sep 2025) is Sep 19, 2025.
Traders prefer to sell futures contracts when they've already made money on the investment, but still have plenty of time left before the expiration date. Thus, many consider it a good option to sell Micro E-mini S&P 500 Index Futures (Sep 2025) before Sep 19, 2025.
Open interest is the number of contracts held by traders in active positions — they're not closed or expired. For Micro E-mini S&P 500 Index Futures (Sep 2025) this number is 257.86 K. You can use it to track a prevailing market trend and adjust your own strategy: declining open interest for Micro E-mini S&P 500 Index Futures (Sep 2025) shows that traders are closing their positions, which means a weakening trend.
Buying or selling futures contracts depends on many factors: season, underlying commodity, your own trading strategy. So mostly it's up to you, but if you look for some certain calculations to take into account, you can study technical analysis for Micro E-mini S&P 500 Index Futures (Sep 2025). Today its technical rating is strong buy, but remember that market conditions change all the time, so it's always crucial to do your own research. See more of Micro E-mini S&P 500 Index Futures (Sep 2025) technicals for a more comprehensive analysis.