CTKUSDT Forming Bullish MomentumCTKUSDT is currently displaying a bullish momentum pattern, signaling growing strength among buyers and a potential continuation of upward movement. The recent increase in volume confirms that investors are accumulating positions, preparing for a breakout move. With price consolidating above key support levels, the technical outlook suggests that CTK could gain 30% to 40%* in the near term as momentum builds across the broader crypto market.
This bullish setup highlights strong participation from market participants, with trading activity steadily increasing over the past sessions. The price structure indicates that CTKUSDT may be transitioning from accumulation to expansion, a phase where upward price acceleration often follows. Traders watching for confirmation signals, such as volume spikes or moving average crossovers, may find this setup particularly appealing as it aligns with positive market sentiment.
Investors’ confidence in CTKUSDT continues to grow as the project gains attention for its consistent performance and recovery strength. The current technical formation suggests potential for sustained bullish movement if the price manages to maintain higher lows and close above key resistance zones. This momentum-driven move could open doors for short-term traders and long-term investors alike to capitalize on the ongoing uptrend.
✅ Show your support by hitting the like button and
✅ Leaving a comment below! (What is You opinion about this Coin)
Your feedback and engagement keep me inspired to share more insightful market analysis with you!
Trade ideas

CTKUSDT UPDATE#CTK
UPDATE
CTK Technical Setup
Pattern: Bullish falling wedge pattern
Current Price: $0.401
Target Price: $0.621
Target % Gain: 55.70%
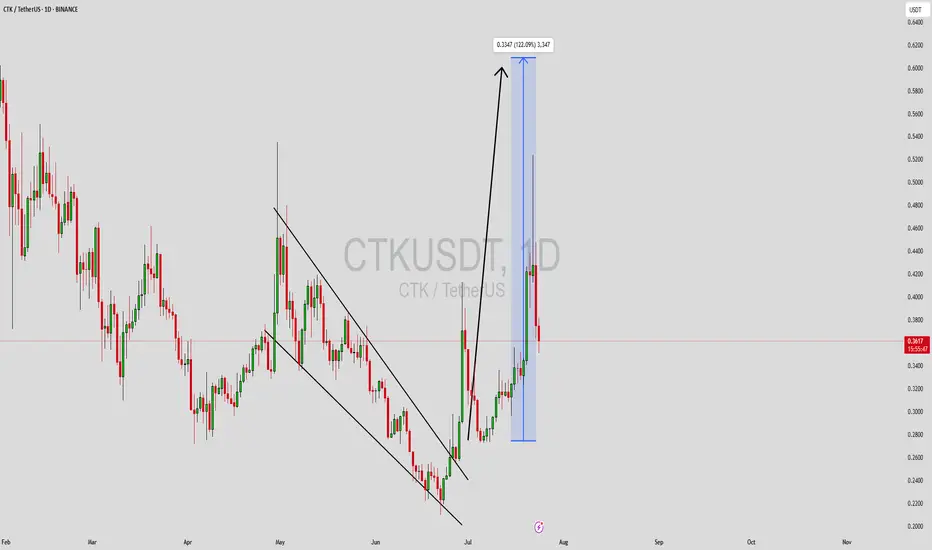
SEED_ALEXDRAYM_SHORTINTEREST1:CTK is breaking out of a bullish falling wedge pattern on the 1D timeframe. Current price is $0.401 with a target near $0.621, indicating around 55% potential upside. The breakout shows strong bullish momentum, suggesting potential continuation toward higher levels.
Time Frame: 1D
Risk Management Tip: Always use proper risk management.

CTKUSDT 1D#CTK is breaking out above the descending resistance. More upside movement is expected in the coming days. The targets are:
🎯 $0.4160
🎯 $0.4621
🎯 $0.5360
🎯 $0.6098
🎯 $0.7149
🎯 $0.8488
⚠️ Always remember to use a tight stop-loss and follow proper risk management.

CTKUSDT UPDATE#CTK
UPDATE
CTK Technical Setup
Pattern: Bullish Pennant Pattern
Current Price: $0.362
Target Price: $0.505
Target % Gain: 40.89%
SEED_ALEXDRAYM_SHORTINTEREST1:CTK is breaking out of a bullish pennant pattern on the 1D timeframe. Current price is $0.362 with a target near $0.505, showing about 41% potential upside. The breakout confirms bullish momentum with structure favoring continuation. Always use proper risk management.
Time Frame: 1D
Risk Management Tip: Always use proper risk management.

CTKUSDT UPDATE#CTK
UPDATE
CTK Technical Setup
Pattern : Falling Wedge Breakout
Current Price: $0.3535
Target Price: $0.52
Target % Gain: 47%
Technical Analysis: CTK has broken out of a falling wedge pattern on the 1D chart with bullish confirmation. Price is holding above the breakout trendline, suggesting further upside momentum. Sustaining above $0.34 opens the door for continuation toward \$0.52.
Time Frame: 1D
Risk Management Tip: Always use proper risk management.

Shentu (CTK) Breaks Above MA200 · 415% Easy Target MappedLook here. First notice the volume. Immediately you see green bars sticking out. Since we have a low but some mixed action also, this volume signal is the first thing that will tell us that the bulls are in the game. If it isn't showing on the price, it will do eventually.
Then we notice the entire chart, the structure. On the left side we had a downtrend and then a major low. Many people can assume that after the bounce a bearish continuation is the next logical step. They would say that it is already dropping and it should continue doing so until there is proof of something different. But we already saw the volume signal and we also know the bigger picture, the market never stays the same. It fluctuates, so we are always looking to exploit this transition period, this moment of change.
After the correction bottom we have no new lows. CTKUSDT (Shentu) is moving above MA200. This level is matching perfectly the 3-February low. This is the final resistance. Once above this level, which is already happening, expect bullish momentum to grow; maximum speed up and the highest prices since 2021 or even ever. The highest ever. This is where we are going.
Thank you for reading.
Namaste.

CTK Breakout Watch – Red Resistance Being Tested!🚨 CTK Breakout Watch – Red Resistance Being Tested! 🔴⏳
CTK is testing the red resistance zone.
📊 If breakout confirms, next move could target:
🎯 First Target → Green line level
A breakout could trigger bullish continuation and upside momentum.
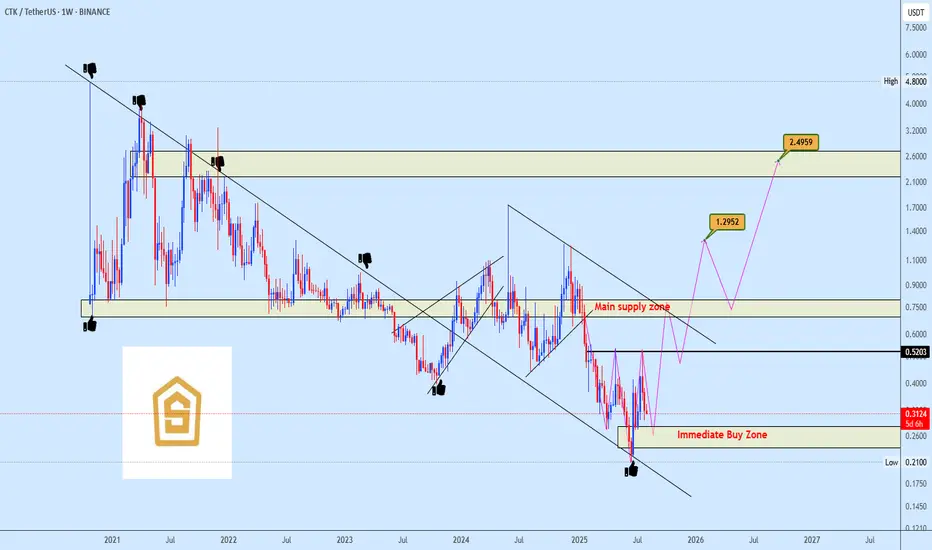
CTKUSDT Trendline Flip Impulsive Wave Build-Up in FocusCTKUSDT has completed a meaningful retest of a long-standing trendline, previously acting as resistance and now confirming its role as structural support. Price is reacting firmly around this key demand zone, signaling potential for a bullish reversal.
The plan is to accumulate within the immediate buy zone, targeting a move towards $2.495 as the structure develops into a likely impulsive wave sequence.
Share your thoughts
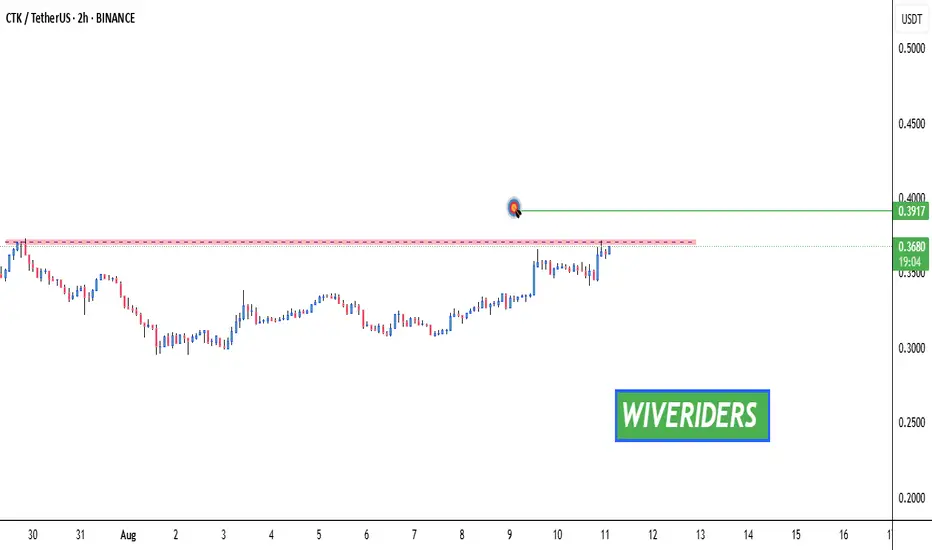
CTKUSDT at Critical Retest After Major Trendline Break!CTK/USDT has successfully broken out of a long-term descending trendline that has dominated the price since November 2024, signaling a potential trend reversal from bearish to bullish. The price is now retesting a crucial supply-turned-demand zone in the $0.36 - $0.39 area, which now acts as new support.
📊 Pattern and Price Structure
Descending Trendline Breakout: A clear breakout above the long-term downtrend, indicating the start of bullish sentiment.
Key Zone (Yellow Box): The $0.36 - $0.39 area previously acted as resistance multiple times and is now being tested as support.
Potential Reversal Pattern: The overall structure resembles a possible Inverse Head & Shoulders, with a neckline around $0.43.
---
🟢 Bullish Scenario
If the price holds above $0.36 and breaks through the minor resistance at $0.4323:
Next bullish targets are:
$0.5217
$0.7036
$0.8826
Up to $1.0151 as a major historical resistance
A breakout above $0.4323 with strong volume would confirm the bullish continuation.
---
🔴 Bearish Scenario
If the $0.36 support fails to hold:
Potential downside levels to watch:
$0.31
$0.26
Down to the key low at $0.21
A breakdown of this zone would invalidate the reversal setup and suggest continuation of the downtrend.
---
📌 Conclusion
CTK is at a critical decision point. The breakout from the downtrend is an encouraging signal, but its validity depends on whether the price can hold the new support and push above the next resistance. Volume confirmation will be key to identifying the next move.
#CTKUSDT #CryptoBreakout #AltcoinAnalysis #TrendlineBreakout #TechnicalAnalysis #SupportResistance #CryptoSetup #BullishReversal #CTKAnalysis

CTKUSDT Forming Falling WedgeCTKUSDT is currently trading within a well-defined falling wedge pattern, a classic technical indicator that often signals a bullish breakout. The structure reflects a period of consolidation after a prolonged downtrend, with gradually narrowing price action hinting at a potential reversal. Volume remains healthy, suggesting sustained market interest and accumulation at lower levels. With expectations of a 110% to 120% gain, CTK appears poised for a breakout that could catch the attention of momentum traders and longer-term investors alike.
The falling wedge is known for its high-probability breakout potential, especially when accompanied by consistent volume and investor accumulation. CTKUSDT has shown multiple rejections at resistance while maintaining higher volume spikes on up moves—indicative of strong buyer interest. As it approaches the apex of the wedge, a breakout above resistance could ignite a strong bullish rally, particularly if confirmed by increased volume and a close above key moving averages.
CertiK (CTK) has garnered notable attention in the blockchain security space, offering real-time auditing and on-chain monitoring services. With rising concerns around security and smart contract vulnerabilities, projects like CertiK are becoming increasingly relevant. This fundamental strength adds further confidence to the technical bullish outlook for CTKUSDT.
Traders and investors should closely monitor this setup. A breakout from the wedge may lead to a sharp move, creating an excellent entry opportunity with favorable risk-reward. If the current structure holds and breaks upward, the target zone of over 100% upside is a realistic and achievable move based on historical wedge performance.
✅ Show your support by hitting the like button and
✅ Leaving a comment below! (What is You opinion about this Coin)
Your feedback and engagement keep me inspired to share more insightful market analysis with you!
Ctk uzun vade trend kırılımı ve direnç üstü hedefler..Who will wake up this long-dormant monster? Trend break? Resistance break? Or both?
CTKUSDT 1DKeep an eye on #CTK on the daily timeframe.
It’s on the verge of breaking above the descending resistance and the Ichimoku cloud.
In case of a breakout, the targets are:
🎯 $0.4698
🎯 $0.5500
🎯 $0.6302
🎯 $0.7445
⚠️ Always use a tight stop-loss and apply proper risk management.

CTKUSDT Swing Trade Setup – Bottom Confirmed, Uptrend in Progres🔔 CTKUSDT Swing Trade Setup – Bottom Confirmed, Uptrend in Progress
Market Context:
CTK has completed its W-shaped bottoming process, retracing over 80% from the high of $0.98 to the bottom at $0.213. After multiple sessions of accumulation around the $0.213 area, price has gradually recovered to $0.2834, showing early signs of a potential mid-term uptrend.
While the price increase isn't explosive (yet), the technical structure now supports a bullish swing opportunity. This setup is based on weekly bottom confirmation and progressive bullish structure on daily candles.
📌 Trade Plan (Swing Spot)
Trade Type: Buy Spot (Swing Strategy)
Entry Zone: $0.213 – $0.28
Target Zone: $0.55 – $0.75
Trailing Strategy: Monitor D1 peaks for trailing exit.
🧭 Notes:
Risk management is key. Position sizing should align with your personal risk tolerance.
The setup aligns with a larger cycle recovery, so patience is required.
Watch for breakout confirmation and daily momentum signals.
🚀 CTK may not pump fast, but it's quietly rebuilding strength. Let's ride the wave.
#CTK #CTKUSDT #SwingTrade #CryptoAnalysis #SpotTrading #Altcoins #TradingViewIdeas

CTKUSDT UPDATE
Pattern: Falling Wedge Breakout
Current Price: \$0.2713
Target Price: \$0.61
Target % Gain: 130%
Technical Analysis: CTK has broken out of a long-term falling wedge on the 1D chart with strong bullish candles. The breakout is supported by a noticeable increase in momentum, suggesting potential continuation toward the \$0.61 target.
Time Frame: 1D

CTKUSDT Forming Strong Bullish ReversalCTKUSDT is currently displaying a strong bullish reversal setup with a well-formed falling wedge pattern on the chart. This classic pattern is known for signaling a potential breakout after a period of consolidation and downward pressure. As the price approaches the apex of the wedge with increasing volume, technical traders are eyeing a potential breakout to the upside, which could yield gains in the range of 90% to 100%+ based on historical wedge breakouts.
The volume dynamics are aligning with the price structure, suggesting accumulation at lower levels. This behavior often precedes major bullish moves, particularly when supported by a clear technical base. The falling wedge breakout, if confirmed with a daily close above the upper trendline, could open the doors to a strong bullish trend, especially with broader market sentiment showing signs of recovery.
Investor interest in CTKUSDT has been steadily growing, and recent market developments suggest that the project is gaining attention for its fundamentals as well. This makes the current technical setup even more compelling, as it combines strong chart signals with improving investor confidence. The 1D chart structure supports a bullish narrative, and traders should watch for volume spikes and retest confirmations after breakout for added validation.
Given the confluence of technical patterns, volume behavior, and growing market engagement, CTKUSDT stands out as a high-potential altcoin poised for an aggressive move. Traders looking for breakout opportunities in the current crypto cycle should keep a close eye on this pair.
✅ Show your support by hitting the like button and
✅ Leaving a comment below! (What is You opinion about this Coin)
Your feedback and engagement keep me inspired to share more insightful market analysis with you!

Shentu Back To Baseline, 200% Minimum, Fast!We have a very good chart setup here but I will focus on one target only and the short-term, "back to baseline."
Shentu is about to make a strong jump. One of those that can leave us with our mouths wide open. Similar to 30-April but without the rejection and lower low.
This time, the jump will result in long-term growth. Of course, there can be some daily growth first before this jump. The 200% profits potential target is the minimum, there is huge potential for growth, CTKuSDT, long-term. As well as mid-term. And I am telling you now about the short-term, so everything is pointing up.
The main low happened in April. The recent lower low is a form of consolidation with a bearish bent. This type of consolidation can produce higher lows or lower low but the end result doesn't change, which is a strong rise with a higher high compared to the last high.
This is one is good and already on the move. Four days green, but this is only the start.
Thank you for reading and good profits. It will be great.
Namaste.

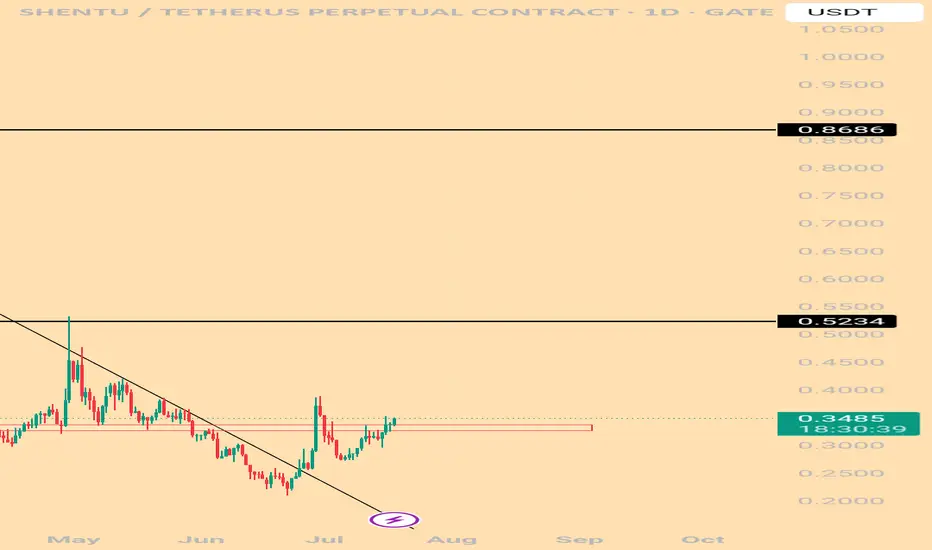
Shentu Recovering From New All-Time Low (645% Easy Target)Shentu (CTKUSDT) is pretty interesting right now and good looking from a TA perspective, the bottom is in.
This week is just starting and CTKUSDT trades full green, moving at the upper limit of the candle.
After a new All-Time Low, same date, 7-April, all the sessions closed green. Three consecutive weeks closing green and this fourth week is already recovering above the previous All-Time Low October 2023. As soon as CTKUSDT moves above this level, the bullish bias strengthens and is fully confirmed (0.3989). The bottom is confirmed based on marketwide action.
So here we have a bottom catch. Very close to the ATL and a very good entry/buy-zone.
From this point forward, we will experience long-term growth.
Just as in mid-2021 the conditions today are the same. The market is set to start growing in the coming weeks and days with bullish momentum building up. By late May, as well as in June and July, we will be experiencing massive growth. Not only Shentu but most of the Altcoins market will be participating in this bullish phase.
This is a great opportunity, it is still early for this pair.
Easy targets can be seen on the chart.
» First target, 387% is very easy. A strong target is next at 2.91 for 645%. This isn't likely to be the peak of the 2025 bull market, but these are high probability targets, hard to miss.
As the bullish cycle develops, we will look closer and consider the ATH potential and more. Some pairs will definitely move first and depending on how they perform we will have some clues as to how the rest of the market will do.
For now, buy and hold.
April is reaching its end, in May, we will have full blown bullish action all across the Altcoins market.
Thanks a lot for your continued support.
Namaste.

CTKUSDT | Critical Resistance Levels ConfirmedCTKUSDT is currently testing a key resistance area, and the blue boxes have proven to be robust resistance levels. These zones have consistently repelled upward movement, indicating strong selling pressure at these levels.
Key Observations
• Strong Resistance Areas: The blue boxes mark critical points where sellers dominate, making any bullish breakthrough challenging.
• Confirmation is Essential: I rely on clear low timeframe (LTF) breakdowns combined with CDV and volume confirmations to validate my setups. Without proper confirmation, no trade is taken.
• Adaptive Approach: While the current setup points to resistance, if the price breaks above these levels with significant volume and retests them as support, I will quickly reassess my bias.
How to Trade
If the price approaches and reacts negatively at the blue boxes, it presents a prime short opportunity. I will wait for LTF signals before entering.
In the event of a strong breakout with volume followed by a retest, I will adjust and consider a long entry instead.
The strategy is data-driven and disciplined—no emotional decisions, only precise execution based on market signals.
Why Trust This Analysis
I trade with a level of expertise that sets me apart from the average trader. My analysis is backed by years of experience and a track record of high success, which you can verify on my profile. Most traders simply guess, but I use proven methodologies to pinpoint exact resistance and support levels. Follow these insights to enhance your edge and trade with confidence.
📌I keep my charts clean and simple because I believe clarity leads to better decisions.
📌My approach is built on years of experience and a solid track record. I don’t claim to know it all but I’m confident in my ability to spot high-probability setups.
📌If you would like to learn how to use the heatmap, cumulative volume delta and volume footprint techniques that I use below to determine very accurate demand regions, you can send me a private message. I help anyone who wants it completely free of charge.
🔑I have a long list of my proven technique below:
🎯 ZENUSDT.P: Patience & Profitability | %230 Reaction from the Sniper Entry
🐶 DOGEUSDT.P: Next Move
🎨 RENDERUSDT.P: Opportunity of the Month
💎 ETHUSDT.P: Where to Retrace
🟢 BNBUSDT.P: Potential Surge
📊 BTC Dominance: Reaction Zone
🌊 WAVESUSDT.P: Demand Zone Potential
🟣 UNIUSDT.P: Long-Term Trade
🔵 XRPUSDT.P: Entry Zones
🔗 LINKUSDT.P: Follow The River
📈 BTCUSDT.P: Two Key Demand Zones
🟩 POLUSDT: Bullish Momentum
🌟 PENDLEUSDT.P: Where Opportunity Meets Precision
🔥 BTCUSDT.P: Liquidation of Highly Leveraged Longs
🌊 SOLUSDT.P: SOL's Dip - Your Opportunity
🐸 1000PEPEUSDT.P: Prime Bounce Zone Unlocked
🚀 ETHUSDT.P: Set to Explode - Don't Miss This Game Changer
🤖 IQUSDT: Smart Plan
⚡️ PONDUSDT: A Trade Not Taken Is Better Than a Losing One
💼 STMXUSDT: 2 Buying Areas
🐢 TURBOUSDT: Buy Zones and Buyer Presence
🌍 ICPUSDT.P: Massive Upside Potential | Check the Trade Update For Seeing Results
🟠 IDEXUSDT: Spot Buy Area | %26 Profit if You Trade with MSB
📌 USUALUSDT: Buyers Are Active + %70 Profit in Total
🌟 FORTHUSDT: Sniper Entry +%26 Reaction
🐳 QKCUSDT: Sniper Entry +%57 Reaction
📊 BTC.D: Retest of Key Area Highly Likely
📊 XNOUSDT %80 Reaction with a Simple Blue Box!
📊 BELUSDT Amazing %120 Reaction!
I stopped adding to the list because it's kinda tiring to add 5-10 charts in every move but you can check my profile and see that it goes on..

CTK/USDT in Danger? Key Levels That Will Decide the Next MoveYello, Paradisers! Is CTK/USDT on the verge of a major breakdown, or will bulls make a comeback? Let’s dive in!
💎#CTKUSDT has broken below its ascending channel, signaling a potential trend shift. Right now, the $0.41 - $0.42 level, which previously acted as strong support, has turned into resistance. This is a critical area if buyers fail to reclaim it, the selling pressure will likely continue. Adding to the bearish outlook, price is trading below both the EMA 50 and EMA 200, further confirming that sellers remain in control.
💎A fair value gap (FVG) near $0.41 could act as a magnet for a short-term bounce, but unless price reclaims this level with strength, the downtrend remains intact. If the rejection plays out, the next target to the downside is $0.3484, with a deeper drop potentially reaching the major support zone at $0.3091.
💎On the flip side, a break above the major supply zone at $0.4631 would completely invalidate the bearish setup and open the door for another strong rally. However, as it stands, the market structure favors further downside, and a rejection at resistance could accelerate the decline.
MyCryptoParadise
iFeel the success🌴

CTKUSDT 1WCTK ~ 1W Analysis
#CTK This is the lowest support for now. If you still have a Conviction on this Coin, Maybe this support you can consider to start buying again.

CTKUSDT 1WCTK ~ 1W
#CTK Technically, this coin has successfully made the transition from bear to bull, buy from here if you still have Conviction on coins with a minimum target of 20%++

CTKUSDT | %756 Daily Volume Spike Dont Sleep on This!CTKUSDT Daily Analysis
Volume Surge: Daily trading volume has increased by 756%, signaling a notable rise in market activity.
Demand Zones:
Below Green Line: Key levels where potential demand zones are identified.
Blue Box: Highlighted as a favorable area for buyer activity.
I keep my charts clean and simple because I believe clarity leads to better decisions.
My approach is built on years of experience and a solid track record. I don’t claim to know it all, but I’m confident in my ability to spot high-probability setups.
My Previous Analysis
🐶 DOGEUSDT.P: Next Move
🎨 RENDERUSDT.P: Opportunity of the Month
💎 ETHUSDT.P: Where to Retrace
🟢 BNBUSDT.P: Potential Surge
📊 BTC Dominance: Reaction Zone
🌊 WAVESUSDT.P: Demand Zone Potential
🟣 UNIUSDT.P: Long-Term Trade
🔵 XRPUSDT.P: Entry Zones
🔗 LINKUSDT.P: Follow The River
📈 BTCUSDT.P: Two Key Demand Zones
🟩 POLUSDT: Bullish Momentum
🌟 PENDLEUSDT: Where Opportunity Meets Precision
🔥 BTCUSDT.P: Liquidation of Highly Leveraged Longs
🌊 SOLUSDT.P: SOL's Dip - Your Opportunity
🐸 1000PEPEUSDT.P: Prime Bounce Zone Unlocked
🚀 ETHUSDT.P: Set to Explode - Don't Miss This Game Changer
🤖 IQUSDT: Smart Plan
⚡️ PONDUSDT: A Trade Not Taken Is Better Than a Losing One
💼 STMXUSDT: 2 Buying Areas
🐢 TURBOUSDT: Buy Zones and Buyer Presence

CTKUSDT - Hedge Short OpportunityCTKUSDT Analysis
Current Trend:
CTKUSDT has broken through a strong support zone, signaling a bearish continuation. The breakdown suggests increased selling pressure, with the price likely seeking lower levels.
Remember this is a hedge short - I carry longs in the market.
Key Observations:
Support Breakdown: The previously strong support has turned into a resistance zone, aligning with the bearish structure.
Sell Zone: A potential short-entry opportunity exists near the blue box, which marks the retest area of the broken support (now resistance).
Trading Plan:
Bearish Entry:
Wait for the price to retrace to the blue box zone.
Confirm the setup with bearish price action (e.g., rejection wicks or bearish engulfing candles).
Targets:
Initial target: Next significant support zone below.
Extended target: Trail stops as the price continues downward.
Invalidation:
If the price breaks and closes above the blue box, reassess the setup.
Additional Notes:
Monitor volume; lower volume on retraces and higher volume on declines strengthens the bearish case.
Set stops above the blue box to manage risk effectively.
I keep my charts clean and simple because I believe clarity leads to better decisions.
My approach is built on years of experience and a solid track record. I don’t claim to know it all, but I’m confident in my ability to spot high-probability setups.
My Previous Analysis
🐶 DOGEUSDT.P: Next Move
🎨 RENDERUSDT.P: Opportunity of the Month
💎 ETHUSDT.P: Where to Retrace
🟢 BNBUSDT.P: Potential Surge
📊 BTC Dominance: Reaction Zone
🌊 WAVESUSDT.P: Demand Zone Potential
🟣 UNIUSDT.P: Long-Term Trade
🔵 XRPUSDT.P: Entry Zones
🔗 LINKUSDT.P: Follow The River
📈 BTCUSDT.P: Two Key Demand Zones
🟩 POLUSDT: Bullish Momentum
🌟 PENDLEUSDT: Where Opportunity Meets Precision
🔥 BTCUSDT.P: Liquidation of Highly Leveraged Longs
🌊 SOLUSDT.P: SOL's Dip - Your Opportunity
🐸 1000PEPEUSDT.P: Prime Bounce Zone Unlocked
🚀 ETHUSDT.P: Set to Explode - Don't Miss This Game Changer
🤖 IQUSDT: Smart Plan
⚡️ PONDUSDT: A Trade Not Taken Is Better Than a Losing One
💼 STMXUSDT: 2 Buying Areas
