CTSI About to Explode or Fakeout Incoming?Yello Paradisers is CTSI finally ready to break out, or are we looking at another trap to wipe out emotional traders?
💎#CTSIUSDT has been moving inside a clean descending channel, respecting both support and resistance levels. The price recently bounced strongly from the key demand zone around $0.
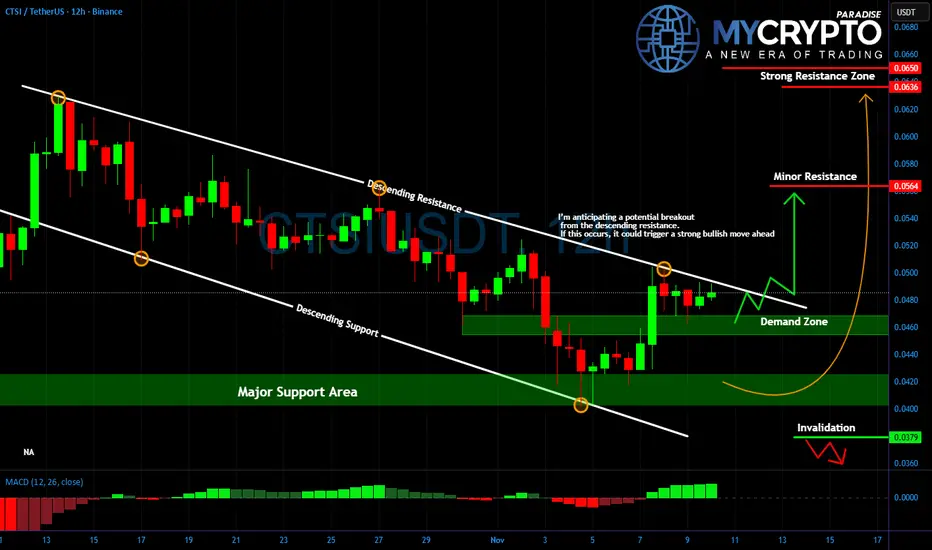
CTSIUSDT 1D#CTSI is moving inside a descending channel on the daily chart. Volume has increased significantly, and the MACD is giving a bullish signal. CTSI has attempted twice to break above the channel resistance but was rejected by a resistance cluster, which includes the channel resistance, the daily SMA50

CTSIUSDT Forming Falling WedgeCTSIUSDT is showcasing a textbook falling wedge pattern on the daily and weekly charts, a classic bullish reversal signal that's drawing sharp attention from crypto traders amid the ongoing altcoin recovery phase in late 2025. This converging downward-sloping formation, with the upper resistance lin

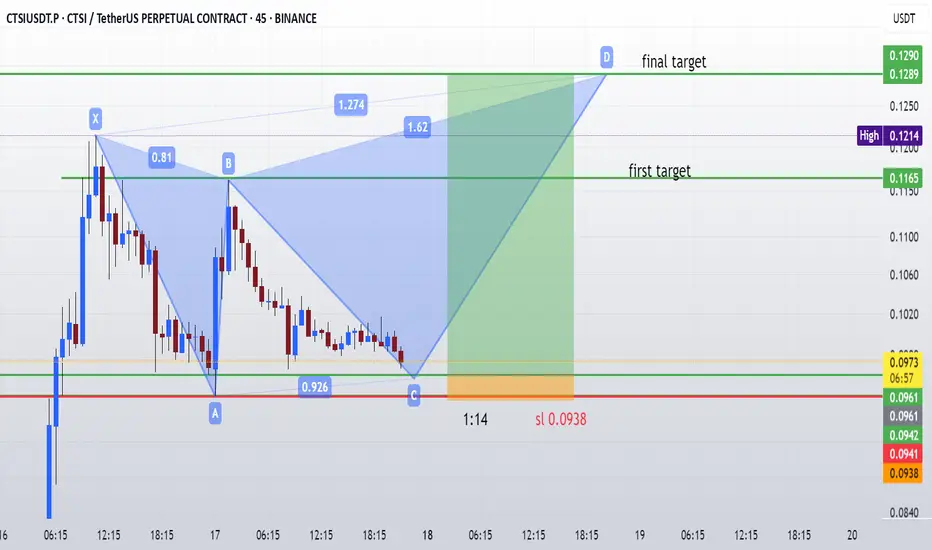
CTSI showing a good investment opportunityHi Everyone;
today we have good risk to reward Investment opportunity
it is more than 85 times the risk and the chart is look very promising.
Good Luck Every one

CTSI — The Three-Quarter Trap Before ExpansionCTSI is dangling bait. Price hovers at 0.083, giving comfort to longs — but the real prize sits lower. Markets love the three-quarter retrace: deep enough to flush weak hands, not deep enough to kill the trend.
Imagine a slingshot: you pull it back further than feels safe, the band creaks, everyone


CTSIUSDT Forming Bullish PennantCTSIUSDT is currently forming a bullish pennant pattern, a strong continuation setup that often signals an upcoming breakout. After a healthy upward rally, the price has entered into consolidation, creating a pennant structure with tightening price action. This type of formation, especially when sup

CTSI/USDT 4H chartCTSI/USDT 4H chart
Levels:
• Resistance (R3): ~55.46%
• Resistance (R2): ~8.76%
• Resistance (R1): ~1.90%
• Support (S1): ~-12.04%
• Support (S2): ~-16.40%
• Support Zone: extends toward ~-23.38%
What the chart shows:
1. Price pumped hard to R3 (55.46%) but got rejected strongly.
2. Now it’s conso

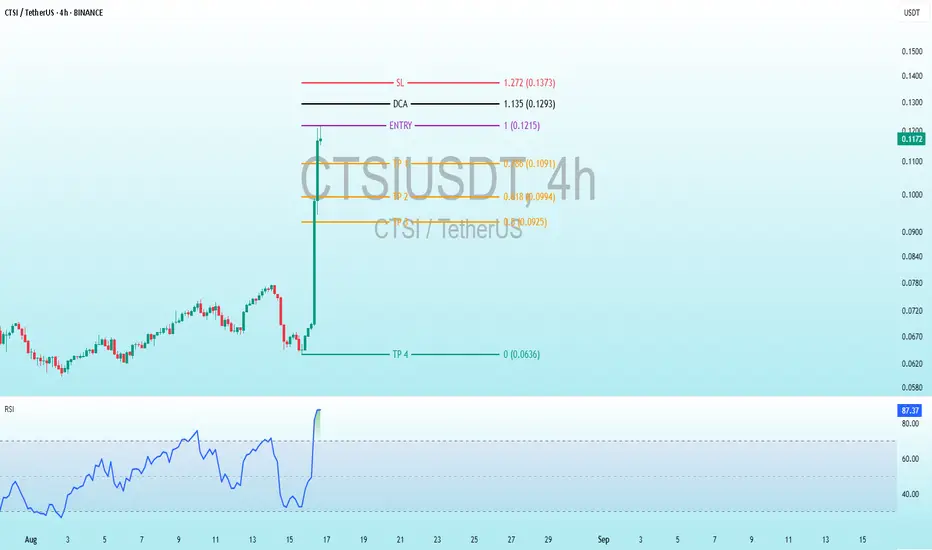
$CTSI Overbought Surge: 4H Trading Strategy with RSI AlertBINANCE:CTSIUSDT
Trading Levels:
Entry: 1.00 (0.1215 USDT) - The level where the initial purchase is planned.
DCA (Dollar-Cost Averaging): 1.135 (0.1293 USDT) - An additional buying point if the price rises.
SL (Stop Loss): 1.272 (0.1373 USDT) - The level where the loss would be limited.
TP (Take
See all ideas
Summarizing what the indicators are suggesting.
Oscillators
Neutral
SellBuy
Strong sellStrong buy
Strong sellSellNeutralBuyStrong buy
Oscillators
Neutral
SellBuy
Strong sellStrong buy
Strong sellSellNeutralBuyStrong buy
Summary
Neutral
SellBuy
Strong sellStrong buy
Strong sellSellNeutralBuyStrong buy
Summary
Neutral
SellBuy
Strong sellStrong buy
Strong sellSellNeutralBuyStrong buy
Summary
Neutral
SellBuy
Strong sellStrong buy
Strong sellSellNeutralBuyStrong buy
Moving Averages
Neutral
SellBuy
Strong sellStrong buy
Strong sellSellNeutralBuyStrong buy
Moving Averages
Neutral
SellBuy
Strong sellStrong buy
Strong sellSellNeutralBuyStrong buy
Displays a symbol's price movements over previous years to identify recurring trends.