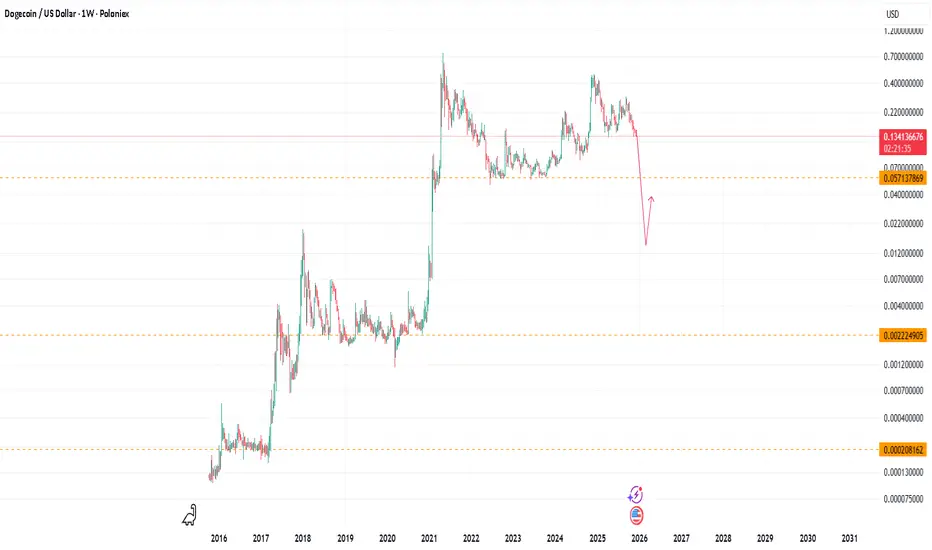
DOGE to 0.0135 USDThere won't be another alt season until DOGEBTC returns to 20 satoshis (BTCUSD = 69k, DOGEUSD = 0.0135, DOGEBTC = 0.00000020.
Market insights
Dogecoin Wave Analysis – 15 December 2025
- Dogecoin broke long-term support level 0.1365
- Likely to fall to support level 0.1155
Dogecoin cryptocurrency recently broke below the long-term support level 0.1365 (which has been reversing the price from April, as can be seen below).
The breakout of the support level 0.1365 strengthened the bearish pressure on Dogecoin.
Given the clear daily downtrend and the bearish sentiment seen across the crypto markets, Dogecoin cryptocurrency can be expected to fall to the next support level 0.1155.

Doge, boring wave 4?For now, I view the price action Doge is going through as a rather 'boring' formation of wave 4, until proven otherwise.
One thing is certain for me: ~$1-1.5 is inevitable, or it will fulfill my wildest dream of a $4 target. I'll keep accumulating along the way.

The doge is not dead yetThe ASO indicator on the chart looks like it’s repeating the same pattern we saw in 2021. Nothing is certain, but if we start December in the green and break out of this falling wedge and resistance wall, we could enter a larger range. The next move would likely target the upper zone around $0.208–$0.239.
If we fail to hold the current level next week and start below $0.141–$0.139, it’s very likely that the price will drop to a new low, somewhere around $0.065-0.070. That would mean a longer recovery period for Dogecoin to regain structure and rebuild confidence for new FOMO.
We’re in a phase of heavy fear right now, but this trend can reverse extremely quickly and turn into a bull run with maximum FOMO utilization.
good luck.

DOGEUSD - Top of Channel Again Soon price will hit the lower band of drawn channel and price from there tends to act pretty bullishly
Horizontal lines are long periods of stability
Long term view of DOGE on this Weekly timeframe
Good alt choice

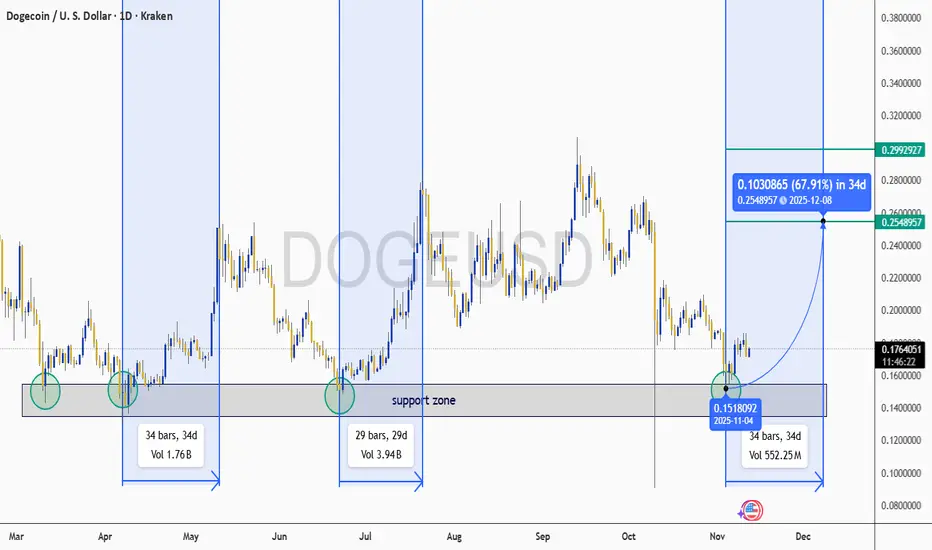
The doge is ready for a jump?DOGE has once again found itself testing a critical local support zone, a level that has historically acted as a springboard for significant price rallies.
In late April, after hitting this zone, DOGE initiated a rally that saw a substantial gain over 34 days.
Remember...history repeats itself. 34 days for a potential 65%? Not too bad, eh?
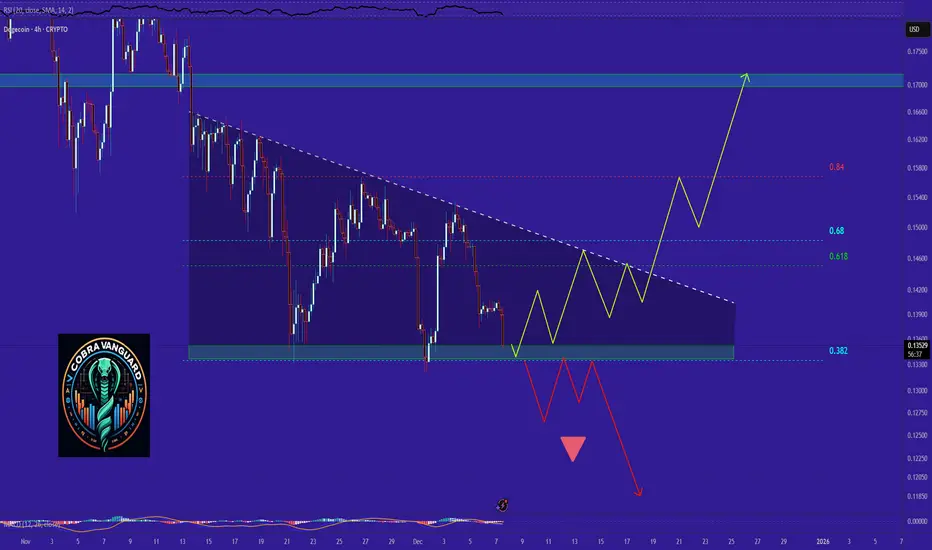
This is my last hope for Dogecoin !!This is my last hope for Dogecoin. If this support is lost and the descending triangle pattern proves valid and the price follows it, Dogecoin will fall below 10 cents for a long time. But since the crypto market often breaks rules and patterns, maybe this time it will reverse again and, after breaking the triangle, push the price back above 17 cents.
What do you think will happen? Leave a comment !
Does it get any better DOGEUSD BuyIt’s as if the Doge has taken a back seat the past few months. The Doge could see the “slide”’that Crypto was in and in particular names like Bitcoin, Ethereum, RIPPLE and DOGEUSD cheap as chips.
I still read analysts with no idea talking about a bitcoin bear market, impending.
Here’s the thing, don’t mistake lower Bitcoin, Ethereum or Ripple prices for actual weakness in their fundamentals and outlook.
President Trump a now advocate has signed off and secured their futures.
Any move back in price is temporary and simply is respecting a bearish pattern that Bitcoin finds itself in and about to complete.
So, it’s a a bit like a well known GOLD TIPPING group stating only 15 hours ago that Gold is overbought. No it ain’t. It sits near the 70 RSI level on daily chart but historical RSI levels are much higher and that is where Cues are taken from.
Where as Bitcoin is no where near overbought, over sold is probably more correct. When something is oversold, Value swings back as sentiment aligns and price starts to rise.
That is how you think in terms of Bitcoin:
In essence, it’s the financial markets’ ultimate golden -child and really, it can do no wrong.
Buy DOGECOIN Daily RSI DIVERGENCE.
* this is not investment advice.,

Trading Levels for DOGEUSD. Trading Levels for DOGEUSD. Anyone can trade on both sides with strict stoploss.

Is it the time to start the g?It seems like a bullish leg is starting, and it will be going around the ATH until late March. The upper degree pattern could be symmetrical or diametric.

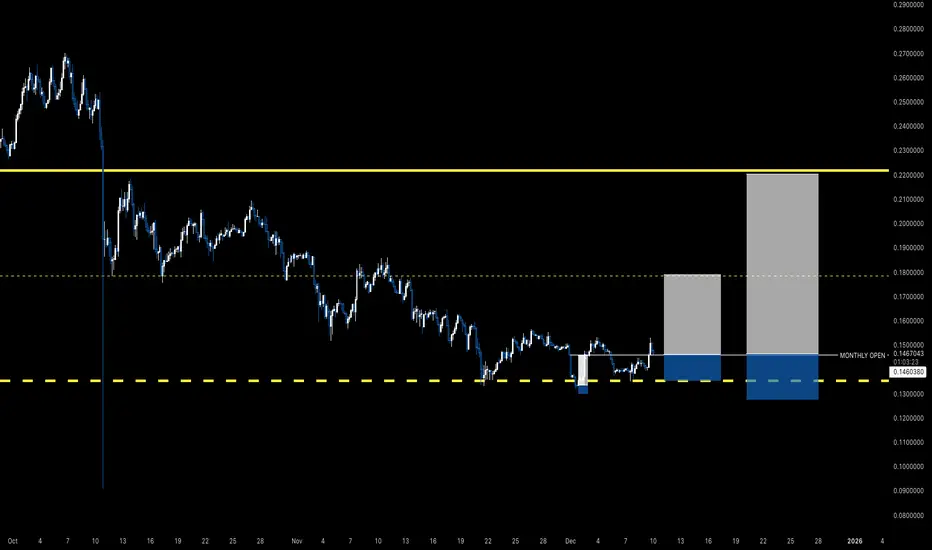
DOGEDOGE Monthly Open line in sand; shouldn't be closing below, especially not below .13 if bullish.
Range from first eighth (.13) to first quarter (.22).
Dogecoin Wave Analysis – 8 December 2025
- Dogecoin reversed from support zone
- Likely to rise to resistance level 158.00
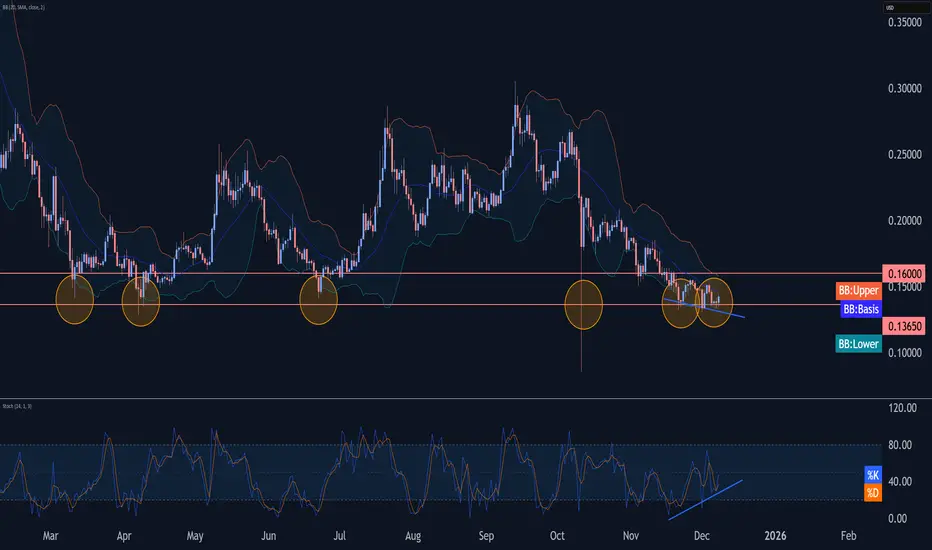
Dogecoin cryptocurrency recently reversed up from the strong support zone between the multi-month support level 0.1365 (which has been reversing the price from March) and the lower daily Bollinger Band.
The upward reversal from this support zone continues the active minor impulse wave 3 which started from the same support area at the end of November.
Given the strength of the support level 0.1365 and the bullish divergence on the daily Stochastic indicator, Dogecoin currency pair can be expected to rise to the next resistance level 0.1600.
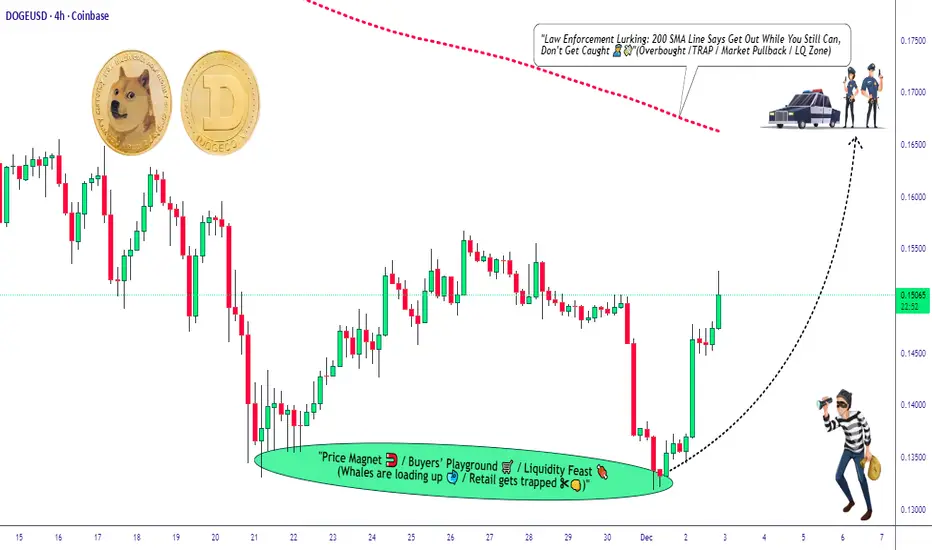
Is DOGE/USD Preparing for a Major Upside Move?🚀 DOGE/USD: ULTIMATE SWING TRADE BLUEPRINT 🚀
Catch the Rocket Before Liftoff!
🔥 WHY THIS SETUP IS FIRE
BULLISH MOMENTUM building on DOGE against the USD.
Key levels aligning for a potential SWING OPPORTUNITY.
Perfect for traders looking to RIDE THE VOLATILITY with a clear plan.
🎯 TRADE PLAN (BULLISH)
Entry: ANY PRICE – Flexibility is key! Scale in strategically.
Stop Loss: THIEF SL @ 0.14000 ⚠️
(Note: I’m not your financial advisor – adjust SL based on YOUR strategy & risk tolerance. Place SL ONLY after breakout confirmation!)
Take Profit: TP @ 0.16500 ✅
SMA acting as strong resistance + overbought signals = trap zone.
Escape with profits before the pullback!
(Reminder: TP is YOUR choice – take money at your own risk!)
📌 DEAR LADIES & GENTLEMEN (THIEF OG’s) 👑
This is a BLUEPRINT – not financial advice. Adapt it to YOUR style. Your money, your rules.
🔗 RELATED PAIRS TO WATCH
$BTC/USD – Crypto king moves, DOGE often follows sentiment.
$SHIB/USD – Meme coin sibling, correlation spikes during hype cycles.
$ETH/USD – Altcoin leader, influences broader crypto momentum.
SP:SPX (S&P 500) – Risk-on/risk-off cues can impact crypto flows.
💡 KEY CORRELATION INSIGHTS
DOGE often mirrors BTC’s direction with amplified volatility.
Meme coin rallies can be sector-wide – watch SHIB for confirmation.
USD strength (DXY) inversely affects crypto – a falling DXY = crypto bullish signal.
LIKE & FOLLOW if this resonates – boosts visibility for all!
COMMENT your entry & exit strategies – let’s build knowledge together.
SHARE to help fellow traders spot the opportunity.
📈 Stay smart, trade sharp, and manage your risk!
✅ Follow for more high-impact setups.
#DOGE #DOGEUSDT #Crypto #SwingTrade #TradingView #Memecoin #Bullish #TradingStrategy #Cryptocurrency #Bitcoin #Altcoins
Dogecoin Wave Analysis – 2 December 2025
- Dogecoin reversed from support zone
- Likely to rise to resistance level 0.1750
Dogecoin cryptocurrency recently reversed from the support zone between the long-term support level 0.1400 (which stopped all downward waves from the start of 2025) and the lower weekly Bollinger Band October.
The upward reversal from this support zone continues the active weekly impulse wave (3) from October.
Given the strength of the support level 0.1400 and the improved sentiment seen across the crypto markets today, Dogecoin cryptocurrency can be expected to rise to the next resistance level 0.1750.

DOGE Breaks Down Below 0.14 – Key Support CracksDOGE just lost the 0.14 level after multiple rejections from the 0.26–0.28 supply zone. RSI is approaching oversold and MACD remains flatlining on the bearish side.
No bullish MSB, no support reclaim. If bulls don’t recover 0.16 quickly, 0.12 becomes the next major level in play.
Structure is clearly bearish and sellers are pressing lower.
Bias: Bearish
Pair: DOGE/USDT
Timeframe: 12H
This is not financial advice, only data analysis. Please consult a qualified financial professional for personalized guidance.

DOGE is meme legend Here we have a slightly different angle of view on Dogecoin with ASO.
We can see that ASO is very accurate in this setting on Dogecoin and does exactly what we want — it always signals a shift, an exchange of momentum.
We cannot fully estimate what lows or highs the price will hit or reach, but it helps us a lot to see that now, based on history, it is literally “the worst is behind us”, and a dead phase is coming.
Yes, we can see that the price could still drop a bit lower and revisit the $0.09–$0.10 area. That is very likely.
But the red curve on ASO — together with the price of Dogecoin — has always experienced the biggest fall exactly when the curve started to break upward from the bottom, meaning the red line rises and the blue line falls.
See you soon, good luck. Don’t give up.
This is the kind of momentum where some memes may be forgotten, but the stronger coins will survive.
Maybe we are already at the bottom maybe the bottom is not far from reality.

Will we go lower?This is a very important point in the dogecoin market. If we close blow, we are doomed.

DOGE forever I’ve saved this chart, and I won’t forget it. In my view, the market is moving inside an ASO parabola, which follows a repeating rhythm of roughly 500 days in a red phase and about 500 days in a green phase. This structure reflects the long accumulation period followed by the explosive growth that has defined previous cycles.
This ASO model makes sense when you look at how DOGE and the broader altcoin market behave over many years. The market tends to fall into deep, quiet zones where sentiment is cold and volatility is low, and then it suddenly shifts into a strong bullish phase without warning. The pattern repeats with almost mechanical precision.
Right now, the chart fits perfectly into the “red phase” of the ASO cycle a period of pressure building beneath the surface. When the transition into the green phase arrives, it usually happens fast and catches most people off guard. That’s why the long-term projection from this structure doesn’t feel unrealistic, it is simply the continuation of a cycle that has been repeating consistently for nearly a decade.
I think a miracle would have to happen for everything to turn around quickly, more likely a miracle will happen in 2026-2028
good luck, thanks

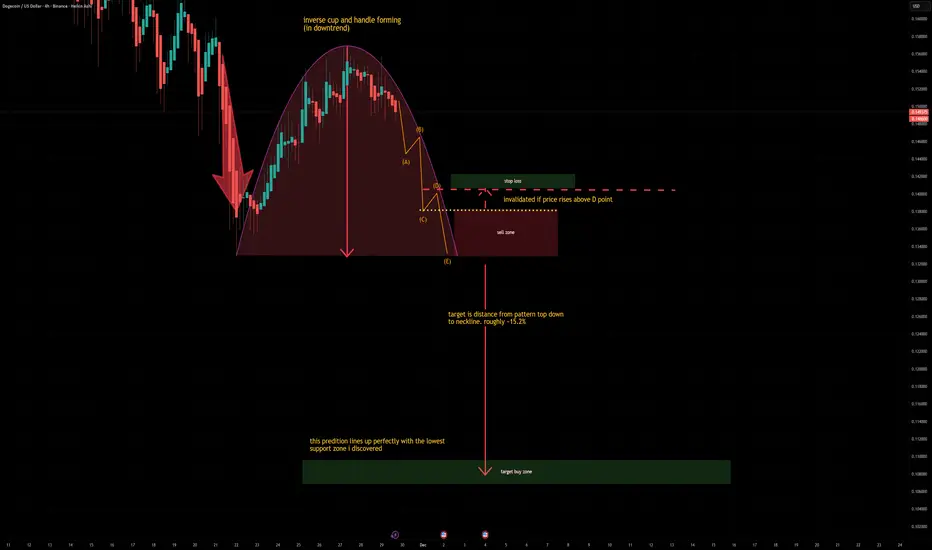
inverse cup & handle formingan inverse cup and handle forming on the 4hr chart
doge could be seeing another massive drop down to the lowest support zone i have discovered above 0.09
lets see how this plays out
i have already exited at 0.1545 when we saw the recent top so if this plays out i could be looking at roughly 30% gain in position
DOGE for the HOlidays?Hello,
This is. Probability map of Doge’s near term future behavior, based on recent “harmonic patterns” or level behavior… at various time frames… scaled to fit the recent levels… dotted are the ceiling, solid the floor ;)
Once we see that a particular pattern is tracking preferential, it can provide a very advantageous look into “future”.
Some times the hardest part is calming the nerves, and just holding position, while waiting for the forecasts to play out.
Doge… good boy!

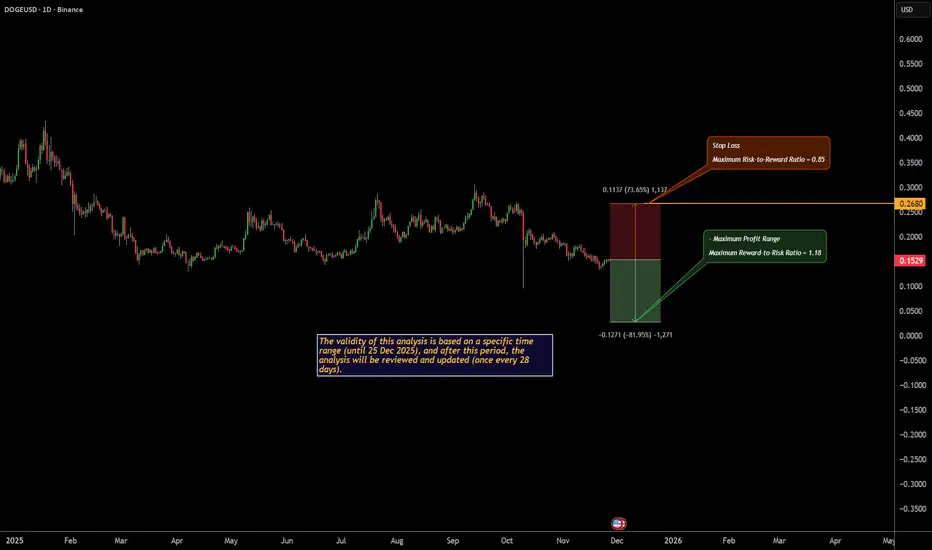
Monthly Crypto Analysis: Dogecoin (DOGEUSD) – Issue 108The analyst expects Dogecoin’s price to decline by the specified end time, based on quantitative analysis.
The take-profit level only highlights the potential price range during this period — it’s optional and not a prediction that the market will necessarily reach it.
You don’t need to go all-in or use leverage to trade wisely.
Allocating just a portion of your funds helps keep overall risk low and ensures a more sustainable approach.
Our strategy is built on institutional portfolio management principles, not the high-risk, all-in trading styles often promoted on social media.
Results are evaluated over the entire analysis period, regardless of whether the take-profit level is reached.
-The validity of this analysis is based on a specific time range (until 25 Dec 2025), and after this period, the analysis will be reviewed and updated (once every 28 days).
DOGE, Weekly bullish divergence!Uptrend remains intact from the wave 4 bottom. We could still be in wave 4 as they are characterised by their long, complex ranges. A flat or a triangle is possible.
Wave (1) appears complete as a leading diagonal followed by a deep wave (2), which is expected after this pattern. Price is bullishly riding the weekly 200EMA but bearish below the pivot. Wave (3) should be powerful and fast; any slow grind may hint that we are still in wave IV
🎯 Terminal target for the business cycle could see prices as high as $1.7 based on Fibonacci extensions
📈 Weekly RSI has printed bullish divergence, a good sign but it can take weeks to play out
👉 Analysis is invalidated below wave (2)

DOGE Can it reach $0.20 again before resuming the downtrend?Dogecoin (DOGEUSD) has been trading within a Channel Down since its December 02 2024 weekly High, which turned out to technically be the top of its Bull Cycle.
The latest Lower Low of that pattern was on the October 06 2025 weekly flash crash but since then it retraced back into the 1W MA50 (blue trend-line) - 1W MA200 (orange trend-line) range. The 1W MA200 has been the market's Support throughout the whole 2025. The 1W MA50 typically assumes the role of the long-term Resistance during Bear Cycles.
As a result, we expect a short-term rebound now for Doge, but that should be limited by the 1W MA50. This is also where the 0.618 Fibonacci retracement level is from the October 06 Low, a Fib level where he September 08 2025 Lower High was priced.
Based on that, Doge could target $0.20 (Fib 0.618) and then resume the downtrend on the Channel's new Bearish Leg. If it follows the -7% decreasing rate of the previous Bearish Leg, we can see it bottom after a 59% decline, which should be around $0.085.
Notice also that last week's Low, wasn't only on the 1W MA200 but also on the 1W RSI's Support Zone. A Zone that has been holding since June 05 2023, essentially the major Support of the Bull Cycle, and has provided four perfect buy entries already.
---
** Please LIKE 👍, FOLLOW ✅, SHARE 🙌 and COMMENT ✍ if you enjoy this idea! Also share your ideas and charts in the comments section below! This is best way to keep it relevant, support us, keep the content here free and allow the idea to reach as many people as possible. **
---
💸💸💸💸💸💸
👇 👇 👇 👇 👇 👇
