DOT – Bullish Reversal on 4H | Inverse Head & Shoulders in Play#Polkadot (#DOT) is showing a strong bullish reversal signal on the 4-hour timeframe, where the price is developing a clean Inverse Head & Shoulders pattern.
Currently, #DOT is forming the right shoulder, indicating that buyers are stepping in and market structure is shifting toward the upside.
Ke
Related pairs

DOTUSDT 1D Chart Analysis 18-Dec-25Stop Loss: 1.098
Entry Point: 1.717
Take Profit 1: 2.300
Take Profit 2: 3.033
Take Profit 3: 3.509
Bullish divergence has formed across the 1D, 4H, and 1H timeframes, indicating a potential reversal from a bearish to a bullish trend. The suggested entry is around 1.717, with expectations for price

DOT Preparing for a Potential Relief Wave from Demand ZoneDOT continues to trade inside a well-defined falling wedge that has been guiding the market since early November. Price recently rejected from the mid-range and is now heading toward the lower boundary of the wedge. This area has acted as a liquidity pocket and a reaction zone several times in the p
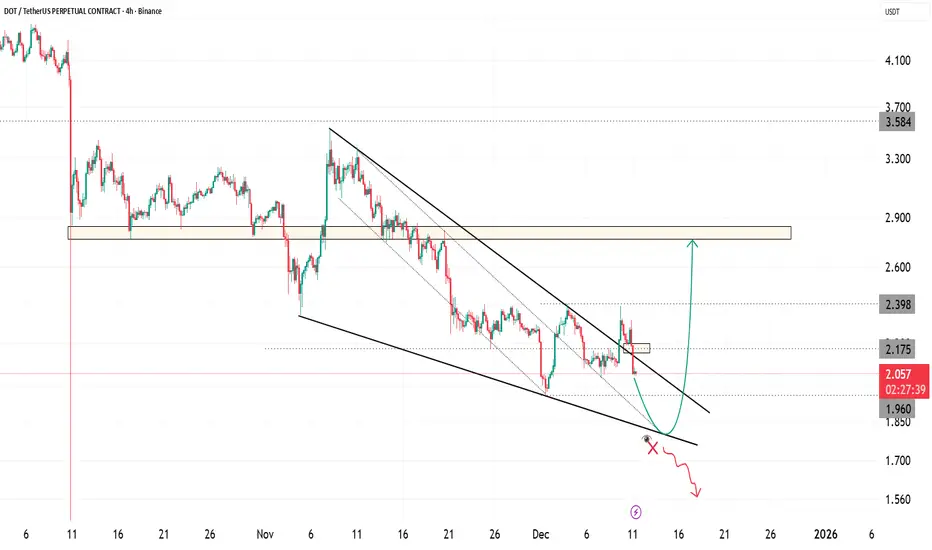
DOT/USD SSL taken → ( upside )Potential bullish expansion
A pullback into supply is expected for mitigation
This is a long-term expectation, anticipated by early 2026 (Q1)
(This is not financial advice. Trade at your own risk)

DOT USDT LONG SIGNAL---
📢 Official Trade Signal – DOT/USDT
📈 Position Type: LONG
💰 Entry Price: 2.179 (Limit Order)
---
🎯 Take-Profit Targets (Partial Exits):
• TP1: 2.218
• TP2: 2.248
• TP3: 2.300
• TP4: 2.393
• TP5: —
---
🛑 Stop-Loss: 2.084
📊 Timeframe: 15m
⚖️ Risk/Reward Ratio: ≈ 2.25 (based on TP4)
💥 Suggeste

Polkadot (DOT): Looking For Bullish Movement | Unfilled ZoneDOT is holding the smaller support zone well, and that’s exactly where the first bullish signs started to form. The tap into that zone got picked up quickly, showing buyers are willing to react there, which is why the long makes sense from this area.
What we need next is a clean reclaim of the shor


POLKADOT ($DOT) Polkadot (DOT) Weekly Chart (1W) Technical Analysis
Examining the Polkadot (DOT) weekly chart, we can see that the asset is at a highly critical and historic juncture. From the perspective of a technical analyst, let's detail this chart regarding market cycle, critical support/resistance levels, a

#DOT/USDT :BUY LOW#DOT
The price is moving within an ascending channel on the 1-hour timeframe and is adhering to it well. It is poised to break out strongly and retest the channel.
We have a downtrend line on the RSI indicator that is about to break and retest, which supports the upward move.
There is a key suppo

POLKADOT – LONG SETUP - LOADING SHORT SQUEEZE POTENTIALTraders,
$Polkadot is close to forming a high probability long setup, but it is not confirmed yet.
Here is the compact breakdown.
WHY DOT IS SETTING UP
Since 08 November price has been grinding down
Spot CVD, Coin Margined CVD and Stablecoin Margined CVD all fell with price which confirms re

See all ideas
Summarizing what the indicators are suggesting.
Oscillators
Neutral
SellBuy
Strong sellStrong buy
Strong sellSellNeutralBuyStrong buy
Oscillators
Neutral
SellBuy
Strong sellStrong buy
Strong sellSellNeutralBuyStrong buy
Summary
Neutral
SellBuy
Strong sellStrong buy
Strong sellSellNeutralBuyStrong buy
Summary
Neutral
SellBuy
Strong sellStrong buy
Strong sellSellNeutralBuyStrong buy
Summary
Neutral
SellBuy
Strong sellStrong buy
Strong sellSellNeutralBuyStrong buy
Moving Averages
Neutral
SellBuy
Strong sellStrong buy
Strong sellSellNeutralBuyStrong buy
Moving Averages
Neutral
SellBuy
Strong sellStrong buy
Strong sellSellNeutralBuyStrong buy
Displays a symbol's price movements over previous years to identify recurring trends.
Frequently Asked Questions
The current price of Polkadot / Tether USD (DOT) is 1.834 USDT — it has fallen −0.70% in the past 24 hours. Try placing this info into the context by checking out what coins are also gaining and losing at the moment and seeing DOT price chart.
Polkadot / Tether USD price has fallen by −8.89% over the last week, its month performance shows a −31.87% decrease, and as for the last year, Polkadot / Tether USD has decreased by −73.57%. See more dynamics on DOT price chart.
Keep track of coins' changes with our Crypto Coins Heatmap.
Keep track of coins' changes with our Crypto Coins Heatmap.
Polkadot / Tether USD (DOT) reached its highest price on Aug 13, 2020 — it amounted to 299.000 USDT. Find more insights on the DOT price chart.
See the list of crypto gainers and choose what best fits your strategy.
See the list of crypto gainers and choose what best fits your strategy.
Polkadot / Tether USD (DOT) reached the lowest price of 1.946 USDT on Dec 12, 2025. View more Polkadot / Tether USD dynamics on the price chart.
See the list of crypto losers to find unexpected opportunities.
See the list of crypto losers to find unexpected opportunities.
The safest choice when buying DOT is to go to a well-known crypto exchange. Some of the popular names are Binance, Coinbase, Kraken. But you'll have to find a reliable broker and create an account first. You can trade DOT right from TradingView charts — just choose a broker and connect to your account.
Crypto markets are famous for their volatility, so one should study all the available stats before adding crypto assets to their portfolio. Very often it's technical analysis that comes in handy. We prepared technical ratings for Polkadot / Tether USD (DOT): today its technical analysis shows the sell signal, and according to the 1 week rating DOT shows the sell signal. And you'd better dig deeper and study 1 month rating too — it's sell. Find inspiration in Polkadot / Tether USD trading ideas and keep track of what's moving crypto markets with our crypto news feed.
Polkadot / Tether USD (DOT) is just as reliable as any other crypto asset — this corner of the world market is highly volatile. Today, for instance, Polkadot / Tether USD is estimated as 1.15% volatile. The only thing it means is that you must prepare and examine all available information before making a decision. And if you're not sure about Polkadot / Tether USD, you can find more inspiration in our curated watchlists.
You can discuss Polkadot / Tether USD (DOT) with other users in our public chats, Minds or in the comments to Ideas.