#EGLD Deep Value Zone with High Convexity SetupChart Context:
• Pair: EGLD/USDT
• Timeframe: 1D
• Exchange: Binance
• Structure: Multi-year downtrend, now testing historical demand zone.
Analysis:
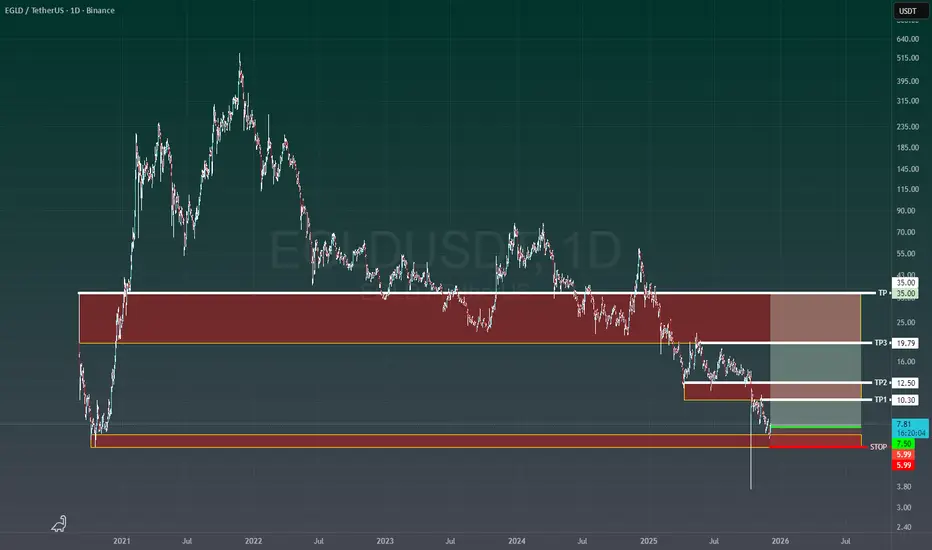
EGLD has completed a full cycle from its 2021 peak (> $500) into a prolonged structural decline. Price recently swept deep liquidity at $5–$6 , signaling capitulation and absorption. This zone aligns with historical demand and offers asymmetric risk/reward for tactical longs.
Key Levels:
• Entry: $7.50
• STOP: $5.99 (below capitulation wick)
• TP1: $10.30
• TP2: $12.50
• TP3: $19.79
• TP4: $35.00
Risk/Reward Profile (Entry $7.50):
• Risk: $1.51
• TP1: Reward $2.80 → 1.85R
• TP2: Reward $5.00 → 3.31R
• TP3: Reward $12.29 → 8.14R
• TP4: Reward $27.50 → 18.21R
• Blended R (25% scale-out each TP): ~7.88R
Execution Plan:
• Initial STOP: $5.99
• Scale-out:
– TP1: 10%
– TP2: 20%
– TP3: 30%
– TP4: 40%
• Trail:
– Move to break-even after TP1
– Structure-based trailing after TP2
– ATR trail after TP3
Market Maker Perspective:
• Liquidity sweep into $5 zone suggests inventory accumulation.
• Path of least resistance: fill inefficiencies toward $10–$12, then target buyside liquidity near $20+.
• Macro trend remains bearish; this is a counter-trend play , not a confirmed reversal until $15+ is reclaimed.
Risk Disclaimer:
This is not financial advice . Crypto assets are highly volatile. Manage risk strictly and size positions conservatively.
Trade ideas
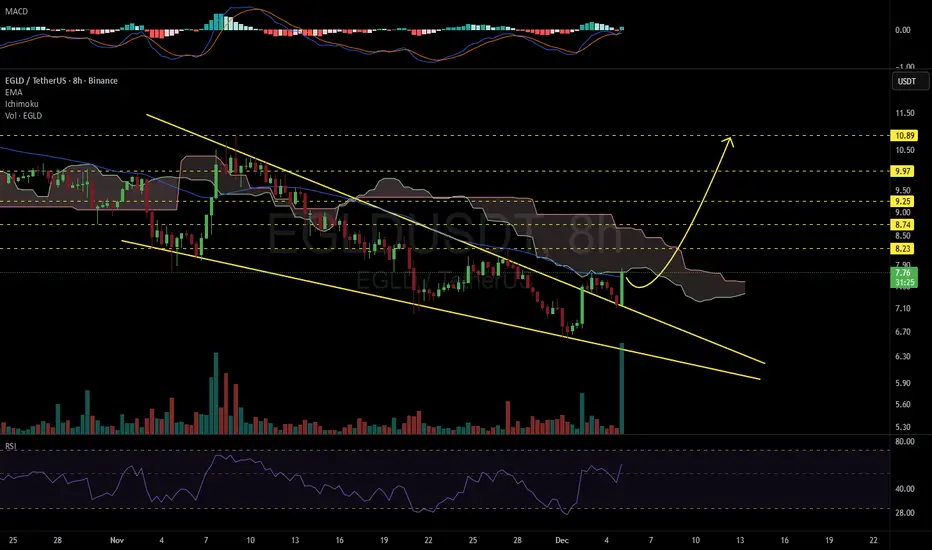
EGLDUSDT 8H#EGLD has broken above the falling wedge pattern on the 8H timeframe. It is currently facing the Ichimoku cloud and the EMA50. With the strong volume coming in, it’s likely to clear this resistance soon as well. Targets:
🎯 $8.23
🎯 $8.74
🎯 $9.25
🎯 $9.97
🎯 $10.89
⚠️ Always remember to use a tight stop-loss and maintain proper risk management.
EGLD BULL RUN LOADINGEGLD Technicals look Bullish as demand increases because of Upcoming Major Maine Upgrade in December. Supernova is MultiversX’s largest upgrade since rebranding, targeting sub-second transaction finality and sharding optimizations. The testnet phase concluded in November 2025, with documentation confirming 92% readiness. This is bullish for EGLD because faster finality could attract high-frequency dApps, potentially increasing network usage and fee burns. However, delayed adoption by developers poses a risk if ecosystem tools lag

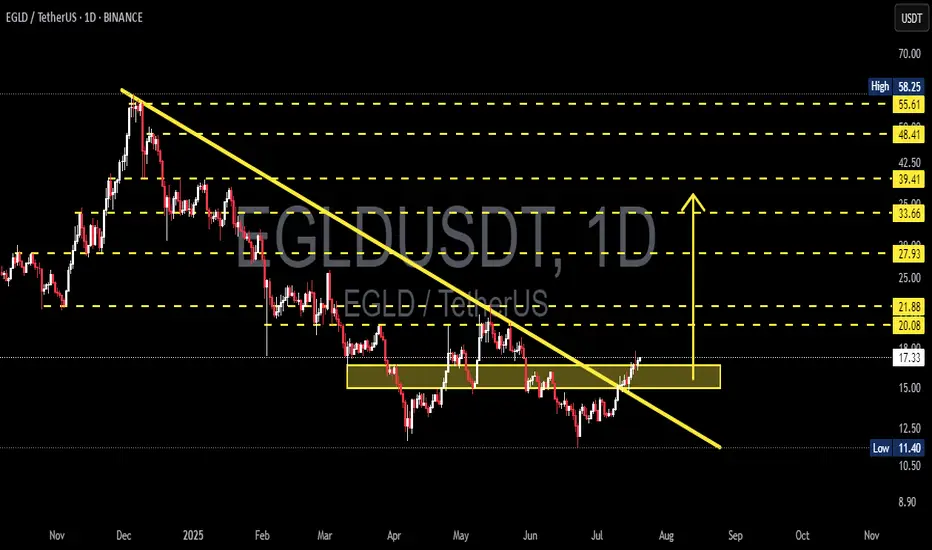
EGLD Descending ChannelThe price action for EGLD is in a well-defined descending channel since early 2022, mapping out lower highs and lower lows as the asset retraced from its previous bull market peak.
Whenever EGLD reached the lower part of its descending channel, price has historically tended to reverse upward, offering short-lived relief rallies.
This setup remains highly speculative and should be approached with caution. The downtrend has repeatedly disappointed, with many previous bounces failing to deliver sustained upside or meaningful trend changes. For this reason, any trades initiated at the channel lows are best sized conservatively, allocate only a small portion of capital.
The $21 level represents a significant resistance for EGLD, if price approaches $21 during a reversal, taking profit will be a good idea.
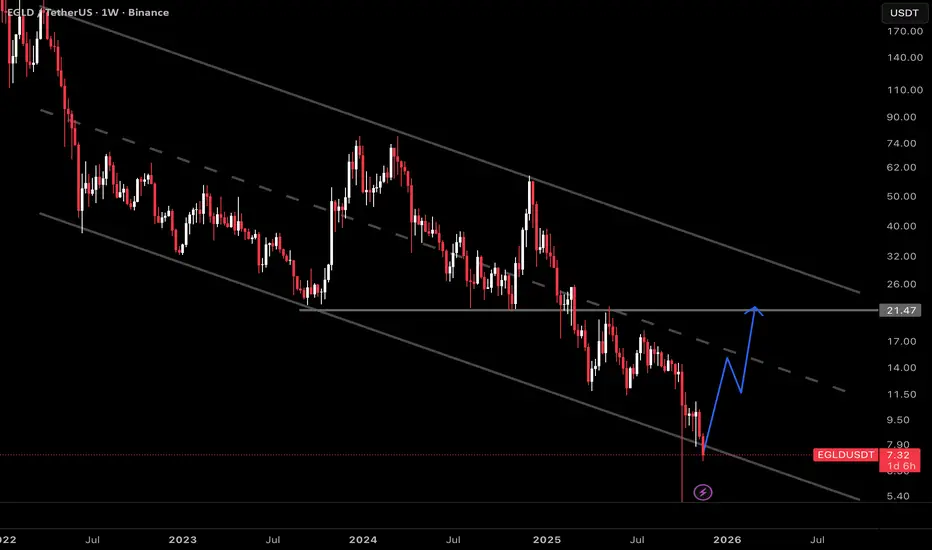
EGLD WThe EGLD currency is at the bottom of a descending channel in which it has been moving for more than 1200 days. Positive divergences are observed on the MACD and RSI, and in my opinion, it could move towards the midline and then the upper range of the channel if it breaks its downward trendline. What is your opinion on this?

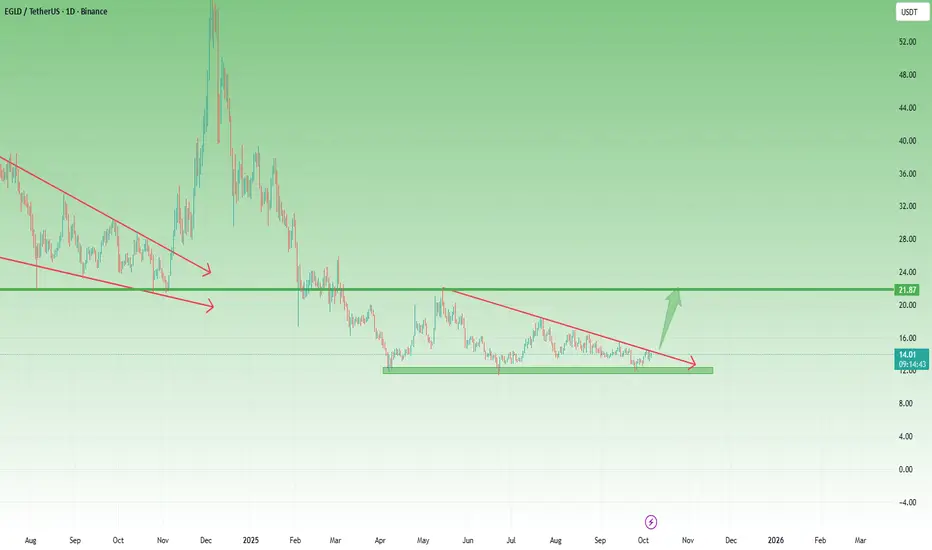
EGLD – Third Touch at $12 Support Could Ignite a Major ReversalEGLD has been on my radar for quite some time...
After forming a major low in April and rallying back toward the $22 zone, the coin pulled back again — effectively confirming that level as strong support.
By the end of September, price revisited the $12 area for the third time, and once again buyers stepped in decisively, triggering a solid rebound. Now, EGLD trades around $14, sitting just below a falling trendline that has capped upside momentum for months.
________________________________________
Technical Outlook
• Support: $12 (triple-tested, major demand zone)
• Resistance: Falling trendline around $14–15
• Soft target: $22 (key resistance and prior reversal area)
________________________________________
My Trading View
Given the strength of this repeated support and the contracting structure, I believe this trendline resistance is likely to break soon. If momentum follows through, EGLD could accelerate sharply to the upside, mirroring past explosive moves.
The setup remains constructive — buying dips above $12 could offer a strong risk–reward opportunity heading into the next leg higher.
EGLDUSDT 1D#EGLD is trading within a descending triangle on the daily chart. In case of a breakout above the triangle resistance and the daily SMA50, the potential targets are:
🎯 $15.20
🎯 $16.19
🎯 $17.17
🎯 $18.58
🎯 $20.37
⚠️ Always remember to use a tight stop-loss and maintain proper risk management.

EGLD is Getting Ready For a RallyEGLD is Getting Ready For a Rally
BTC reached a new all-time high over the weekend. Chances are very high that it could be followed by altcoins as well.
On the other hand, most Altcoins are positioned for another one.
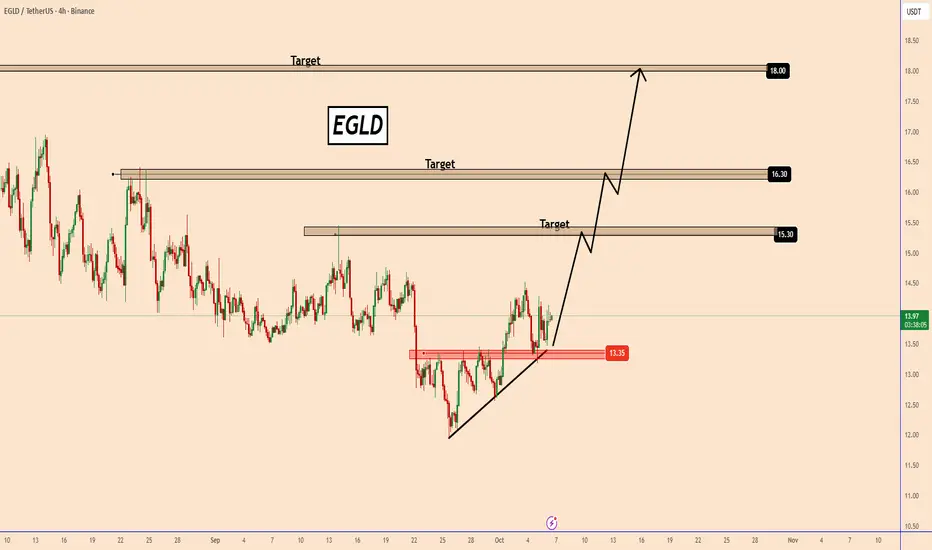
EGLD has a lot of potential. The price has already broken out of a pattern where it had been accumulating for about 3 weeks.
The red zone near 13.35 is holding the price strong so far. I expect an upward move soon, followed big movement.
Main Targets:
15.30
16.30
18.00
You may find more details in the chart!
Thank you and Good Luck!
❤️PS: Please support with a like or comment if you find this analysis useful for your trading day❤️
EGLDUSDT UPDATE#EGLD
UPDATE
EGLD Technical Setup
Pattern: Bullish falling wedge pattern
Current Price: $27.60
Target Price: $43.20
Target % Gain: 56.52%
CRYPTOCAP:EGLD is breaking out of a falling wedge pattern on the 1D timeframe. Current price is $27.60 with a target near $43.20, showing about 56% potential upside. The breakout confirms bullish momentum, suggesting possible continuation if volume sustains. Always use proper risk management.
Time Frame: 1D
Risk Management Tip: Always use proper risk management.

EGLD/USDT – Major Bullish Reversal in Play🚀 Technical Analysis Summary:
EGLD has successfully completed a textbook inverse head and shoulders pattern, signaling a strong bullish reversal after an extended downtrend. The neckline breakout is imminent and could ignite a significant upside move.
📈 Accumulation Zone:
Price has consolidated within a well-defined range over the past several months, forming a large accumulation base, which typically precedes a strong bullish rally — especially when whales and smart money are involved.
🧠 Prediction Using AI Models:
Our internal LSTM-based model projects an initial price target of $30 post-breakout. If EGLD manages to flip the $30 resistance into support, the next leg could take us to $70, especially under strong liquidity inflow and market-wide bullish sentiment.
📊 Key Technical Indicators:
MACD: Bullish crossover forming — momentum shift confirmed.
RSI: Turning upwards from neutral zone (~50), suggesting early momentum.
Volume: Gradually increasing on upswings — signaling smart money activity.
💡 Trade Setup:
Entry: Current zone ($13.90–$14.20) upon breakout confirmation
Stop Loss: Below right shoulder ~$11.80
Target 1: $30
Target 2: $70 (with volume expansion and market confirmation)
📉 Risk/Reward: Highly favorable (~1:5 or more if held to $70).
🧠 Strategic Notes:
Strong weekly and monthly resistance near $30 — watch for reaction.
If we observe a volume spike + RSI breakout above 60, it confirms bullish continuation.
This idea aligns with historical behavior of EGLD following major reversal patterns.
📬 Exit Strategy (if expecting parabolic move):
Sell 25% at $30.
Sell another 25% at $50.
Keep 25% for $70.
Last 25% trailing stop-loss or exit at overbought RSI divergence.

EGOLD Consolidates at Critical Swing Low Around $11.47EGOLD is consolidating at support, with traders closely monitoring the $11.47 level. A sweep here could fuel bullish expansion toward $20, while a breakdown risks further correction.
Introduction: EGOLD’s prolonged consolidation has placed the spotlight on its key swing low at $11.47. How price reacts around this level will determine whether a bullish reversal unfolds or a deeper correction takes hold.
Key Technical Points:
- $11.47 is the critical swing low level.
- A liquidity sweep opens potential for bullish expansion.
- Breakdown below $11.47 could trigger a deeper correction.
Price action has been consolidating, with multiple retests reinforcing $11.47 as a major decision point. A wick through this swing low could act as a liquidity grab, fueling a bullish impulse toward $20.
On the other hand, a decisive close below this level would confirm bearish continuation. Market participants should be cautious, as consolidation near such a critical swing low often precedes high-volatility moves.
What to Expect in the Coming Price Action:
If EGOLD can hold above $11.47, a bullish push toward $20 is possible. However, failure here could deepen the correction significantly.

egldusdtThe EGLD currency is in a triangle pattern. I think the targets are clear with an upward breakout.

EGLD has formed a bullish double bottom📊 CRYPTOCAP:EGLD Market Update
CRYPTOCAP:EGLD has formed a bullish double bottom 📈
👉 If it breaks out the red resistance zone 🔴, the first target will be the green line level 🎯

EGLD/USDT — Descending Triangle at a Critical Demand Zone🔎 Overview
The EGLD/USDT (1D, Binance) chart is currently forming a classic descending triangle pattern:
Lower Highs are pressing price downward along the yellow trendline.
A strong horizontal demand zone at 11.40 – 13.50 USDT has been repeatedly tested as support.
Price is compressing toward the apex of the triangle → as the range tightens, the likelihood of a strong breakout or breakdown increases significantly.
---
🧩 Technical Pattern Details
Descending Triangle → historically leans bearish, but can flip bullish if the breakout occurs with strong volume.
Volume has been contracting, a typical sign of market indecision before a large move.
Support Zone 11.40 – 13.50 → key demand area; losing this level may trigger a strong sell-off.
Dynamic Resistance: the descending yellow trendline remains the critical barrier for bulls.
---
📊 Bullish Scenario
Confirmation: Daily close above the descending trendline with strong volume.
Upside Targets:
First hurdle: 16.29 USDT
Next: 18.20 → 20.85 USDT
Mid-term if momentum expands: 33.48 – 38.67 USDT
Reasoning: A breakout above a descending triangle often sparks a short-covering rally, leading to fast gains.
---
📉 Bearish Scenario
Confirmation: Daily close below 11.40 USDT.
Downside Targets:
Immediate: 11.00 – 10.50 USDT
Extension: 9.60 USDT (next major low on chart).
Reasoning: Breaking a multi-tested demand zone confirms sellers’ dominance, likely triggering a continuation of the downtrend.
---
🎯 Strategy & Risk Management
Conservative Approach: Wait for confirmation (breakout/breakdown) + retest → safer entries.
Aggressive Approach: Long near the demand zone with tight stop-loss below 11.40 (higher risk due to bearish bias of the pattern).
Stop Loss: Below demand zone for longs, above broken support (retest) for shorts.
Risk/Reward: Minimum 1:2 R:R ratio to keep trades profitable over time.
---
🚀 Conclusion
EGLD/USDT is at a make-or-break level.
A breakout above the trendline could fuel a rally toward 18–20 USDT.
A breakdown below 11.40 USDT opens the door to 9.60 USDT or lower.
The market is compressing, and the next decisive daily close with volume will likely set the direction. This is a high-watch setup.
#EGLD #EGLDUSDT #Elrond #CryptoAnalysis #TechnicalAnalysis #ChartPattern #DescendingTriangle #SupportResistanc #CryptoTrading #BullishScenario #BearishScenario

eGold Consolidates at Key Support, Eyes Rally Toward $20eGold (EGLD) continues to respect a critical support zone aligned with the 0.618 Fibonacci retracement and the value area low. Holding above $14.22 could trigger a bullish rotation toward $20.
Introduction:
EGLD’s recent price action has highlighted the importance of its current support region, which holds multiple technical confluences. With the 0.618 Fibonacci retracement and the value area low reinforcing this level, buyers have so far maintained control. As long as price remains above $14.22, the bullish structure of higher highs and higher lows remains valid, setting the stage for potential continuation.
Key Technical Points:
- Critical Support at $14.22: Confluence with 0.618 Fibonacci retracement and value area low provides structural strength.
- Bullish Market Structure Intact: Higher-low projections remain valid on the daily timeframe.
- Next Target at $20: An untested high time frame level that could attract price if momentum builds.
Main Analysis:
The $14.22 level is a crucial pivot for EGLD, sitting directly in line with the 0.618 Fibonacci retracement and the value area low of the current trading range. These overlapping signals provide strong technical support and create favorable conditions for buyers to maintain control. This region has repeatedly acted as a foundation for consolidations, confirming its importance as a structural anchor.
Price action continues to form higher lows and higher highs, which is a defining characteristic of bullish momentum. As long as this projection holds, the broader market structure remains positive. A decisive defense of the $14.22 region will only reinforce this trend, allowing buyers to prepare for another impulsive move higher.
The $20 level stands out as the next significant target. This area has not yet been tested following recent price action and therefore is likely to act as a magnet for continuation. From a volume perspective, demand confirmation will be essential. The volume profile needs to show sustained bullish inflows to support acceleration toward $20, as price action alone is not enough to validate a breakout. Consolidation without volume could delay the rally, while a surge in participation would confirm that buyers are firmly committed.
What to Expect in the Coming Price Action:
If EGLD consolidates above $14.22 with sustained bullish volume, the probability of a rally toward $20 increases substantially. A break of this resistance would further validate the bullish structure. Conversely, losing $14.22 on a closing basis would undermine the higher-low projection and increase the risk of a deeper corrective move.
Conclusion:
eGold is holding firm at a major support zone, with the 0.618 Fibonacci retracement and value area low providing strong technical confluence. If buyers defend $14.22 and demand builds through volume, EGLD could rotate toward $20, reinforcing its bullish market structure. Failure to sustain this region, however, would challenge the bullish outlook and expose the asset to a deeper retracement.

EGLDUSDT - Great for long positionsIt’s forming a Cup and Handle pattern on the 4H timeframe.
The neckline corresponds to the 0.618 Fibonacci level.
Once it breaks and closes above it, your target will be 20% from here. It’s a good buying opportunity now, but don’t use high leverage.
Best regards:
Ceciliones🎯

EGLDMultiversX
Egld usdt Daily analysis
Risk rewards ratio >2.2 👈👌
Pattern = two bottoms
First target =21.3$

EGLD Breaks Key Downtrend – Is This the Beginning?📊 Detailed Technical Analysis (Daily Timeframe):
🔍 1. Market Structure & Chart Pattern
Major Downtrend Line Breakout – Reversal Signal:
After being stuck under a persistent downtrend for nearly 9 months, EGLD has officially broken out of the descending trendline, signaling a potential shift from distribution to expansion phase. This breakout is significant and could mark the beginning of a new bullish trend.
Double Bottom + Accumulation Range:
Price action shows a clear double bottom formation within the $13.00–$16.50 range, which acted as a strong accumulation zone. This horizontal structure suggests buyers have been silently accumulating before triggering this breakout.
Resistance Turned Support (RBS):
The breakout is now being retested around the $17 level. If EGLD holds this area, it would confirm a support flip, which is a classic bullish signal. Holding above this zone would give bulls full control over the next moves.
🟢 2. Bullish Scenario (Base Case):
If the breakout sustains with increasing momentum:
✅ Short-Term Targets:
$20.08 and $21.88 – minor historical resistance levels.
✅ Mid-Term Targets:
$27.93 and $33.66 – key levels aligning with measured move targets and Fibonacci retracements.
✅ Long-Term Targets:
$39.41, $48.41, up to $55.61–$58.25 – previous key highs and psychological zones.
💡 If EGLD successfully retests and holds above $17.00, it presents a strong opportunity for trend-following entries with favorable risk-reward.
🔴 3. Bearish Scenario (Alternative Case):
If this breakout fails (false breakout scenario):
⚠️ Price could fall back into the previous accumulation range between $13.00–$15.50.
A breakdown below that range could drag EGLD further down toward $11.40, or even $10.00 – a crucial long-term support zone.
Lack of volume or weak bullish confirmation would be early signs of a failed breakout.
🧠 4. Sentiment & Broader Context:
🌐 This breakout comes at a time when altcoin capital rotation is starting to emerge as BTC dominance cools off.
🚀 EGLD, as a smart contract platform, historically performs well during altseason waves and ecosystem narratives.
✅ Final Thoughts:
> EGLD has printed a significant breakout from long-term bearish control. With accumulation completed and momentum building, this may be the beginning of a bullish cycle. However, staying above the $17 level is the key validation to confirm this trend reversal.
#EGLD #EGLDUSDT #CryptoBreakout #AltcoinSeason #TrendReversal #CryptoAnalysis #TechnicalAnalysis #BullishSetup #DoubleBottom
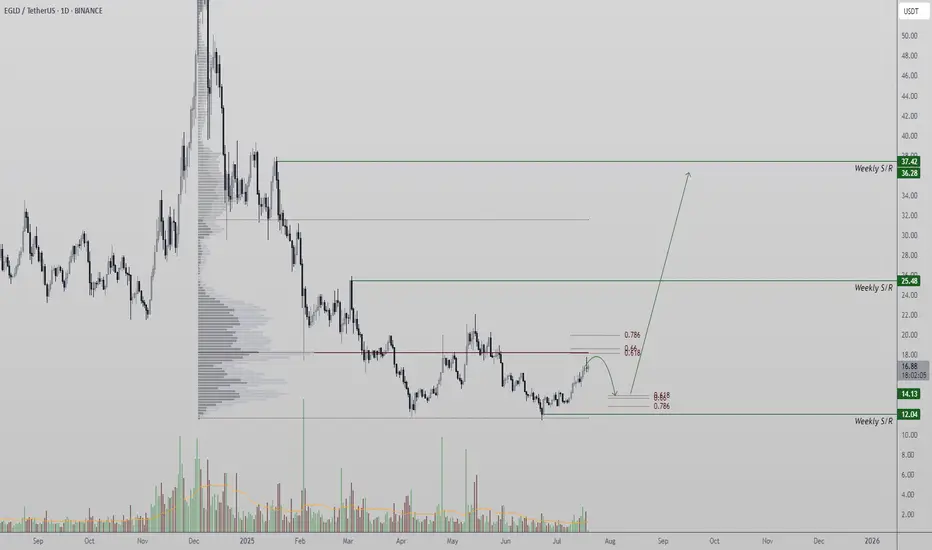
EGLD Eyes Bullish Continuation as Price Tests Point of ControlEGLD is approaching a key resistance level that may determine the next directional move. A reclaim above the point of control could set the stage for an uptrend continuation toward $37 and beyond.
EGLD is currently trading at a critical resistance region — the point of control (POC) — which serves as the highest volume node within the current trading range. This level often acts as a magnet for price, but also presents resistance that can either trigger continuation or cause a short-term pullback. From a technical standpoint, EGLD remains in a local uptrend, but a higher low formation is needed to confirm the next leg upward.
Key Technical Points:
- Point of control acting as resistance – A key level that must be reclaimed to confirm bullish continuation
- 0.618 Fibonacci retracement in play – Potential area for a higher low if price pulls back
- Upside target near $37 – If structure holds, price could push beyond recent highs
If EGLD fails to break through the point of control cleanly on the first attempt, a short-term pullback toward the 0.618 Fibonacci retracement becomes likely. This level provides strong technical support and a chance for buyers to step in and form a higher low — a key feature of a healthy, bullish structure.
The presence of the 0.618 retracement just beneath current price action provides a strong technical safety net. Holding this level would not only preserve the uptrend but also set the stage for a push toward the $37 region, which marks the next major resistance and previous swing high.
This scenario is contingent on the market maintaining bullish intent and avoiding a breakdown below the higher low structure. If price dips below the 0.618 level and fails to recover quickly, it would suggest weakness and potentially reset the structure to neutral or even bearish.
That said, current price behavior indicates that bulls are in control — but a volume-backed breakout above the point of control will be the key trigger. If this occurs, it could catalyze a fast move toward new local highs.
If EGLD reclaims the point of control with strong volume, expect bullish continuation toward the $37 target. However, a short-term pullback remains likely, with the 0.618 Fibonacci zone offering a potential higher low setup. Watch for volume spikes and structure confirmation to validate the next move.
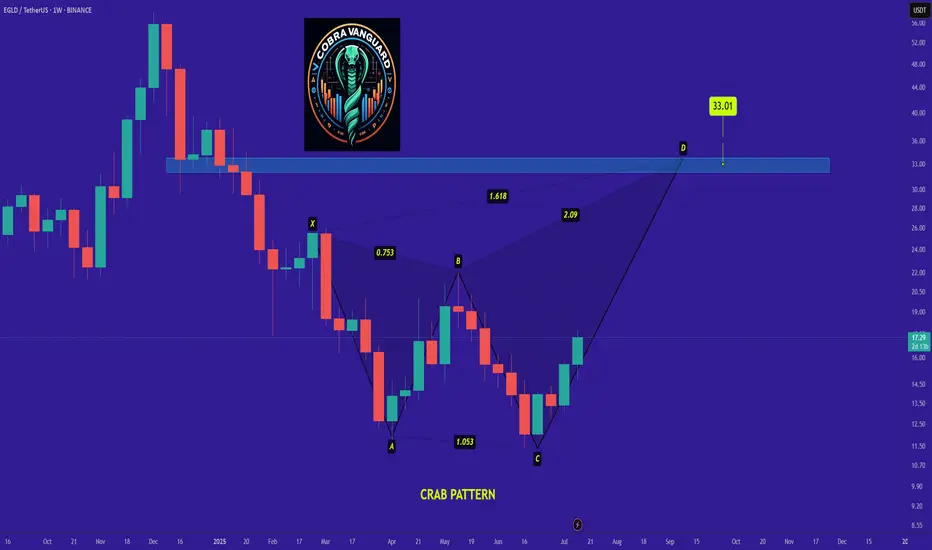
EGLD is bullish now & many Traders don't see it !!!Be careful with EGLD !!!
we can hope that the price will act like a Crab pattern and the price will grow well.
I expect that the price will grow very quickly...
Stay Awesome , CobraVanguard.
Most Will Get Trapped on EGLD’s Next Move Don’t Be One of ThemYello Paradisers, did you catch the EGLD breakout or are you still waiting for confirmation that’s already gone? While most traders are sleeping on this setup, it has just completed one of the cleanest breakout-and-retest patterns we’ve seen in weeks, and what comes next could leave many trapped on the wrong side.
💎#EGLDUSDT recently broke through its descending resistance with strength and has now retested that same level, which is acting as solid support in the $14.30–$15.00 range. This successful flip of resistance into support is a textbook bullish signal, and it’s holding beautifully indicating strong buyer presence and increasing the probability of continued upside.
💎If this support holds firm, #EGLD is eyeing a move toward the $18.00–$18.25 region, where moderate resistance is expected. A break above this could open the path toward the $19.90–$20.40 zone, a significant resistance level that may shape the next macro structure on this chart.
But it’s not all upside. If EGLD fails to hold the $13.00 level and especially the key invalidation point at $11.85 this entire bullish setup breaks down, and sellers will likely take control. The bullish momentum would collapse fast, and the door would open to much deeper downside levels.
MyCryptoParadise
iFeel the success🌴

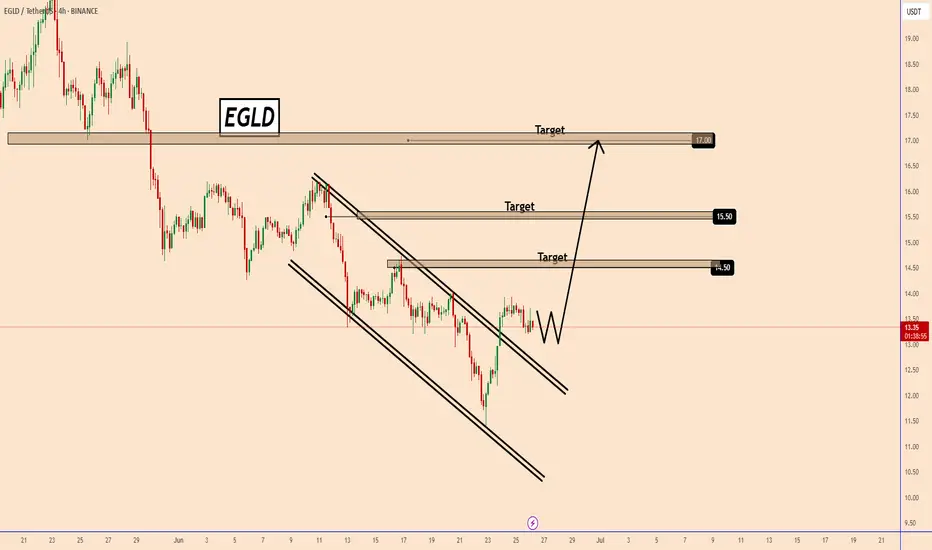
EGLD: Potential Rally as Altcoins Reclaim MomentumEGLD: Potential Rally as Altcoins Reclaim Momentum
EGLD has broken out of a clear ascending channel pattern. The move was initiated by optimism for BTC price recovery to 108k.
BTC was the first to move, and today's indicators are showing a pause in BTC.
Meanwhile, Alcoins started the move and dominated the market today. Many altcoins are very undervalued, and EGLD is one of them.
RGLD is likely to take a small pause and could rise these days to 14.50; 15.50 and 17.00 on its first move if that happens.
Later, we should re-evaluate the analysis. There is a great potential if the growth wave starts from this area.
You may watch the analysis for further details!
Thank you and Good Luck!
❤️PS: Please support with a like or comment if you find this analysis useful for your trading day❤️
Continuing pain - Continuing gainAnother gem on discount 👌
Accumulation at this prices could pay bold returns IMO.
