ENA / USDT – Short Bias (HTF + Confluence)ENA is currently trading below the weekly support level, which keeps the higher-timeframe bias bearish.
As long as price remains below this weekly level, longs are high risk.
On the 1H timeframe, price has retraced into a clear sell-side zone, aligning with:
Prior resistance
A clean bearish order

ENA USDT LONG SIGNAL---
📢 Official Trade Signal – ENA/USDT
📈 Position Type: LONG
💰 Entry Price: 0.2400
0.2360
---
🎯 Take-Profit Targets (Partial Exits)
• TP1: 0.2450
• TP2: 0.2499
• TP3: 0.2553
• TP4: 0.2612
• TP5: —
• TP6: —
---
🛑 Stop-Loss: 0.2300
📊 Timeframe: 15m
⚖️ Risk/Reward Ratio: —
💥 Suggested Leverage:

ENA Compressing Inside Symmetrical Triangle Near Decision ZoneENA is trading inside a well-defined symmetrical triangle after a sustained downtrend. Price is forming lower highs against a descending resistance while buyers continue to defend higher lows, signaling compression and balance between demand and supply.
This structure places ENA at a critical decis

Ena spot planmade huge gains from this coins trading it from wave C to D
now the wave D has topped looking for wave E to hit my minimum target and then fly to moon
Entry Tp and Sl are mentioned in Chart

ENA USDT LONG SIGNAL---
📢 Official Trade Signal – ENA/USDT
📈 Position Type: LONG
💰 Entry Price: 0.2559
---
🎯 Take-Profit Targets (Partial Exits):
• TP1: 0.2605
• TP2: 0.2686
• TP3: 0.2744
• TP4: 0.2798
---
🛑 Stop-Loss: 0.2482
📊 Timeframe: 15m
⚖️ Risk/Reward Ratio: ≈ 3.17 (based on TP4)
💥 Suggested Leverage: 5× –

$ENA/USDT ANALYSISOn the 3-day chart, ENA/USDT is trading inside a long-term demand zone where price has reacted multiple times in the past, showing that buyers have stepped in here before. The market has been in a downtrend for several months and is still moving under a descending trendline, showing weak momentum ov

Ethena ENA price analysisIs CRYPTOCAP:ENA setting up for a trend reversal?
The OKX:ENAUSDT daily chart is repeating familiar patterns typically seen at the early stages of an uptrend. While this doesn’t guarantee continuation, the structure is worth monitoring.
Key Levels
• Downside risk: –25% to retest the previous l

ENA – (1W)Analysis, Devation again? ENA is back at that familiar long-term support zone — the same area where the market has pulled off several surprise deviation moves in the past.
But this time, something stands out that you don’t see often.
Right as price dipped below support again, it snapped back and broke the descending trendli

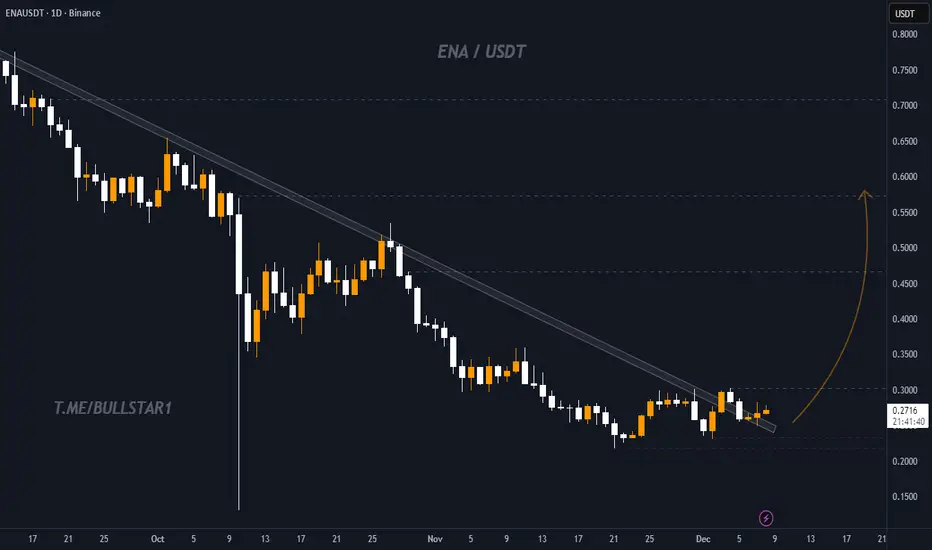
ENA setting up for a strong upward moveENA is showing the first signs of breaking the downtrend. The price is holding well above the current zone and a clean breakout of the trendline could open the way for a strong move toward the 0.55 area, where liquidity and heavy resistance are positioned. We are monitoring closely for a more sustai
ENA Update🚨📊 ENA Update
ENA is testing the red resistance zone 🔴.
If breakout occurs, first target = green line level 🟩🎯.

See all ideas
Summarizing what the indicators are suggesting.
Oscillators
Neutral
SellBuy
Strong sellStrong buy
Strong sellSellNeutralBuyStrong buy
Oscillators
Neutral
SellBuy
Strong sellStrong buy
Strong sellSellNeutralBuyStrong buy
Summary
Neutral
SellBuy
Strong sellStrong buy
Strong sellSellNeutralBuyStrong buy
Summary
Neutral
SellBuy
Strong sellStrong buy
Strong sellSellNeutralBuyStrong buy
Summary
Neutral
SellBuy
Strong sellStrong buy
Strong sellSellNeutralBuyStrong buy
Moving Averages
Neutral
SellBuy
Strong sellStrong buy
Strong sellSellNeutralBuyStrong buy
Moving Averages
Neutral
SellBuy
Strong sellStrong buy
Strong sellSellNeutralBuyStrong buy
Displays a symbol's price movements over previous years to identify recurring trends.