ENA/USDT at a Critical Demand Zone – Bounce or Breakdown Ahead?ENA/USDT is currently in a strong bearish phase on the 3D timeframe. After failing to hold the distribution area above 0.80, price experienced a sharp and sustained decline, returning to a highly significant historical demand zone. The yellow zone at 0.212 – 0.190 is a critical area that will determ
Related pairs

Here’s Where Ethena (ENA) Price Could Go Next* Ethena has just emerged out of a bear flag, but whether it has legs to stand on or if further downside can be expected is now in question.
* The recent bounce has been a weak one, which shows a measure of restraint on the part of traders who are holding out for further signs.
* On-chain data p
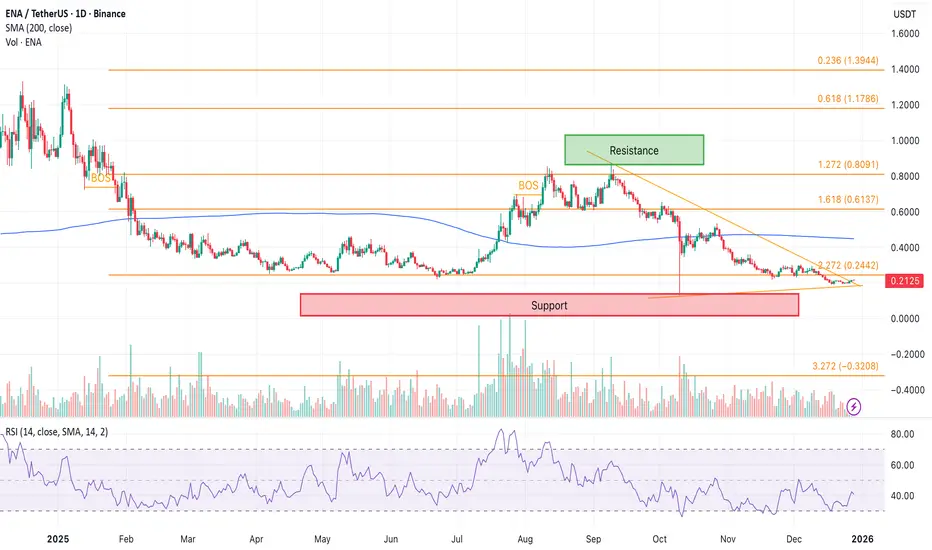
ENA / USDT – Short Bias (HTF + Confluence)ENA is currently trading below the weekly support level, which keeps the higher-timeframe bias bearish.
As long as price remains below this weekly level, longs are high risk.
On the 1H timeframe, price has retraced into a clear sell-side zone, aligning with:
Prior resistance
A clean bearish order

ENA USDT LONG SIGNAL---
📢 Official Trade Signal – ENA/USDT
📈 Position Type: LONG
💰 Entry Price: 0.2400
0.2360
---
🎯 Take-Profit Targets (Partial Exits)
• TP1: 0.2450
• TP2: 0.2499
• TP3: 0.2553
• TP4: 0.2612
• TP5: —
• TP6: —
---
🛑 Stop-Loss: 0.2300
📊 Timeframe: 15m
⚖️ Risk/Reward Ratio: —
💥 Suggested Leverage:

ENA Compressing Inside Symmetrical Triangle Near Decision ZoneENA is trading inside a well-defined symmetrical triangle after a sustained downtrend. Price is forming lower highs against a descending resistance while buyers continue to defend higher lows, signaling compression and balance between demand and supply.
This structure places ENA at a critical decis

Ena spot planmade huge gains from this coins trading it from wave C to D
now the wave D has topped looking for wave E to hit my minimum target and then fly to moon
Entry Tp and Sl are mentioned in Chart

ENA USDT LONG SIGNAL---
📢 Official Trade Signal – ENA/USDT
📈 Position Type: LONG
💰 Entry Price: 0.2559
---
🎯 Take-Profit Targets (Partial Exits):
• TP1: 0.2605
• TP2: 0.2686
• TP3: 0.2744
• TP4: 0.2798
---
🛑 Stop-Loss: 0.2482
📊 Timeframe: 15m
⚖️ Risk/Reward Ratio: ≈ 3.17 (based on TP4)
💥 Suggested Leverage: 5× –

$ENA/USDT ANALYSISOn the 3-day chart, ENA/USDT is trading inside a long-term demand zone where price has reacted multiple times in the past, showing that buyers have stepped in here before. The market has been in a downtrend for several months and is still moving under a descending trendline, showing weak momentum ov

Ethena ENA price analysisIs CRYPTOCAP:ENA setting up for a trend reversal?
The OKX:ENAUSDT daily chart is repeating familiar patterns typically seen at the early stages of an uptrend. While this doesn’t guarantee continuation, the structure is worth monitoring.
Key Levels
• Downside risk: –25% to retest the previous l

ENA – (1W)Analysis, Devation again? ENA is back at that familiar long-term support zone — the same area where the market has pulled off several surprise deviation moves in the past.
But this time, something stands out that you don’t see often.
Right as price dipped below support again, it snapped back and broke the descending trendli

See all ideas
Summarizing what the indicators are suggesting.
Oscillators
Neutral
SellBuy
Strong sellStrong buy
Strong sellSellNeutralBuyStrong buy
Oscillators
Neutral
SellBuy
Strong sellStrong buy
Strong sellSellNeutralBuyStrong buy
Summary
Neutral
SellBuy
Strong sellStrong buy
Strong sellSellNeutralBuyStrong buy
Summary
Neutral
SellBuy
Strong sellStrong buy
Strong sellSellNeutralBuyStrong buy
Summary
Neutral
SellBuy
Strong sellStrong buy
Strong sellSellNeutralBuyStrong buy
Moving Averages
Neutral
SellBuy
Strong sellStrong buy
Strong sellSellNeutralBuyStrong buy
Moving Averages
Neutral
SellBuy
Strong sellStrong buy
Strong sellSellNeutralBuyStrong buy
Displays a symbol's price movements over previous years to identify recurring trends.
Frequently Asked Questions
ENA / USDT Spot Trading Pair (ENA) reached its highest price on Apr 11, 2024 — it amounted to 1.5270 USDT. Find more insights on the ENA price chart.
See the list of crypto gainers and choose what best fits your strategy.
See the list of crypto gainers and choose what best fits your strategy.
ENA / USDT Spot Trading Pair (ENA) reached the lowest price of 0.1348 USDT on Oct 10, 2025. View more ENA / USDT Spot Trading Pair dynamics on the price chart.
See the list of crypto losers to find unexpected opportunities.
See the list of crypto losers to find unexpected opportunities.
The safest choice when buying ENA is to go to a well-known crypto exchange. Some of the popular names are Binance, Coinbase, Kraken. But you'll have to find a reliable broker and create an account first. You can trade ENA right from TradingView charts — just choose a broker and connect to your account.
Crypto markets are famous for their volatility, so one should study all the available stats before adding crypto assets to their portfolio. Very often it's technical analysis that comes in handy. We prepared technical ratings for ENA / USDT Spot Trading Pair (ENA): today its technical analysis shows the sell signal, and according to the 1 week rating ENA shows the sell signal. And you'd better dig deeper and study 1 month rating too — it's sell. Find inspiration in ENA / USDT Spot Trading Pair trading ideas and keep track of what's moving crypto markets with our crypto news feed.
ENA / USDT Spot Trading Pair (ENA) is just as reliable as any other crypto asset — this corner of the world market is highly volatile. Today, for instance, ENA / USDT Spot Trading Pair is estimated as 6.66% volatile. The only thing it means is that you must prepare and examine all available information before making a decision. And if you're not sure about ENA / USDT Spot Trading Pair, you can find more inspiration in our curated watchlists.
You can discuss ENA / USDT Spot Trading Pair (ENA) with other users in our public chats, Minds or in the comments to Ideas.