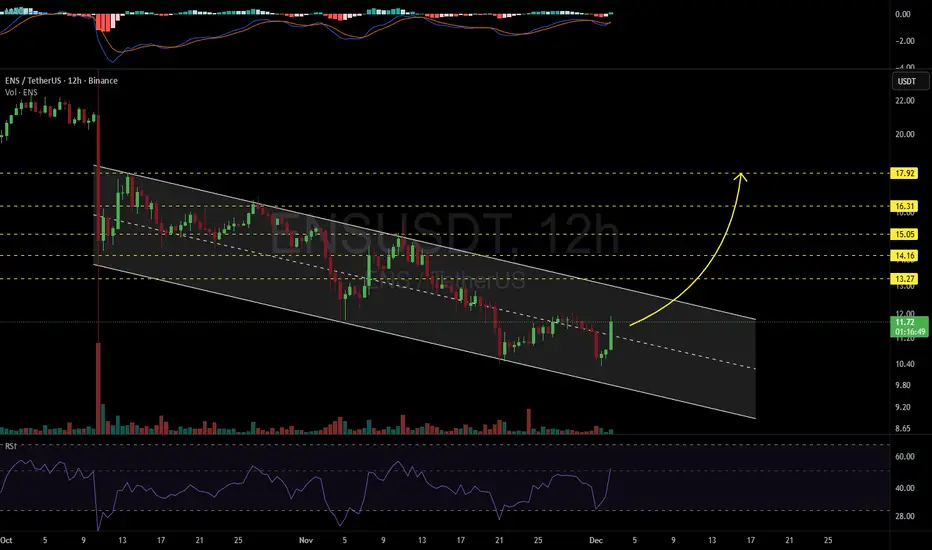
ENSUSDT 12H#ENS is moving inside a descending channel on the 12H timeframe. In case of a breakout above the channel, the potential targets are:
🎯 $13.27
🎯 $14.16
🎯 $15.05
🎯 $16.31
🎯 $17.92
⚠️ Always remember to protect your capital with a proper stop-loss and disciplined risk management.
Market insights
ENSUSDT — Massive Bounce or Final Breakdown?After months of wide consolidation, Ethereum Name Service (ENS) is once again testing one of its most critical structures — the golden confluence zone between 16.5–14.0 USDT, which has served as a major battleground between buyers and sellers since 2022.
This isn’t just a price range:
It’s where ENS repeatedly formed higher lows and launched new rallies.
It’s also aligned perfectly with the multi-month ascending trendline, creating a high-value technical confluence.
The market is holding its breath — waiting for a decisive move.
---
Technical Structure & Pattern
Ascending Trendline: still intact since 2023, providing medium-term bullish structure.
Horizontal Support 16.5–14.0: long-term demand zone with multiple reactions in the past; a true make-or-break level.
Compression Phase: price is coiling tighter against support — signaling a potential volatility expansion soon.
---
📈 Bullish Scenario
If ENS manages to close above 16.5 on the weekly timeframe with a strong bullish candle (such as a pinbar or bullish engulfing), a rebound could unfold toward:
Initial targets: 19.8 → 23.6 USDT
Extended targets: 30.4 → 37.0 USDT
This golden zone could act as a launchpad for the next major bullish leg. Long-term buyers may see this as a high-reward accumulation opportunity with limited downside risk.
---
📉 Bearish Scenario
However, a weekly close below 14.0 would confirm a structural breakdown, potentially triggering a deeper move toward:
Next supports: 12.0 → 9.5 USDT
Extreme target: 7.5 – 6.56 USDT, the historical low on the chart.
Such a breakdown would invalidate the medium-term higher-low structure and confirm full bearish control.
---
Conclusion
ENS stands at a technical cliff — this 16.5–14.0 zone will decide whether it marks the foundation for a new bullish cycle or the start of a major downtrend.
Traders who stay patient and wait for clear weekly confirmation will find the best opportunities here — with defined risk and strong potential reward.
---
#ENSUSDT #EthereumNameService #CryptoAnalysis #TradingView #SupportResistance #Trendline #Breakout #BullishScenario #BearishScenario #TechnicalAnalysis #CryptoWeekly #ENSAnalysis #CryptoChart

ENSUSDT – Final Pressure at Critical Zone: Buyer or Seller Wins?Overview
ENS price is currently at a decisive point — compressed within a descending triangle formation, narrowing right above the major demand zone between 17.5–19.5 USDT.
After a prolonged correction from its local highs, the market is now facing an intense battle between fading selling pressure and persistent buying defense around this key support.
The upcoming move will likely define the next major trend for ENS in the following weeks.
---
Structure and Pattern
Main Pattern: Descending Triangle — signaling consistent selling pressure but also potential for a strong reversal if a breakout occurs.
Critical Zone: The 17.5–19.5 USDT area acts as a long-standing demand zone that has repeatedly held price throughout 2025.
Short-Term Dynamics: The series of lower highs forming the descending trendline indicates a phase of accumulation or waiting for a key catalyst.
---
Bullish Scenario – Reversal from Demand Zone
If ENS manages to break above the descending trendline and close a daily candle above 24.15 USDT, it would confirm a valid bullish breakout from the pattern.
Confirmation: A daily candle with strong volume closing above the trendline.
Upside Targets: 24.15 → 27.7 → 30.67 → 37.6 → up to 47.9 USDT if momentum continues.
Strategy: Wait for a retest around the breakout area for confirmation. Maintain a stop-loss below 17.5 to manage risk.
Such a breakout could mark the beginning of a major reversal, especially if supported by rising volume and positive sentiment within the Ethereum Name Service (ENS) and Web3 ecosystem.
---
Bearish Scenario – Breakdown from Historical Support
Conversely, if selling pressure pushes the price below the 17.5 USDT zone, the mid-term structure may shift into a bearish continuation.
Confirmation: A daily close below 17.5 with strong volume.
Downside Targets: 15.0 → 12.0 → potential retest of the historical low at 11.9.
Strategy: Consider short positions after a breakdown and retest of the former support-turned-resistance area.
A confirmed breakdown below this demand zone would reinforce the narrative that buyers are losing control, opening the door to a new downward trend phase.
---
Technical Conclusion
ENS is currently at a critical inflection point — the 17.5–19.5 zone represents the buyers’ last stand.
A breakout above the descending trendline could ignite a significant rally toward 30–37 USDT,
while a breakdown below the demand zone could extend the correction into the 12–15 USDT range.
Watch price reaction and volume within the yellow zone, as it will determine the winner of this crucial market battle.
---
#ENS #ENSUSDT #CryptoAnalysis #TechnicalAnalysis #PriceAction #DescendingTriangle #SupportResistance #BreakoutTrading #SwingTrade #Web3 #EthereumNameService #CryptoTrading

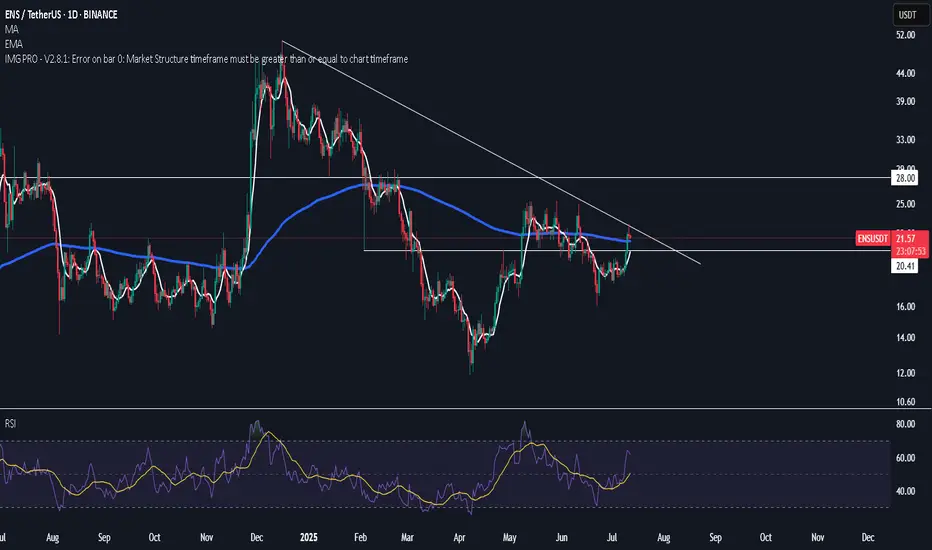
ENS/USDT 4HOUR CHART UPDATE !! ENS/USDT
ENS is trading around $21.50, currently testing the upper trendline of a well-defined falling channel.
Price has formed a bullish breakout structure, supported by higher lows on the 4H timeframe.
the
Volume shows early accumulation signs, suggesting buyers are stepping in near $20–$21.
Long Setup:
Entry zone: $20.5 – $21.5
Stop-loss: Below $19.8 (below the structure support)
Targets:
🎯 $25.0 → First target
🎯 $27.5 → Second target
🎯 $29.9+ → Extended swing target
DYOR | NFA

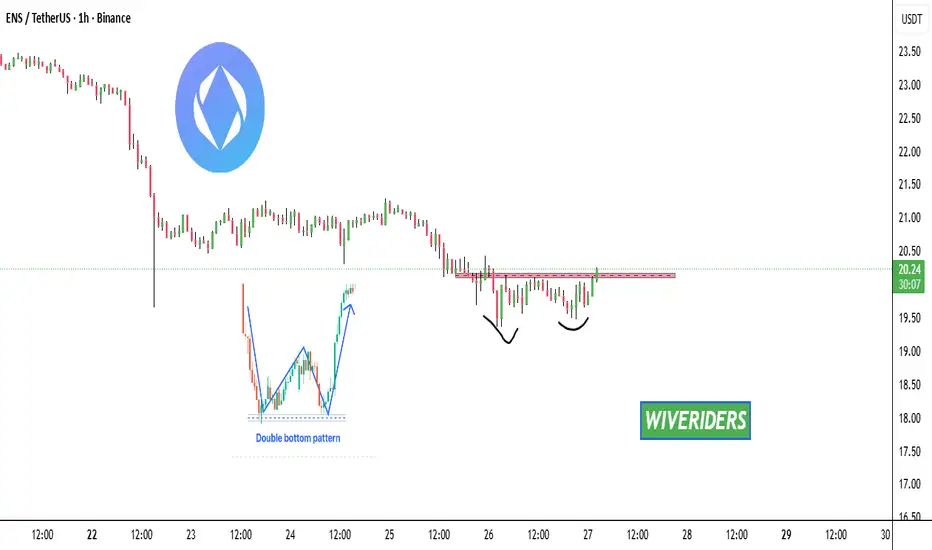
ENS has formed a Double Bottom pattern📊 ENS Market Update
ENS has formed a Double Bottom pattern ✅
It is now testing the red resistance zone 🔴 — if it breaks out with confirmation, it could signal the start of a bullish trend 📈
ENS Ready for 100% Up MoveNow the price is at the Weekly support and forming a wedge pattern and ready to break from this pattern , enter after the strong candle close in weekly .
and at the same time Bitcoin dominance is decreasing and altcoins dominance is started increasing , so look on all the altcoins
and follow proper risk management , it has very good chances to move UP side but first we have to protect the down side , where risk management comes into game .
Follow for more Ideas and potential coins/ Stocks .

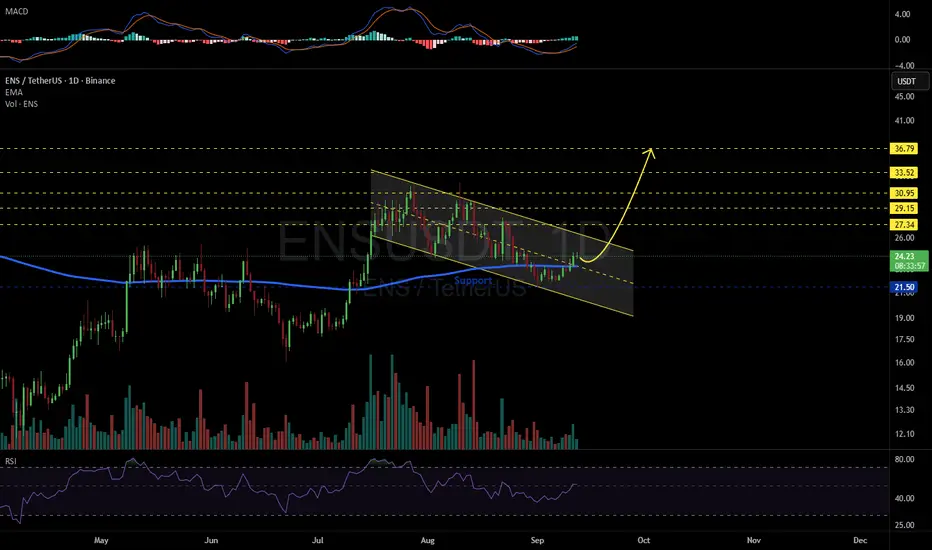
ENSUSDT 1D#ENS is moving within a bullish flag pattern on the daily chart and is currently trading above the midline of the flag and the daily EMA200. Consider buying at the current price and near the $21.50 support level. If it breaks out above the pattern resistance, the targets are:
🎯 $27.34
🎯 $29.15
🎯 $30.95
🎯 $33.52
🎯 $36.79
⚠️ Always remember to use a tight stop-loss and follow proper risk management.
ENS/USDT — Fibonacci Zone: Bullish Reversal or Bearish BreakdownChart Overview (1W Timeframe)
ENS/USDT is currently trading at the critical zone of 22.4 – 24.1 USDT, a decisive area because:
It represents a flip zone (previous resistance that may now act as strong support).
It aligns with a Fibonacci confluence at 0.5 (≈24.05) and 0.618 (≈22.39), making it a high-probability demand area.
This zone will decide whether ENS confirms a bullish continuation or faces a bearish breakdown in the coming weeks.
---
🔹 Market Structure & Pattern
After a strong rebound from the 2023 lows, ENS formed a swing high in 2025 but failed to break higher → early signs of consolidation.
The price is now retesting the golden support zone (22–24), acting as a pivotal decision level.
Instead of a classic pattern (e.g., H&S, triangle), the chart shows signs of range accumulation vs. distribution → making reaction at key levels the primary focus.
---
🔹 Bullish Scenario
Condition: Weekly close above 24.05 and ideally above 27.58.
📈 Upside targets:
1. 27.58 USDT → minor resistance, confirmation level.
2. 30.47 USDT → key psychological & structural resistance.
3. 37.39 – 40.87 USDT → major supply zone.
4. 47.59 USDT → extended target if strong momentum continues.
✅ Bullish confirmation = strong green weekly candle closing above the zone with rising volume.
---
🔹 Bearish Scenario
Condition: Weekly close below 22.39 (0.618 Fib).
📉 Downside targets:
1. 18.29 USDT → 0.5 retracement support.
2. 17.04 USDT → 0.618 retracement support.
3. 6.66 USDT (historical low) → only if a deep breakdown unfolds.
⚠️ A breakdown and failed retest below 22.39 would confirm a larger distribution phase.
---
🔹 Key Takeaways for Traders
The 22.4 – 24.1 USDT zone is the “make-or-break level.”
Holding this level → opens the door for a multi-month bullish trend.
Losing this level → signals risk of a mid-term bearish move.
Risk management is crucial on the weekly timeframe — stops should be clear (e.g., below 22 for long setups).
---
🎯 Conclusion
ENS is testing its golden Fibonacci zone — the defining level for its next major move.
Bullish case: Hold & breakout → potential targets 30–47 USDT.
Bearish case: Breakdown → risk of decline toward 18–17, possibly 6.6 in the long term.
📌 All eyes on the weekly close around 22–24 USDT — a key zone no swing trader or investor should ignore.
---
#ENS #ENSUSDT #EthereumNameService #CryptoAnalysis #TechnicalAnalysis #SwingTrading #SupportResistance #Fibonacci #PriceAction

Swing Trade Idea ENS/USDT – Long Setup (8H timeframe)Entry Range: $23.30-23.50
Take Profit 1: $23.99
Take Profit 2: $24.59
Take Profit 3: $25.18
Stop Loss: $22.51
Leverage: 10-15x
Please trade with care and use proper position sizing and risk management always ✅

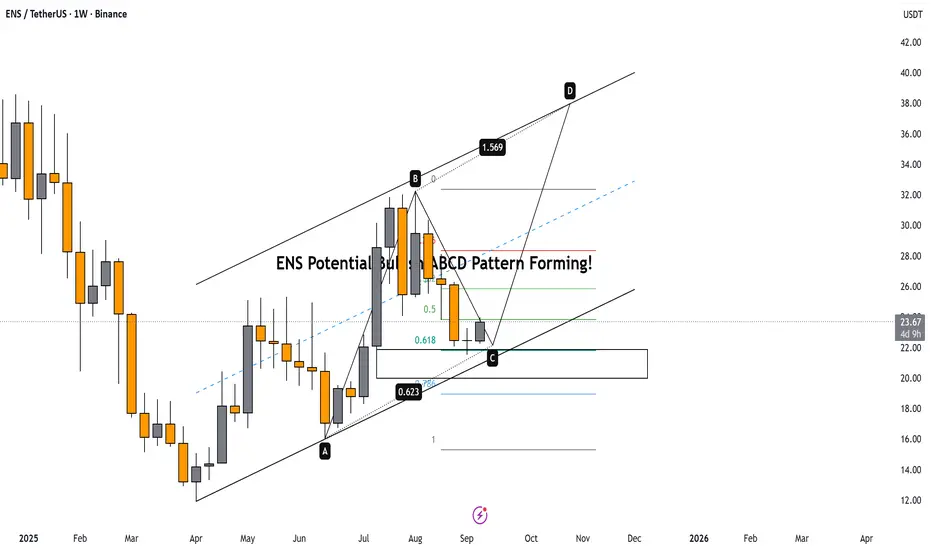
ENS Potential Bullish ABCD Pattern Forming!
Price just tapped the 0.618 golden zone + support trendline 📉💥
We’re at point C, prepping for a potential move toward point D 👀
Pattern: ABCD Harmonic inside a bullish channel 🧠
• Fib levels aligning perfectly ✅
• Weekly structure still intact ✅
🎯 Watching next leg toward D @ 1.569 Fib extension
Stay sharp — this could be the beginning of a strong trend reversal! 📈
Ethereum Name Service (ENSUSDT) — Liquidity Hunt Targets $24-$29Sergio Richi Premium ✅
NYSE:ENS #Crypto #EthereumNameService — Liquidity Hunt Targets $24-$29 | September 07, 2025.
Price (Sept 7, 2025) : $22.210
Asset Overview:
Ethereum Name Service (ENS) is a decentralized naming protocol on the Ethereum blockchain, enabling users to replace complex wallet addresses with readable names like "yourname.eth."
It powers Web3 identity, domain registration, and integrations across dApps, with recent features like L2 Primary Names enhancing cross-chain usability.
Key News (Aug 31 - Sep 6, 2025):
• Ecosystem Boost: ENS launched L2 Primary Names on Sep 2, allowing seamless identity across layers—boosting adoption in DeFi and Web3. Integrations like .locker domains now function as ENS names, expanding utility.
• Token unlock scheduled for Sep 8 could add short-term volatility.
Chart (1D):
💡 Entry & Exit:
Entry: $22.210 (spot long)
🎯 Take Profit 1: $24.400 (+9.86%)
🎯 Take Profit 2: $29.000 (+30.57%)
• Long Max Pain: $21.2035
• Short Max Pain 1: $24.992
• Short Max Pain 2: $30.203
My View:
Looks like smaller traders are heavily shorting ENS, while big whales have jumped into long positions at this point.
So, there’s a good chance we’ll see a move to liquidate those short traders’ positions.

ENS - LONG SET-UP BINANCE:ENSUSDT
ENS Long Set-up 📈
Ens Looking good to long between 19.14 - 19.94 🔼
SL Below 18 or as per your risk capacity 🔽

ENS/USDT (Perpetual Futures, Bitget).1. Chart Context
Pair: ENS/USDT (Perpetual Futures, Bitget).
Timeframe: 4H.
Current Price: Around $24.39.
Bias: Long setup with defined entry, stop loss, and target.
2. Key Levels Marked
Daily/Weekly/Monday Opens: Important intraday reference points (act as magnets for price).
Prev Week High/Low/Mid: Show where liquidity may rest (potential reversal zones).
Prev Day Mid: Useful intraday pivot.
Monthly Open: Higher timeframe bias confirmation.
3. Trade Setup
Entry Zone: Around $24.40 (just above Daily Open & Monday Mid).
Stop Loss: Around $23.18 (below Monday Low & Prev Week Low).
Take Profit: Around $26.52 (near Weekly Open & Monday High cluster).
This creates a Risk:Reward ratio of ~2.5–3:1.
4. Reasoning Behind Long
Liquidity Sweep: Price previously dipped below the Prev Week Low and Monday Low, grabbing liquidity before bouncing.
Reclaim of Daily Open: If price sustains above $24.5, it shows bullish momentum.
Targeting Untapped Liquidity: Next liquidity zones lie around Prev Week Mid, Weekly Open, and Monday High (~$26.5).
Higher Timeframe Confluence: Monthly open is above ($27), supporting long bias if momentum builds.
5. Trade Logic in Words
The trader expects ENS to hold above the Daily Open after a liquidity grab below last week’s low. With that support confirmed, price is likely to push toward the Weekly Open & Monday High cluster, giving a clean long opportunity. Stop is safely below recent lows, ensuring protection if price rejects.
✅ In short: This setup bets on ENS holding the $24 zone and pushing toward $26.5+, with a favorable R:R.

Ethereum Name Servise ENS price analysisFor the second day in a row, trading volumes on the CRYPTOCAP:ETH futures market have exceeded those of CRYPTOCAP:BTC
(Is the market alpha returning or are profits being locked in? Write your thoughts in the comments ?)
💡 And we will write an analysis of the possible movement of the NYSE:ENS price — this is the #Ethereum Name Service management token, which is used to manage the protocol and influence pricing decisions for its .eth addresses and price oracle.
👌 Currently, all forces are preventing the OKX:ENSUSDT price from consolidating above $23.6. But when that happens, it will be a very safe level to buy on a retest.
📊 More risky, but with greater earning potential, are purchases at $17.50 and $14.50.
Set your “buckets” for purchases and wait for them to “fill up.”
And then, who knows, maybe in 2025, the price of NYSE:ENS will reach its ATH.
_____________________
Did you like our analysis? Leave a comment, like, and follow to get more

ENS 8H TF - Expect Further Downtrend
▶️ The downtrend is currently held by green support just above 24.00, but there are no signs that the decline is over.
▶️ The move from blue resistance to green support showed strong momentum, suggesting it may be blue wave A of a downside ABC pattern.
▶️ This structure implies that a corrective blue wave B may follow, eventually leading to a blue wave C to the downside.
▶️ The yellow ascending trendline, originating at the April low, is being monitored as a potential target for blue wave C.
▶️ However, it’s too early to confirm this path... further price action is needed to validate the ABC scenario.

ens sell midterm"🌟 Welcome to Golden Candle! 🌟
We're a team of 📈 passionate traders 📉 who love sharing our 🔍 technical analysis insights 🔎 with the TradingView community. 🌎
Our goal is to provide 💡 valuable perspectives 💡 on market trends and patterns, but 🚫 please note that our analyses are not intended as buy or sell recommendations. 🚫
Instead, they reflect our own 💭 personal attitudes and thoughts. 💭
Follow along and 📚 learn 📚 from our analyses! 📊💡"

Ethereum Name Service (ENS): Looking For Smaller Dump, Then PumpENS coin has recently broken the branch of EMAs where sellers took full dominance near that zone and now we wait for a proper break of structure to form.
Once we get that BOS, we will be looking for smaller downward movement, after which we will be looking for upward movement. There are 2 ways that we can make money here so let's wait for confirmations now.
Swallow Academy

Ethereum Name Service Easy $131 Target · $208 Possible or HigherEthereum Name Service really took off in late 2023. March 2024 did nothing to this project. Here we can see an extended period of higher highs until December 2024. Many projects produced a major high in March 2024 to turn bearish until recently. In December, all of these produced a lower high. You can see how different this chart looks. This is a strong project the chart is saying.
There was a strong correction between December and April, this was a marketwide event. You can see how ENSUSDT moved below 0.786 Fib. retracement for several months just to recover. In June it remained below this level only briefly, for two weeks, and we are now full green.
Last week's candle closed above 0.618 Fib. retracement and we are back in the bullish zone. Full blown bullish as Ethereum Name Service is trading at the highest price since January 2025. Everything shows the market being ready for additional growth.
The recovery above support never supports a crash but instead a bullish continuation. For a crash, we would see a rejection or very weak action around resistance. Instead, we have full green candles with rising volume. Perfect conditions for higher prices. Just what we need and want to see.
The targets here are good, $131 and $208. I don't think this will be the end though and we have another wait and see. I think between $285 and $361 is a better prediction, these targets are also shown on the chart.
How far up do you think ENS will go?
Namaste.

ENSUSDT UPDATE
Pattern: Falling Wedge Breakout
Current Price: \$26.00
Target Price: \$48.00
Target % Gain: 140.90%
Technical Analysis: ENS has broken out of a long-term falling wedge on the 1D chart, showing strong bullish momentum. A clear breakout above resistance with a significant volume spike confirms the setup.
Time Frame: 1D

$ENSreclaim of 200 ema
likely sweep stops under it before weekly close
vwap is first hurlde after we break downtrend
above vwap this can go mental
there will be a blow off top for all alts the same way we felt the pain on the way down this should higher than expected

$ENSdips accross the board this bubba reclaim of 200 ema
looking for reclaim of previous range
should telelport to suppply above and make a HH
after which i shall be risking off to buy back on the lower high
general plan for alts over the next 3 odd months
ENS/USDT Weekly Outlook – “Massive Breakout Brewing from Base
Ethereum Name Service (ENS) is currently positioned at a critical inflection point on the weekly chart, signaling a high-probability setup for a massive bullish breakout after nearly 2 years of sideways consolidation and structural base building.
🔍 Technical Pattern Breakdown
This chart reveals a macro Ascending Triangle formation developing since late 2022, with higher lows consistently respecting a rising trendline support and price now retesting the golden pocket Fib zone.
Pattern Formed:
📐 Macro Ascending Triangle + Fibonacci Confluence Zone
📉 Long-Term Accumulation Range: $14.6 – $23.7
Trendline Support:
✅ Rising since 2023, showing buyers consistently stepping in at higher levels
Fibonacci Retracement:
🔑 Price currently sitting between 0.5–0.786 Fib zone from the 2023 rally:
0.5 = $18.33
0.618 = $16.82
0.786 = $14.68
🟢 Bullish Scenario – Potential Multi-Leg Rally
If price holds and rebounds from this support region, we could see a stepped breakout with key resistance levels being taken out one by one:
1. First Resistance – $23.73: Psychological and structural breakout level
2. Second Target – $30.48: Prior major rejection area
3. Third Target – $47.13: 2024 resistance high
4. Macro Target – $69.99 to $85.88: Full breakout potential from triangle width and historical ATH zone
🚀 Upside Potential from Current Levels (~$18): Over 350%
📈 This would confirm the end of the accumulation cycle and signal the start of a long-term bullish phase.
🔴 Bearish Scenario – Breakdown Risk
In the event of a confirmed weekly candle closing below $14.6, we invalidate the ascending triangle and shift bias toward bearish retracement:
Next Support: $10.00
Extreme Bearish Target: $6.65 (macro low from 2022)
🛑 Breakdown from this structure would suggest failure of the accumulation pattern and return to long-term bearish pressure.
💡 Strategic Insight
ENS is one of the rare altcoins currently forming a clean high-timeframe bullish setup. This is the kind of structure institutional or swing traders look for when anticipating early entries before explosive moves.
With a tight invalidation below $14.6 and multiple upside targets, this setup provides a strong risk-reward opportunity.
#ENS #ENSUSDT #AltcoinBreakout #CryptoSetup #Accumulation #TechnicalAnalysis #CryptoTrading #SwingTrade #Fibonacci #AscendingTriangle

ENS/USDT Elliott WavesWe are most likely entering the 4th wave. Correlated charts such as CRYPTOCAP:BTC and CRYPTOCAP:OTHERS are showing a similar directional bias.
