EPICUSDT Forming Falling WedgeEPICUSDT is forming a clear falling wedge pattern, a classic bullish reversal signal that often indicates an upcoming breakout. The price has been consolidating within a narrowing range, suggesting that selling pressure is weakening while buyers are beginning to regain control. With consistent volum

EPICUSDT UPDATE#EPIC
UPDATE
EPIC Technical Setup
Pattern: Falling Wedge Pattern
Current Price: $0.612
Target Price: $0.953
Target % Gain: 60.36%
Technical Analysis: EPIC is breaking out of a falling wedge pattern on the 4H chart, signaling a potential bullish reversal. Price has cleanly pushed above the desce

EPICUSDT 8H#EPIC is moving inside a descending channel on the 8H timeframe. It is currently facing the Ichimoku cloud and the channel resistance. RSI and MACD are showing bullish momentum. Consider buying a small bag here and on the support zone between $0.562 ~ $0.539.
If price breaks above the channel, the

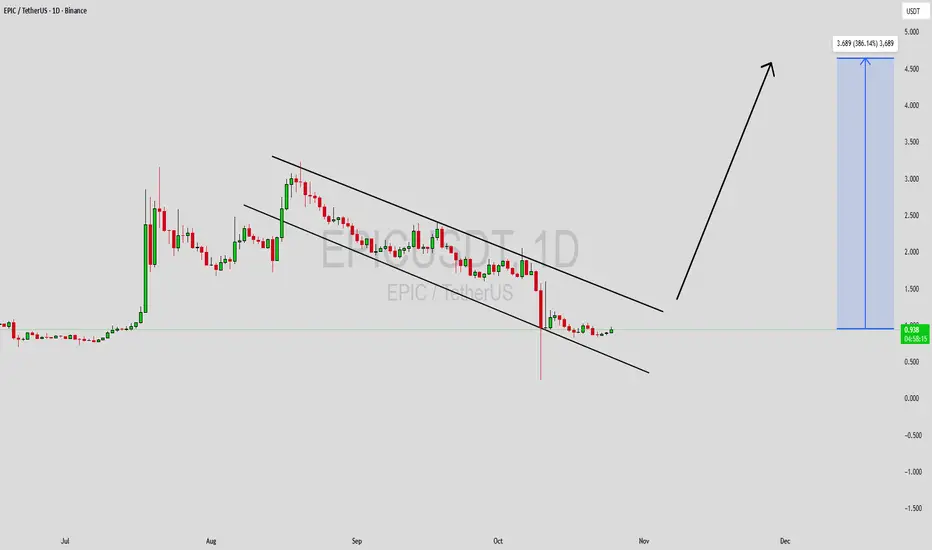
EPICUSDT Forming Falling WedgeEPIC/USDT is currently interesting to me because it appears to be forming a reversal structure—potentially a falling-wedge or consolidating base—where price action is tightening after a prior slide and volume remains elevated. The token, Epic Chain (EPIC), shows a circulating supply of 30 million to
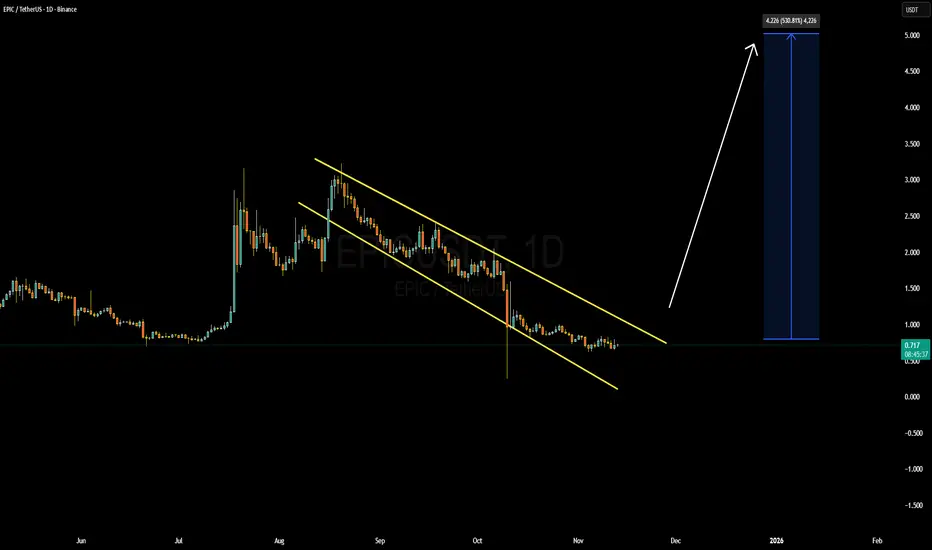
EPICUSDT Forming Falling WedgeEPICUSDT is currently forming a falling wedge pattern, a powerful bullish reversal signal that often precedes major upward momentum. This pattern reflects a period of consolidation where sellers are losing strength while buyers gradually regain control. Once a breakout occurs above the wedge resista
Concept of GON...Overview
Concept of GON - Get Out Now!!!
Thanks to spending most of my time on the wrong side of the markets, the GON (Get Out Now!!!) found me.
GON aids in telling me when the markets are about to gain momentum and start to move strongly against a wrong position, the realisation check to save

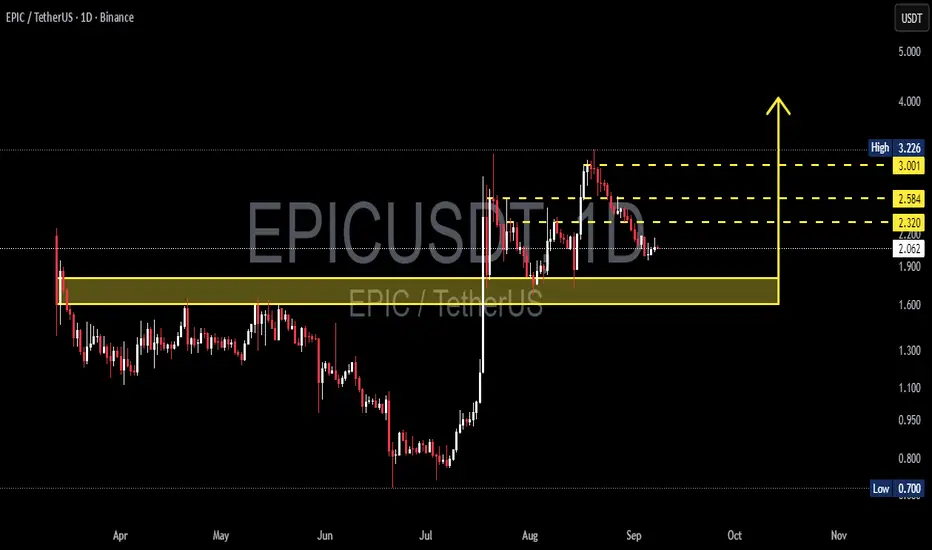
EPIC/USDT — Post-Breakout Distribution & Key Decision Levels!
🔎 Chart Summary
EPIC/USDT is currently in a distribution phase after a strong parabolic rally during mid-July – August. After hitting a local high of 3.22, price started forming lower highs, showing gradual selling pressure, and is now trading around 2.06.
The key battleground lies in the 1.55–1.7
Potential BuyThe closing of the current candle which is similar to an inverted hammer candle is only going to be more powerful if it closes with that structure.
The expected take profit(TP) or safest being 3.171 and the ultimate (TP) 3.728 .

EPIC .. come onOnce resistance is broken, it will be beautiful... $4+
You don't have to believe it...
It has been rising nicely since the beginning of this month, now it is consolidating and one more candle

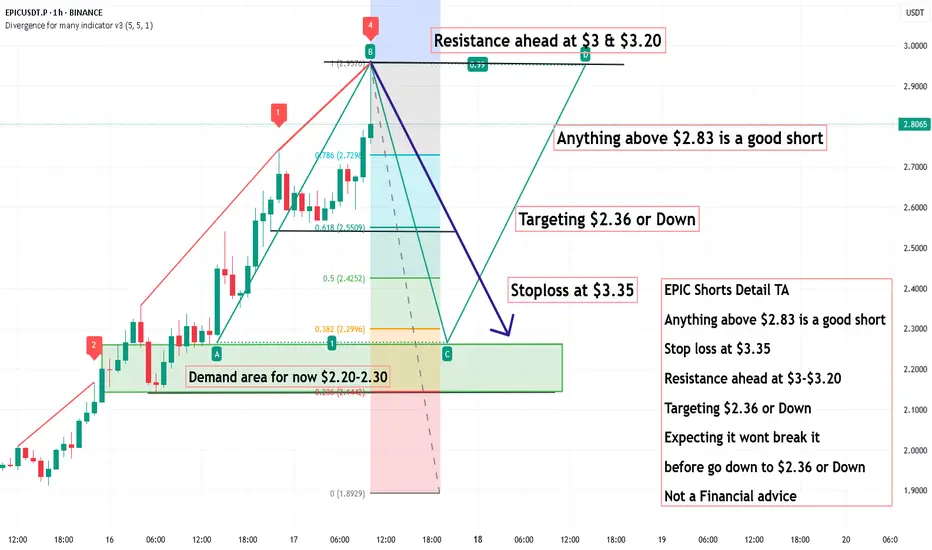
EPIC Shorts Detail TA, Anything above $2.83 is a good short EPIC Shorts Detail TA
Anything above $2.83 is a good short
Stop loss at $3.35
Resistance ahead at $3-$3.20
Targeting $2.36 or Down
Expecting it wont break it
before go down to $2.36 or Down
Not a Financial advice
See all ideas
Summarizing what the indicators are suggesting.
Oscillators
Neutral
SellBuy
Strong sellStrong buy
Strong sellSellNeutralBuyStrong buy
Oscillators
Neutral
SellBuy
Strong sellStrong buy
Strong sellSellNeutralBuyStrong buy
Summary
Neutral
SellBuy
Strong sellStrong buy
Strong sellSellNeutralBuyStrong buy
Summary
Neutral
SellBuy
Strong sellStrong buy
Strong sellSellNeutralBuyStrong buy
Summary
Neutral
SellBuy
Strong sellStrong buy
Strong sellSellNeutralBuyStrong buy
Moving Averages
Neutral
SellBuy
Strong sellStrong buy
Strong sellSellNeutralBuyStrong buy
Moving Averages
Neutral
SellBuy
Strong sellStrong buy
Strong sellSellNeutralBuyStrong buy