ETCUSD - Upside Potential 700% (Check ETCETH also)Hi.
Considering the low price and decent fundamentals, ETC is a good entry.
Not a trading advice.
Thanks
Gex
Trade ideas
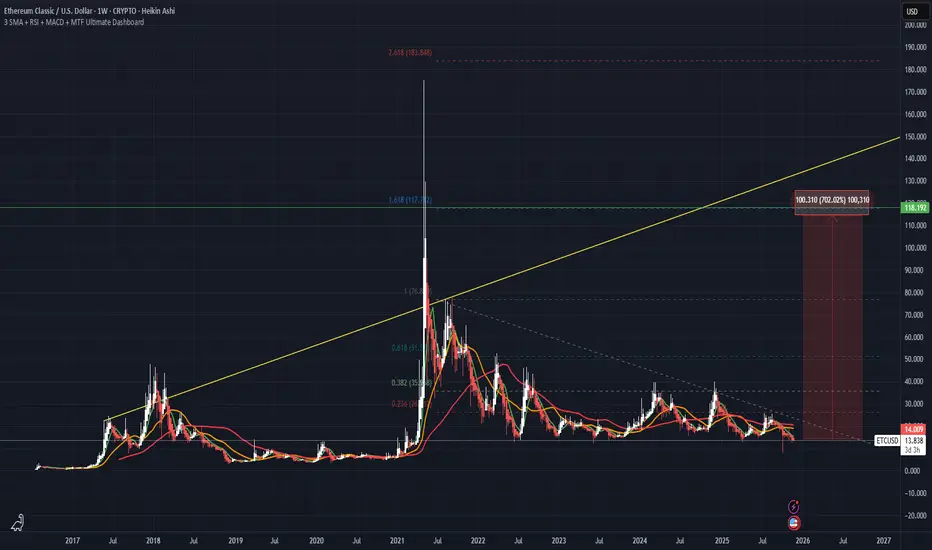

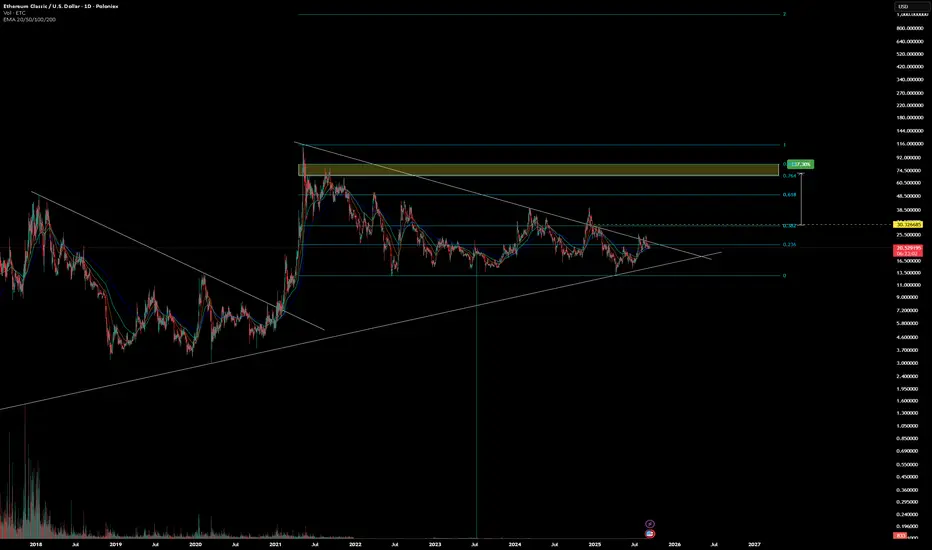
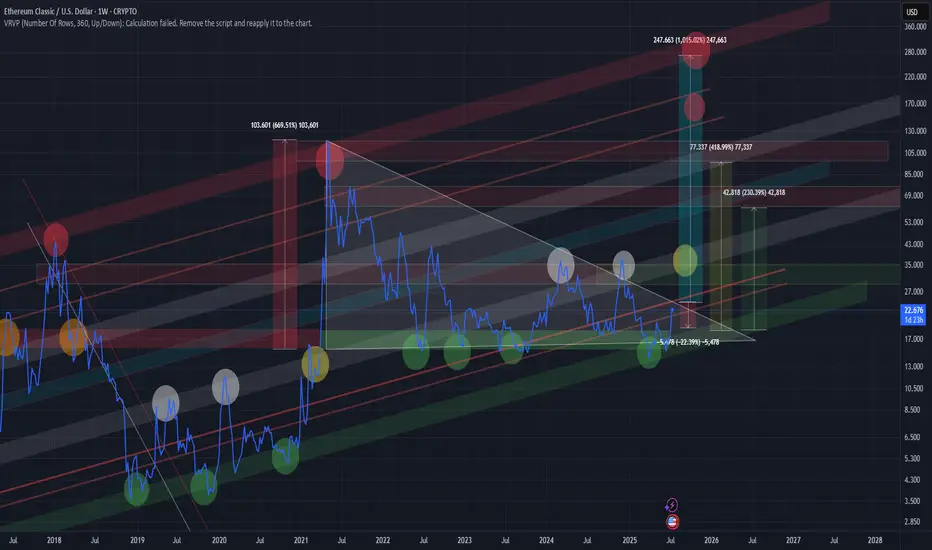
ETC (Long Term)ETC is forming a large flat, with waves A and B completed, and now It's forming wave C of this flat, which is an accelerating terminal wave, with waves 1, 2, and 3 completed, and It is completing wave 4 of this terminal, which cannot go above the top of wave 2, which is $26.5, and will be completed around $20 to $24.Then, wave 5 of this terminal must be completed, which must go below $12.7, the bottom of wave 1, until wave 5 of the terminal is completed, and after that, the new main market wave begins, which can raise ETC to the ATH $180.In addition, because ETC is forming a triangle in the long term that started in 2016 and it's waves A, B, and C were completed by 2021, and since 2021, the large wave D of this triangle is forming and completing, it cannot have more than the first three waves, so the end of this wave correction and the start of a new market wave cannot be later than April 2026.And this corrective wave should end sooner than this time and the new big wave should begin. So this wave should begin within the next 5 months.

Largest PoW smart-contract blockchainEthereum Classic (ETC) is often considered a top-5 Proof-of-Work chain because it retained PoW while major platforms such as Ethereum migrated to Proof-of-Stake, leaving ETC as the largest PoW smart-contract blockchain. After the Ethereum Merge, a significant amount of the Mining power shifted to ETC, raising its baseline hashrate and strengthening its security profile.
Its EVM-compatible Smart-Contract capability differentiates it from the remaining PoW networks, which are mainly currency-only!
ETC its now or neverA lot of speculation that these dino coins are dead and its just hype on peoples minds i will give you my bullish look so you can choose .we clearly have bullish divergence on the rsi and macd but are seeing lower lows so which is it? i believe after 5 year of consolidation in a triangle pattern its more probable we will see a test to to highs breakout of the 5 year triangle

ETCUSD - Symmetrical TriangleA symmetrical Triangle can be seen on this daily timeframe
Currently price is trending along the lower trend line of this formation
As seen previously price likes to jump up from this line.
Bullish situation following breakout.

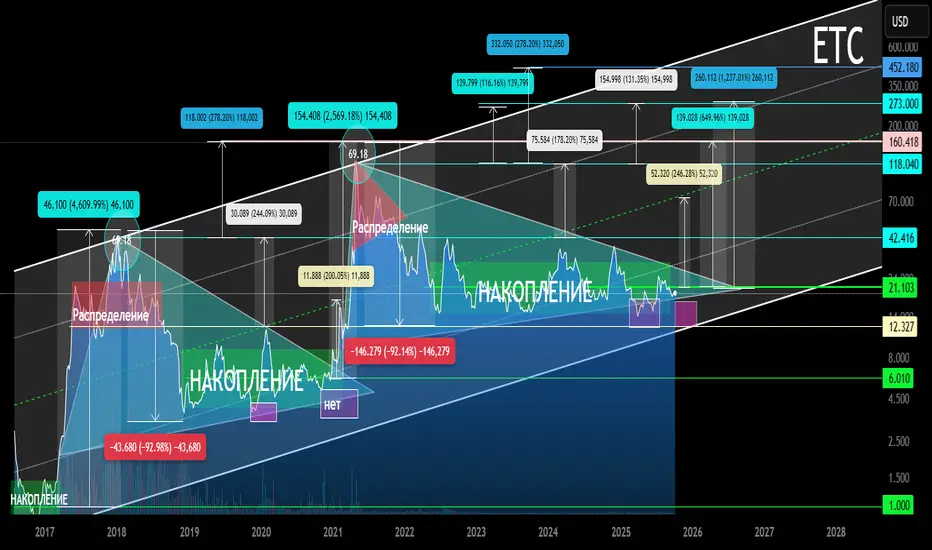
ETC Main Trend. Ascending Channel (all time) 10 2025Time frame: 1 week. Logarithm.
🔵Main trend: ascending, rising channel, since the inception of cryptocurrency.
🟡Secondary trend: descending, transitioning to a sideways trend (#accumulation), and forming a 4.9-year symmetrical triangle.
🟣Local trend: descending, trapped in the corner of a large triangle and “tension” consolidation before exiting.
Manage your risks and stick to your trading plan, don't get caught up in market and news noise, which creates dominant opinions and illogical actions by the majority, who are doomed to lose in the future.
Everything will be as it usually is with assets (stocks, less so cryptocurrencies. These are just a few examples of how these aren't real assets, but imitations of usefulness, i.e., a complete scam market). These assets have maintained an upward primary trend for a long time (from the very beginning), and huge, multi-year patterns form near dynamic support. That is, an upward breakout may initially throw passengers under the market , or some fictitious cryptocurrency events before a price rise (on a large time frame) don't be alarmed; ignore them, or use this opportunity to reduce the average price of the overall position. Or rather, before a dominant trend change, the "point of no return."
A striking example of this is XRP with its huge triangle and its exit (the first wave +600%, which is a capitulation on profits, or, in slang, a "hamster pump"). Then there will be 2-3 waves of price growth pumps, with each consolidation in the trend being "buried" and the cry "all is lost." In the final wave, possibly with spikes as before, a full-fledged #distribution zone will form.
XRP/USD Main Trend 07 2022
The market is simple at its core, but complex due to the interactions between people and their capital. The combination of simplicity and complexity creates many variations that you can exploit to profit from it. Your success and understanding of this determines your profit or loss in speculative markets.
You can complicate things without understanding their simplicity, which looks ridiculous from the outside. Playing smart. Or, conversely, simplifying complex, often false, concepts so that everything becomes clear and understandable. Simplicity is the essence of complexity.
In any activity, you should not pursue complexity to achieve the desired result, but rather simplification and optimization, so that you can achieve the same or better results with less effort and risk.
The entire secondary trend and this triangle with a local denouement zone in it.
Your trading plan and risk management eliminate all worries, indecision, emotional outbursts, predictions, and other people's right and wrong opinions.
Accumulation in Action: Preparing for the Breakout📎 Accumulation Observed
Highlighted zones show phases of accumulation — nothing unusual, just the market doing its thing.
Opportunities exist while most focus on noise.
While many chase short-term volatility, bigger players quietly build positions — turning cheap assets into expensive ones.
📋 Some Principles Instead of Advice:
🖇️ Risk isn’t found on the chart — it’s in your mind.
If you’re still hunting for “will it dump or hold” zones, it’s time to tighten your money management.
🖇️ Structure favors the buyer.
The market is cheap. And as always: cheap eventually becomes expensive — it’s not a question of “if,” but “when.”
🖇️ Drawdowns aren’t a tragedy.
If losses break your system — the problem isn’t the chart, it’s the lack of one. Management and strategy are the only indicators you fully control.
🔔 Like the idea if you find it useful. Share your thoughts in comments — strong zones aren’t debated, they’re confirmed by action.

ETH Beta & Decaying returnsAs it becomes clearer and clearer that alt-coin relevance is being dampened, I expect a couple of things:
1) The ETC fractal will play out again as with 2020-2021. Reaching it's conclusion by end of Q4 2025, and starting a year's long bear market thereafter.
2) The return for said fractal will not exceed the previous cycle high. (See altcoin return decay in legacy altcoins like CRYPTOCAP:LTC , CRYPTOCAP:XRP , etc. in 2021).
Target = $80-$100
This entire rally is dependent upon BTC not entering a bear-market this month or in October, which is still TBD.
If a bear market happens, the entire structure of the altcoin market will be permanently compromised, heralding in a much needed but painful wipeout of projects not named 'Bitcoin'
ETH survivorship however, would bode well for ETC in future cycles.
ETC Breakout Alert!🚨 BME:ETC Breakout Alert! 🚨
BME:ETC is currently testing the red resistance zone 🔴
If price breaks out, the first target will be the green line level 🎯
A confirmed breakout here would signal bullish continuation and could push price higher ✅

ETC 100$+Let's take BME:ETC as the face of most altcoins.
Same fractal, same psychology.
This cycle is much longer than the previous one, so I won't give any exact dates, but I feel that we will be trading at high prices in 2026.

ETC 26, then 30?ETC coat riding ETH. After 26, little resistance between it and 30. Several strong fibs exist there. Attainable (and beyond) if BTC continues push to 135 by EOM

ETC Bull DivsHidden bill divs established, MA, and fib support currently holding. Nice reversal setup.

ETC 19MA and fib convergence at 19. Nice potential entry assuming BTC holds daily channel at or around 112. Long way to 112 so ETC may break support.

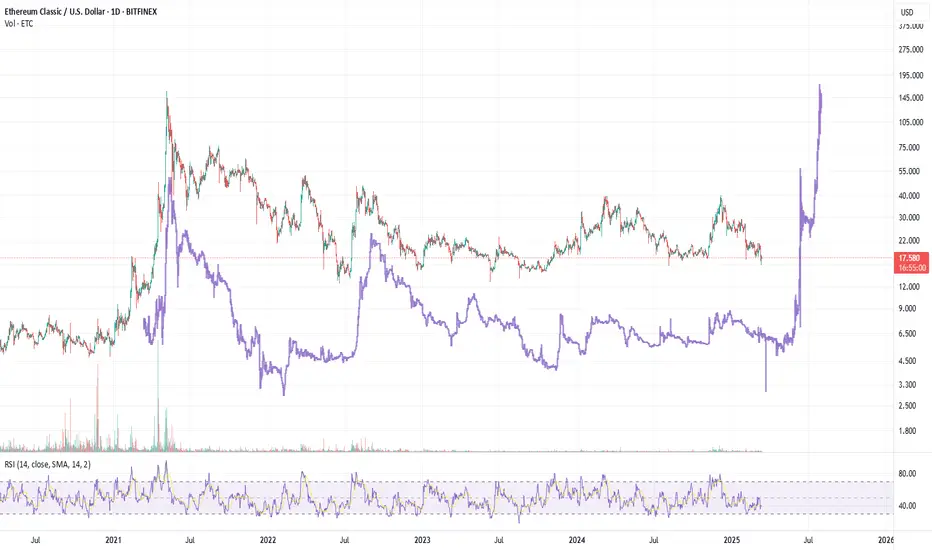
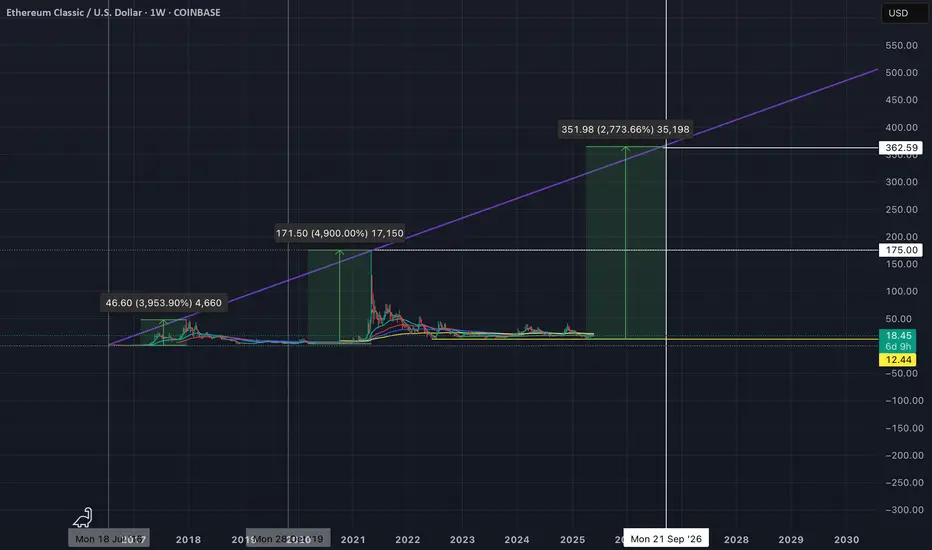
ETC/USD – Weekly Chart Overview Ethereum Classic is trading at a key long-term support zone, bouncing from the lower bound of a multi-year ascending channel. Historically, this zone has triggered large rallies (2019, 2020, 2021).
Major resistance levels are stacked at $24, $42, $77, and $103. If the price holds above $22–24 and breaks out with volume, it could retest the mid/high zones of the channel.
Structure remains bullish above $20. Break and hold above $26–27 may signal the start of a new macro wave.
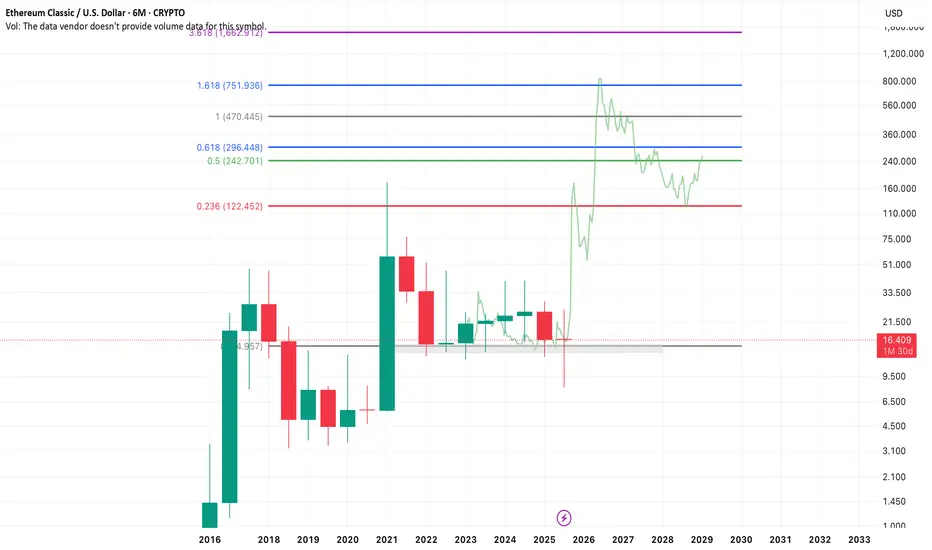
ETC time to be bullish!ETC ranging after +90% correction from the top. We have seen same pattern in 2020 after we drop +90% from the top. You can also see ETC and ETH having same pattern so if you are bullish on ETH you have to be bullish on ETC...
I expect push out of the accumulation range opening strong impulse to new ATH. Likely target is fibb 1.272 extension but wick to fibb 1.618 is also possible. In any case once in new ATH range start slowly securing profits.

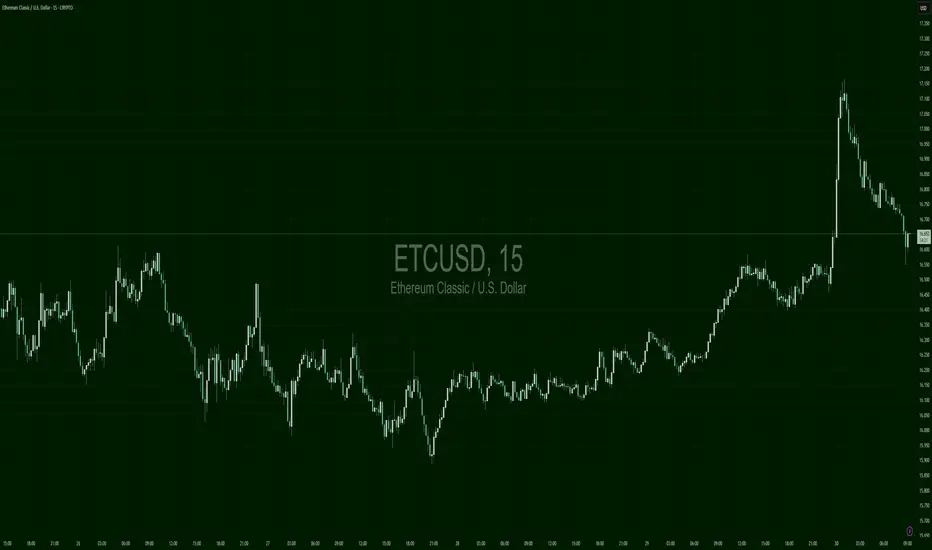
ETCUSD – Pump Then PauseEthereum Classic was stuck in a sideways grind around the $16.00–$16.50 region for several days, forming a broad base with minor fakeouts. That pattern resolved in a sharp vertical pump to $17.20, followed by an immediate fade. Currently, price is retracing back toward the old base zone. Watch the $16.50 level: holding it suggests bulls may re-accumulate, but further breakdown puts $16.10–$16.20 back in play.
ETC rayLove it so far I can do it tomorrow I have a few questions about what time do it again next week I will let you do it again next year I can do it again soon and then I will be a little bit late but I will be a few minutes I will let you know when
ETC TO THE MOONBullish divergence on the 3M chart forming on RSI imdicator. Very very high probability of seeing new highs. Dont be fooled by the news. Numbers are more important than words.
Stay blessed.
DYTRDR.

ETC, UNI, SHIB, to the moon.ETC, UNI, SHIB, who will lead? 3 level fractals. One of my favorite patterns.

Ethereum Classic (ETC) Breakout Alert: Is $20+ the Next Stop?ETC/USD 4H Chart Analysis – Bullish Momentum Incoming?
Ethereum Classic (ETC) is showing signs of a potential breakout, as seen in the 4-hour chart. Here’s a deep dive into the technical setup and what traders should watch for in the coming sessions.
🔥 Key Takeaways:
✅ Ascending Triangle Formation: A strong bullish pattern, indicating possible upside continuation.
✅ Breakout Confirmation: Price has pushed above a key resistance level, suggesting buyers are stepping in.
✅ Targets in Sight:
🎯 TP1: Around $19.17 (previous resistance)
🎯 TP2: Around $19.95 (strong historical supply zone)
✅ Support & Risk Management:
Stop-Loss (SL): Placed around $18.00, ensuring a good risk-to-reward ratio.
✅ Moving Averages: Price is approaching the 200MA, a key dynamic resistance around $18.90—a break above this would confirm further bullish momentum.
📈 Trading Outlook:
If ETC holds above $18.30 and successfully flips $18.90 into support, we could see a quick move towards $19.95+. However, rejection at this level could lead to a pullback towards the $18.00 region.
🚨 Bullish or Bearish?
This setup leans bullish, but confirmation of a clean breakout above $19.00-$19.20 will be key. Keep an eye on volume and overall market sentiment!
📊 What’s your take? Are you long or waiting for more confirmation? Drop your thoughts below! 🔥


will this pattern complete?copied the purple pattern from xrp 2014 - 2017.5
do these patterns complete?