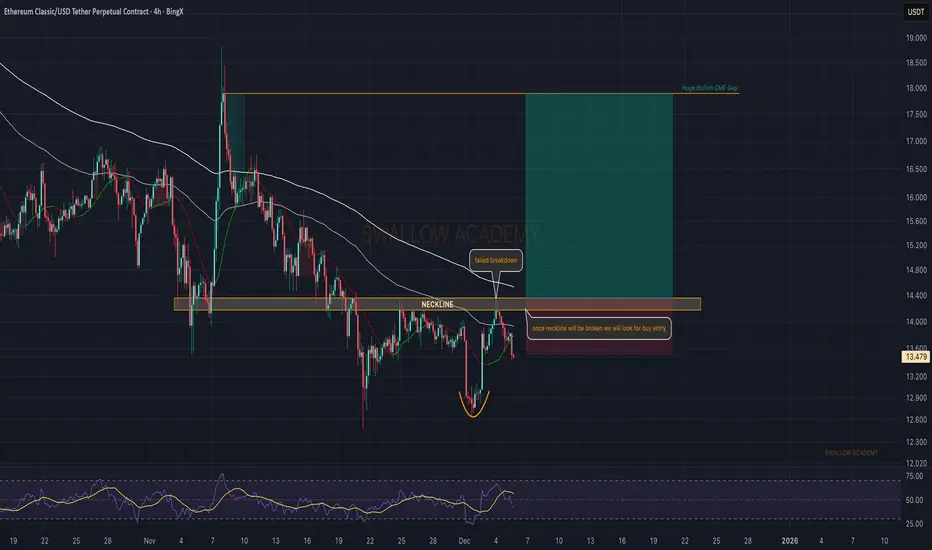
Ethereum Classic (ETC): Looking For Break of Neckline | BullishETC keeps rejecting around the neckline, and until buyers break and secure this level there’s no clean long setup yet. The good part is that we already saw a failed breakdown at the lows, which shows buyers defending the zone.
Once we get a clean breakout above the neckline, the plan becomes straig
Ethereum classic - An elder resident of God’s waiting roomAn opening statement: The idea is not restricted to Ethereum Classic (ETC), many legacy tokens are showing the same sequence of events as highlighted in the chart above. The recent update to the OTHERS total idea identifies a few.
Story so far
The Crypto gambling mania of older tokens continue

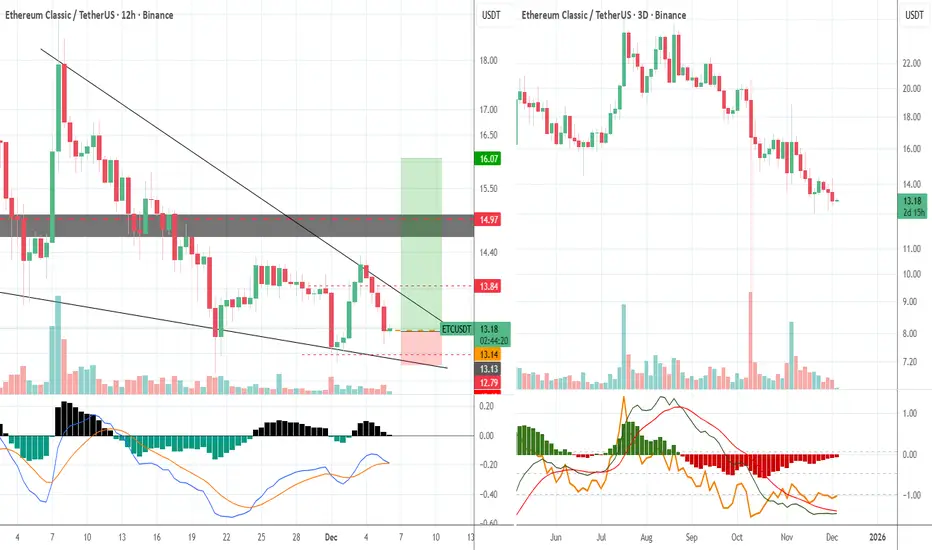
ETC/USDT Long Set-up
— Technical formation: wedge, supported by divergence on higher timeframes, dangerously close to the level, but the movement has not developed for almost a month. Strong short signal on Bitcoin has already played out.
— Entry: $13.125 Market buy
— Stop: $12.55 – 4.5% (this is the percentage of pri
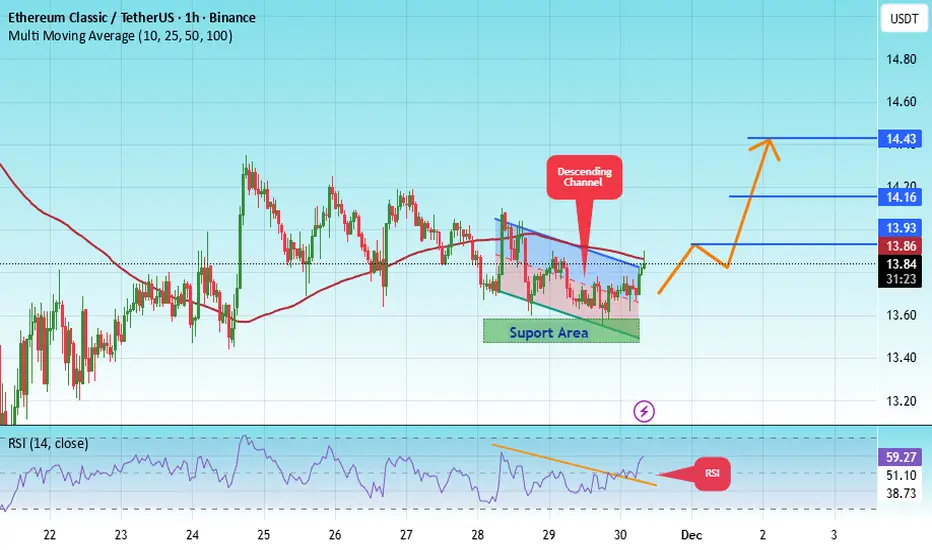
#ETC/USDT The price is moving within an ascending channel#ETC
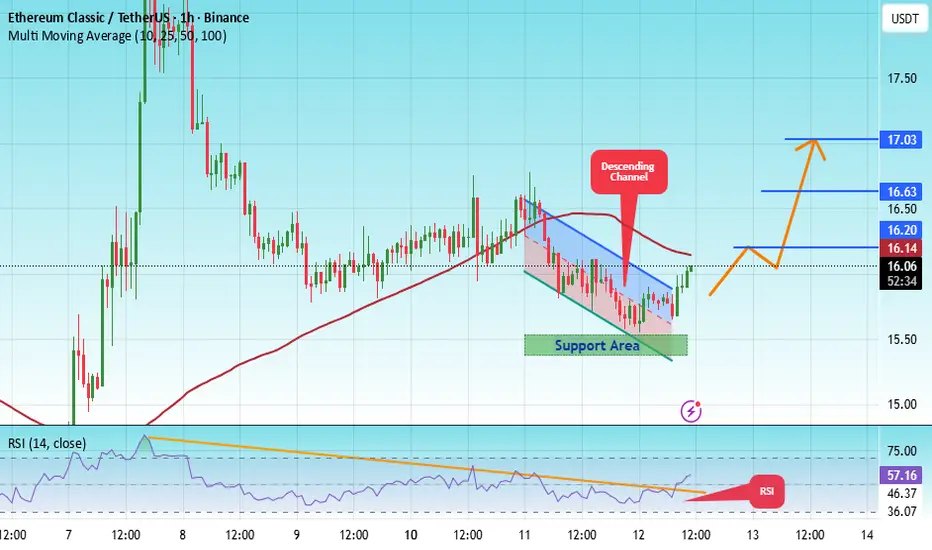
The price is moving in a descending channel on the 1-hour timeframe. It has reached the lower boundary and is heading towards breaking above it, with a retest of the upper boundary expected.
We have a downtrend on the RSI indicator, which has reached near the lower boundary, and an upward reb
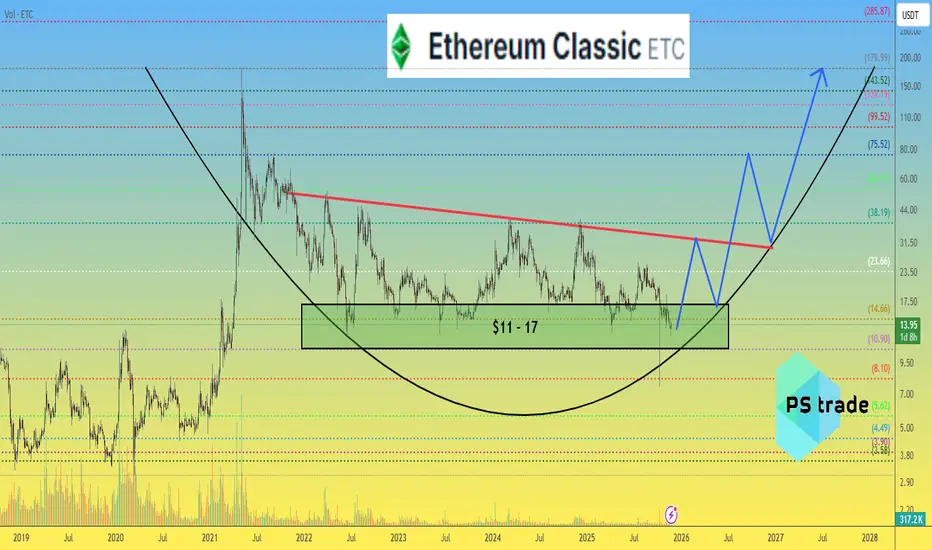
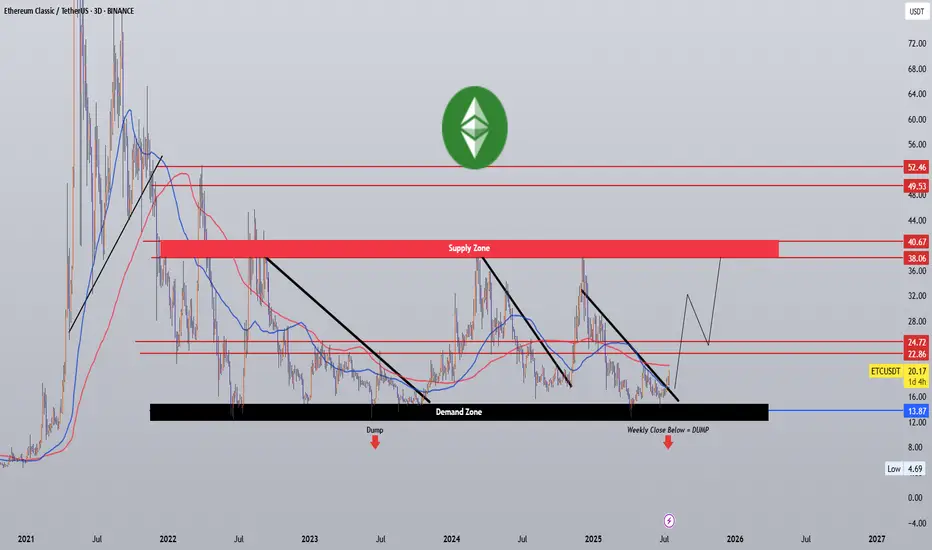
Ethereum Classic ETC price analysis#ETC continues to respect a well-defined multi-year support range at $11–17, which has historically served as a base for upward expansions.
Key resistance levels to watch:
• $32 • $75 • $180
The current market capitalization of $2.15B suggests that even a 2x–5x-10x appreciation would be noticeab
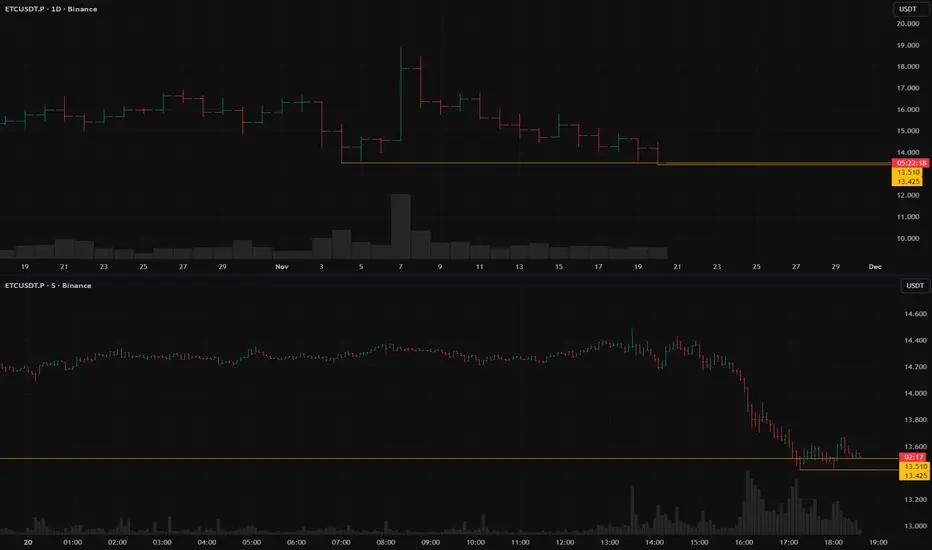
ETCUSDT.P:short setup from daily support 13.425BINANCE:ETCUSDT.P is dropping alongside Bitcoin. Currently, the price has hit a strong level and started "grinding" it. While this is typically a messy signal, there is structure within this chop, as a clear local level has formed at 13.425, offering a potential short setup. Although the asset has
#ETC/USDT #ETC The price is moving within an ascending channel #ETC
The price is moving within an ascending channel on the 1-hour timeframe and is adhering to it well. It is poised to break out strongly and retest the channel.
We have a downtrend line on the RSI indicator that is about to break and retest, which supports the upward move.
There is a key suppo
#ETCUSDT Trade setup! 7-2025📌 Coin: ETC (Ethereum Classic)
💰 Buy Levels:
✅ Accumulation Zone: $17.00 – $20.00
🧠 Fundamental Analysis (FA) – In Short
*️⃣ Sector: Layer 1 blockchain / Proof of Work (PoW)
*️⃣ Use Case: Ethereum Classic is the original Ethereum chain, maintained after the DAO hack. It preserves the principle of i
ETC Could Be Moving!💎 ETC Could Be Moving!
BME:ETC (Ethereum Classic) is right at a major decision point.
It's trying to break above a long-term downward trendline. If the price can close above this line and the group of moving averages (the red/green band), it will be a strong sign that the bulls are taking over.

#ETC/USDT Might Be Good Zone to Bounce From#ETC
The price is moving within an ascending channel on the 1-hour timeframe and is adhering to it well. It is poised to break out strongly and retest the channel.
We have a downtrend line on the RSI indicator that is about to break and retest, which supports the upward move.
There is a key suppo

See all ideas
Summarizing what the indicators are suggesting.
Oscillators
Neutral
SellBuy
Strong sellStrong buy
Strong sellSellNeutralBuyStrong buy
Oscillators
Neutral
SellBuy
Strong sellStrong buy
Strong sellSellNeutralBuyStrong buy
Summary
Neutral
SellBuy
Strong sellStrong buy
Strong sellSellNeutralBuyStrong buy
Summary
Neutral
SellBuy
Strong sellStrong buy
Strong sellSellNeutralBuyStrong buy
Summary
Neutral
SellBuy
Strong sellStrong buy
Strong sellSellNeutralBuyStrong buy
Moving Averages
Neutral
SellBuy
Strong sellStrong buy
Strong sellSellNeutralBuyStrong buy
Moving Averages
Neutral
SellBuy
Strong sellStrong buy
Strong sellSellNeutralBuyStrong buy
Displays a symbol's price movements over previous years to identify recurring trends.