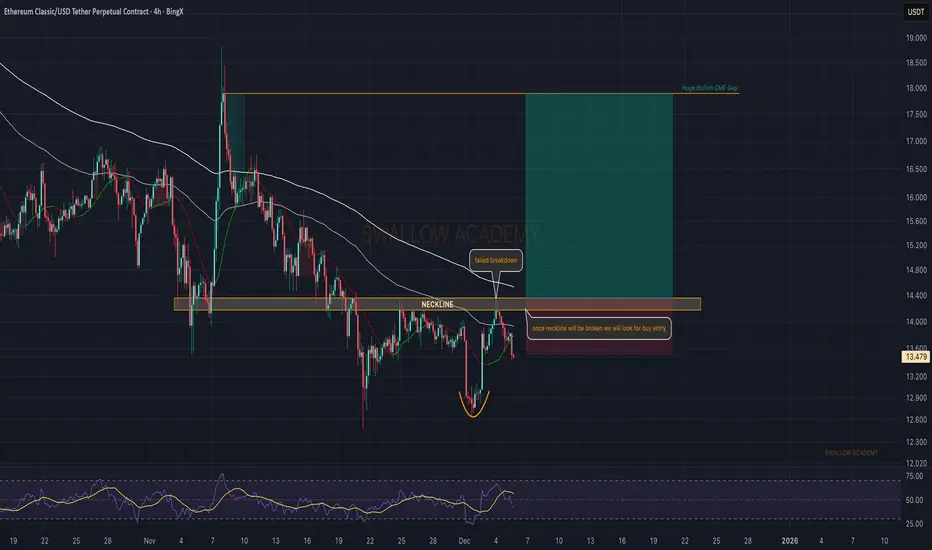
Ethereum Classic (ETC): Looking For Break of Neckline | BullishETC keeps rejecting around the neckline, and until buyers break and secure this level there’s no clean long setup yet. The good part is that we already saw a failed breakdown at the lows, which shows buyers defending the zone.
Once we get a clean breakout above the neckline, the plan becomes straightforward — look for an entry on the retest and aim for the big CME gap above. In the current market these bullish gaps usually act like magnets, so the moment structure flips, the upside move can come fast.
Swallow Academy
Trade ideas
Ethereum classic - An elder resident of God’s waiting roomAn opening statement: The idea is not restricted to Ethereum Classic (ETC), many legacy tokens are showing the same sequence of events as highlighted in the chart above. The recent update to the OTHERS total idea identifies a few.
Story so far
The Crypto gambling mania of older tokens continues to entice many. Market participants were told financial armageddon is around the corner, prepare now. A corner that turned out to be a roundabout, an endless road to nowhere with changing views. “ETF is coming Ww!” “Trump will approve new Crypto fund blah blah”, the inbox is filled with such messaging. The project fundamentals are now irrelevant, it seems, as folks hope and pray for a greater fool to come along and release them from the stress of holding dead weight. But what if the crypto fool supply is drying up? Then what?
The technical warning
The above 8 chart of Ethereum classic is typical of many legacy tokens. Like stone skipping. That is, you throw this little flat stone across the pond and at first it’s amazing, it’s like, boing! boing! boing! You feel like a physics genius. However what’s actually happening, properly, scientifically, is the stone’s cheating gravity for a bit. It hits the water at just the right angle, makes this tiny lift like a miniature water trampoline. But every time it hits, it loses a bit of energy. Bit of speed, bit of spin, bit of dignity. Eventually it’s like, ‘Nah, I’m done,’ and just plops in. That’s it. It’s run out of the stuff that keeps it skipping. It’s the same as me after two beers trying to dance, starts strong lots of energy, then gravity wins. Straight down. Splash..
Sentiment
No shortage of long ideas on the platform.
. To be a contrarian is to look the other direction when everyone else says the same thing. Not easy, but imperative.
Like many legacy charts, the Bitcoin pairs exhibit broken market structures. ETC.btc chart, broken market structure
Conclusions
There’s no polite way to say this, Ethereum Classic, like many of its legacy peers is running on fumes. Every bounce looks impressive until you zoom out and realise it’s just another stone skip on the surface of a dying pond. Each lower high is a polite reminder that gravity still works.
The chart doesn’t lie:
Momentum’s gone.
Liquidity’s gone.
Belief is on life support.
Price continues to cling to the same horizontal band it’s bounced off for half a decade, the so-called “water line where surface tension and angular momentum meet.”* Below it? Silence.
You’ll always find someone calling this “undervalued,” or “ready for a comeback.” But let’s be honest, that’s nostalgia speaking. What used to be innovation is now a museum exhibit, a relic from the days when everyone thought “blockchain” was going to save the world.
Sure, maybe there’s a pop left in it, one final gasp, a skip before the splash. But when it happens, don’t mistake physics for faith.
Eventually, every stone sinks.
Ww
============================================================
Disclaimer
This isn’t financial advice, obviously.
If you’re buying Ethereum Classic because someone on the internet said it might bounce, that’s not investing, that’s performance art. I don’t hold ETC, I don’t want to, and if it suddenly moon-shots I’ll still sleep fine.
Do your own research, manage your own risk, and please for your own sanity stop expecting miracles from assets that peaked during the Obama administration.
If it goes up, brilliant.
If it goes down, well… gravity wins again.

#ETC/USDT The price is moving within an ascending channel#ETC
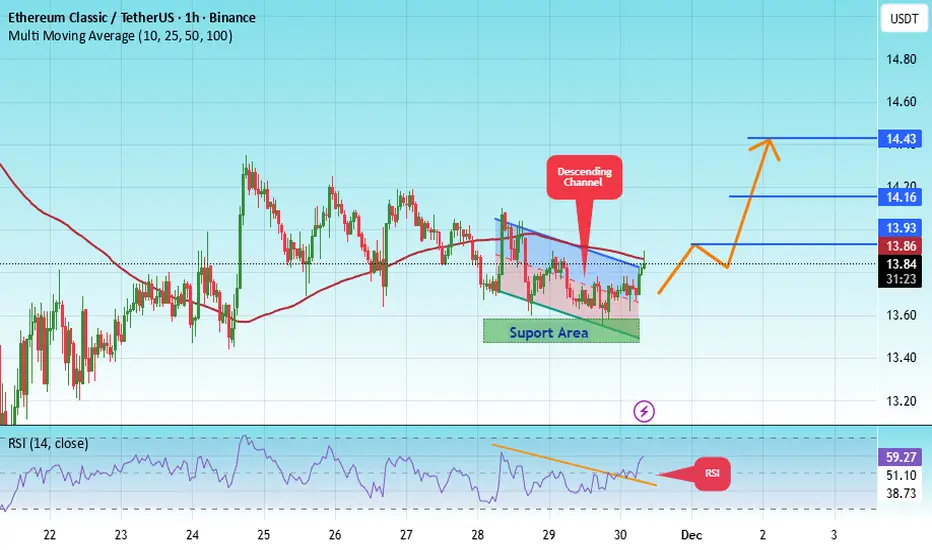
The price is moving in a descending channel on the 1-hour timeframe. It has reached the lower boundary and is heading towards breaking above it, with a retest of the upper boundary expected.
We have a downtrend on the RSI indicator, which has reached near the lower boundary, and an upward rebound is expected.
There is a key support zone in green at 13.86. The price has bounced from this zone multiple times and is expected to bounce again.
We have a trend towards stability above the 100-period moving average, as we are moving close to it, which supports the upward movement.
Entry price: 13.86
First target: 13.93
Second target: 14.16
Third target: 14.43
Don't forget a simple principle: money management.
Place your stop-loss below the support zone in green.
For any questions, please leave a comment.
Thank you.
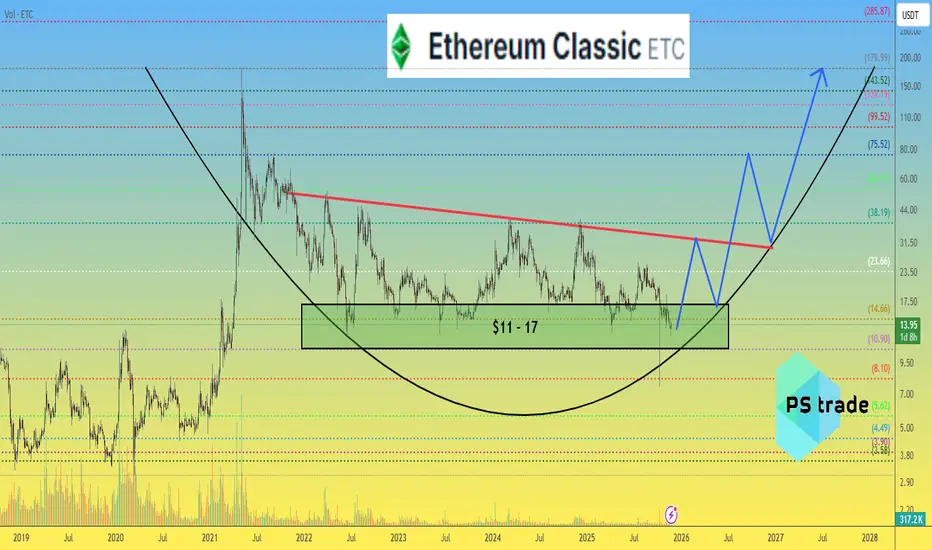
Ethereum Classic ETC price analysis#ETC continues to respect a well-defined multi-year support range at $11–17, which has historically served as a base for upward expansions.
Key resistance levels to watch:
• $32 • $75 • $180
The current market capitalization of $2.15B suggests that even a 2x–5x-10x appreciation would be noticeable for chart analysts, but insufficient to shift broader market dynamics.
Nevertheless, #ETC remains relevant for traders monitoring undervalued legacy assets with long accumulation phases.
Question:
Do you consider OKX:ETCUSDT a viable mid-cycle opportunity, or is its structural momentum too weak for strong upside continuation?
______________
◆ Follow us ❤️ for daily crypto insights & updates!
🚀 Don’t miss out on important market moves
🧠 DYOR | This is not financial advice, just thinking out loud
ETC/USDT Long Set-up
— Technical formation: wedge, supported by divergence on higher timeframes, dangerously close to the level, but the movement has not developed for almost a month. Strong short signal on Bitcoin has already played out.
— Entry: $13.125 Market buy
— Stop: $12.55 – 4.5% (this is the percentage of price movement from entry to stop, NOT percentage of loss)
— Target: $16.5
Risk per trade: 1% of total deposit – this is the actual percentage of loss
Position size: 20% of total deposit, leverage 10x
RR 1:6
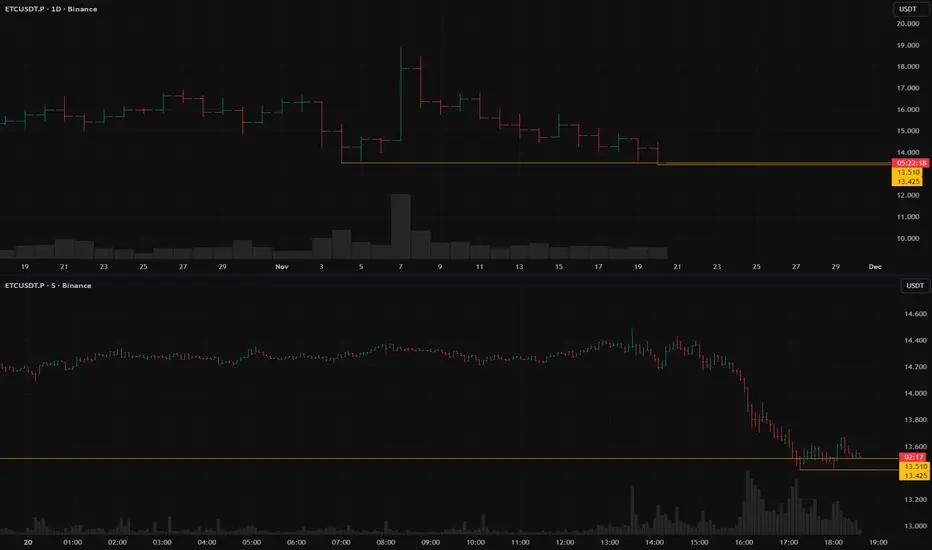
ETCUSDT.P:short setup from daily support 13.425BINANCE:ETCUSDT.P is dropping alongside Bitcoin. Currently, the price has hit a strong level and started "grinding" it. While this is typically a messy signal, there is structure within this chop, as a clear local level has formed at 13.425, offering a potential short setup. Although the asset has already covered a significant range today, I am keeping it on watch. If the price continues to consolidate tightly without pulling away, or if we see a weak correction followed by a smooth re-approach, I will await my entry trigger.
Key factors for this scenario:
Global & local trend alignment
Price void / low liquidity zone beyond level
Correlation with the market
Volatility contraction on approach
Immediate retest
Prolonged consolidation
No reaction after a false break
Factors that contradict this scenario:
Exhaustive move (approaching from afar)
Was this analysis helpful? Leave your thoughts in the comments and follow to see more.
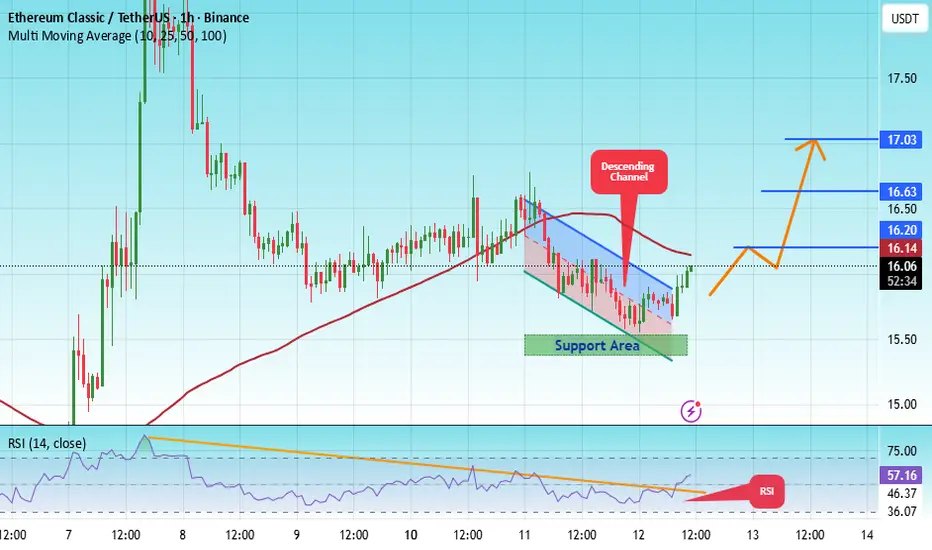
#ETC/USDT #ETC The price is moving within an ascending channel #ETC
The price is moving within an ascending channel on the 1-hour timeframe and is adhering to it well. It is poised to break out strongly and retest the channel.
We have a downtrend line on the RSI indicator that is about to break and retest, which supports the upward move.
There is a key support zone in green at the 15.50 price, representing a strong support point.
We have a trend of consolidation above the 100-period moving average.
Entry price: 16.00
First target: 16.20
Second target: 16.63
Third target: 17.00
Don't forget a simple money management rule:
Place your stop-loss order below the green support zone.
Once you reach the first target, save some money and then change your stop-loss order to an entry order.
For any questions, please leave a comment.
Thank you.
#ETCUSDT Trade setup! 7-2025📌 Coin: ETC (Ethereum Classic)
💰 Buy Levels:
✅ Accumulation Zone: $17.00 – $20.00
🧠 Fundamental Analysis (FA) – In Short
*️⃣ Sector: Layer 1 blockchain / Proof of Work (PoW)
*️⃣ Use Case: Ethereum Classic is the original Ethereum chain, maintained after the DAO hack. It preserves the principle of immutability — “code is law.”
*️⃣ Tech: Maintains a PoW consensus model, compatible with Ethereum’s EVM. No Merge, no PoS — making it a haven for GPU miners and decentralization maximalists.
*️⃣ Narrative Fit: Seen as the last major PoW smart contract chain, it holds ideological and technical value for decentralization purists.
*️⃣ Adoption: Compatible with ETH-based tooling (e.g. Solidity, Metamask), though limited dApp activity compared to ETH.
*️⃣ Security: Previously suffered 51% attacks but significantly improved since via protocol updates and increased hash rate (especially post-ETH Merge).
*️⃣ Speculation Angle: Often rallies as a hedge to ETH, especially in PoW vs PoS debates, or when narratives around GPU mining resurface.
🎯 Bull Market Target (Realistic)
Target Range: $45 – $60
*️⃣ Reflects previous cycle top and renewed interest in hard-money smart contract platforms.
🚀 Mega Bullish Target (Speculative Top)
Target Range: $85 – $120+
*️⃣ If ETC reclaims attention as a “decentralized alternative to Ethereum,” or becomes home to major mining-backed protocols or ETH dApp migration forks.
✅ Final Take
🧠 ETC is a legacy chain with strong ideological backing and a unique PoW value proposition. Though its ecosystem is quieter than ETH or SOL, its historical patterns show violent upside swings during bull cycles.
We ask Allah reconcile and repay
ETC Could Be Moving!💎 ETC Could Be Moving!
BME:ETC (Ethereum Classic) is right at a major decision point.
It's trying to break above a long-term downward trendline. If the price can close above this line and the group of moving averages (the red/green band), it will be a strong sign that the bulls are taking over.
Keep ETC on your watch list! If this breakout confirms, a significant price rally could be triggered.
#ETC #ETCUSDT

#ETC/USDT Might Be Good Zone to Bounce From#ETC
The price is moving within an ascending channel on the 1-hour timeframe and is adhering to it well. It is poised to break out strongly and retest the channel.
We have a downtrend line on the RSI indicator that is about to break and retest, which supports the upward move.
There is a key support zone in green at 15.50, representing a strong support point.
We have a trend of consolidation above the 100-period moving average.
Entry price: 15.85
First target: 16.08
Second target: 16.32
Third target: 16.68
Don't forget a simple money management rule:
Place your stop-loss order below the support zone in green.
Once the first target is reached, save some money and then change your stop-loss order to an entry order.
For any questions, please leave a comment.
Thank you.

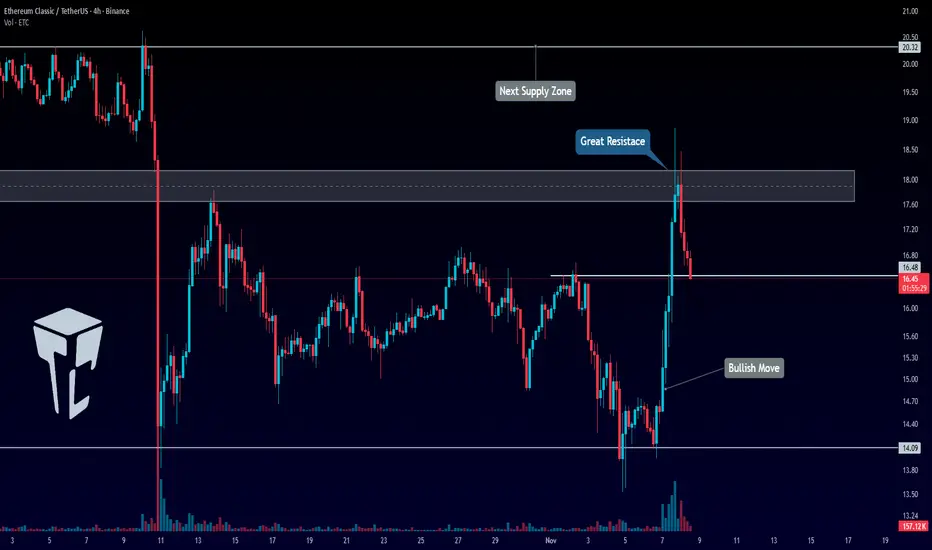
TradeCityPro | ETC: Key Levels and Trend Analysis👋 Welcome to TradeCity Pro!
In this analysis, I want to review the ETC coin—one of the Layer 1 projects with a market cap of $2.57 billion, currently ranked 39th on CoinMarketCap.
⏳ 4-Hour Timeframe
On the 4-hour timeframe, this coin made an upward move after being supported at the 14.09 level and was able to reach around the $18 zone.
✅ Currently, the price has had a minor correction, dropping to near the 16.48 level.
🎲 If the 18$ level is broken, the continuation of the move will begin, and we can use this as a trigger for a long position.
✨ If the correction continues and the 16.48 level is broken, the price could undergo deeper corrections.
📊 Currently, the volume is in favor of the buyers, and the volume has been decreasing during the correction. Therefore, if the price moves towards the 18$ zone with increasing volume, we can open a long position.
⭐ The main confirmation for a bullish trend on this coin will be breaking the 18$ zone and setting a higher high and low beyond this level. The next resistance level for the price is at 20.32$.
📝 Final Thoughts
Stay calm, trade wisely, and let's capture the market's best opportunities!
This analysis reflects our opinions and is not financial advice.
Share your thoughts in the comments, and don’t forget to share this analysis with your friends! ❤️
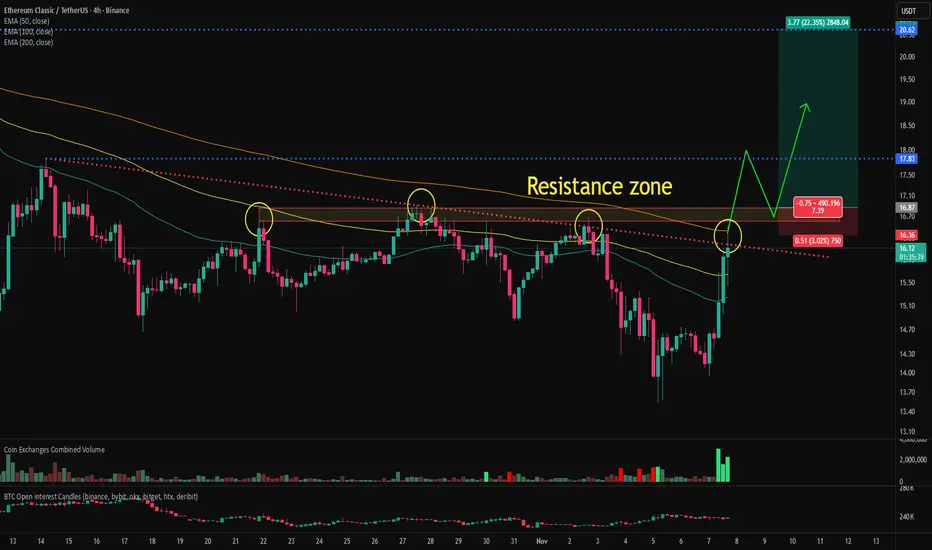
ETC(ehereum classic) chart analysis and bullish signalEthereum Classic is currently attempting to break above the 200-period moving average, a key resistance level, and a major supply zone on the 4-hour chart. Although it’s facing resistance at the moment, a decisive breakout through these overlapping resistance zones could provide an attractive long-entry opportunity with a favorable risk-to-reward ratio.
Given that this resistance area has rejected multiple breakout attempts in the past, the probability of a successful breakout this time appears relatively high.
The ETC/BTC chart has also cleared several major resistance levels, suggesting that ETC could follow a similar pattern to recent strong performers such as ZEC, DASH, and 1INCH.
The bullish alignment on the ETC/BTC chart also indicates that Ethereum Classic is outperforming Bitcoin.
If Ethereum Classic confirms a breakout above the resistance zone, I will share an updated analysis on the subsequent price outlook.
ETC - BEARISH OUTLOOKBME:ETC - price update: 🔴
The current price is sitting on a key support monthly/weekly. .
PA looks weak at the moment, but support are holding.
Yellow zone: 14.50 - 16.80$ = Neutral.
Prices remain stuck under key level, and bias is clearly bearish yet.
A daily candle close under 14.00$ could trigger another big bearish breakout toward 11.50 - 10.00$ or even 8.00$ again!
Upper key resistance:
16.80 - 17.70 - 20.00$ & downtrend daily!
To sum up:
No bull pressure yet, prices is stuck under key levels, and support could be break by the downside! 📉🔴

A 1200% gain to $400 in 2024 for ETC?Since May 2021 Ethereum classic has corrected 90% as shown on the above weekly chart. Unlike many legacy tokens ETC is one of the few building structure. The reasons to now consider a long position include:
1) Trend reversal, higher highs higher lows replace lower highs lower lows.
2) Support and resistance. Price action has left the long term downtrend channel resistance as indicated by the green arrows. Look left and see past horizontal resistance is now confirming support.
3) Hidden bullish divergence. This particular indication informs a strong move is about to occur. It happens when price action prints a higher low with a lower low on the stochastic RSI oscillator.
4) The price target. The downtrend channel is in actual fact a bull flag. The first impulsive move of 2021 becomes the flagpole. This flagpole is used to measure the target from the exit point of the channel to the area of $400
Is it possible price action continues to correct? Sure.
Is it probable? No.
Ww
Type: trade
Risk: <= 6%
Time frame for long: You decide
Return: 1200%

ETC in 2026Ethereum Classic is completing a neutral triangle or diametric pattern that will complete in the coming months and could start an uptrend or a new cycle.

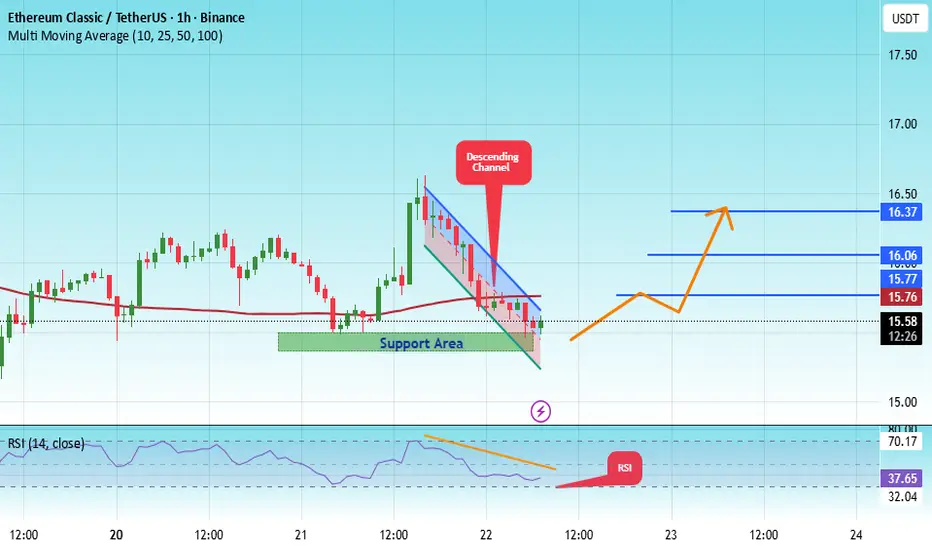
#ETC/USDT Might Be Good Zone to Bounce From#ETC
The price is moving within a descending channel on the 1-hour frame, adhering well to it, and is heading for a strong breakout and retest.
We have a bearish trend on the RSI indicator that is about to be broken and retested, which supports the upward breakout.
There is a major support area in green at 15.41, representing a strong support point.
We are heading for consolidation above the 100 moving average.
Entry price: 15.60
First target: 15.76
Second target: 16.06
Third target: 16.37
Don't forget a simple matter: capital management.
When you reach the first target, save some money and then change your stop-loss order to an entry order.
For inquiries, please leave a comment.
Thank you.
ETC/USDT Short Set-up ETC/USDT Short Set-up
— Strong accumulation, a triangle has formed; technically, it entered after a drop, with a high probability of trend continuation. Price is consolidating below the 200/50 MA on the daily timeframe (trend reversal signal), with multiple support retests. The Bitcoin market index also hasn’t yet played out its short divergence.
— Entry: $16 (market sell)
— Stop: $17.05 — 6.2% is the price movement from entry to stop, NOT the loss percentage.
— Target: $13.2
Risk per trade: 1% of total balance — this is the loss percentage.
Position size: 16% of total balance, leverage 10x
RR 1:2.75

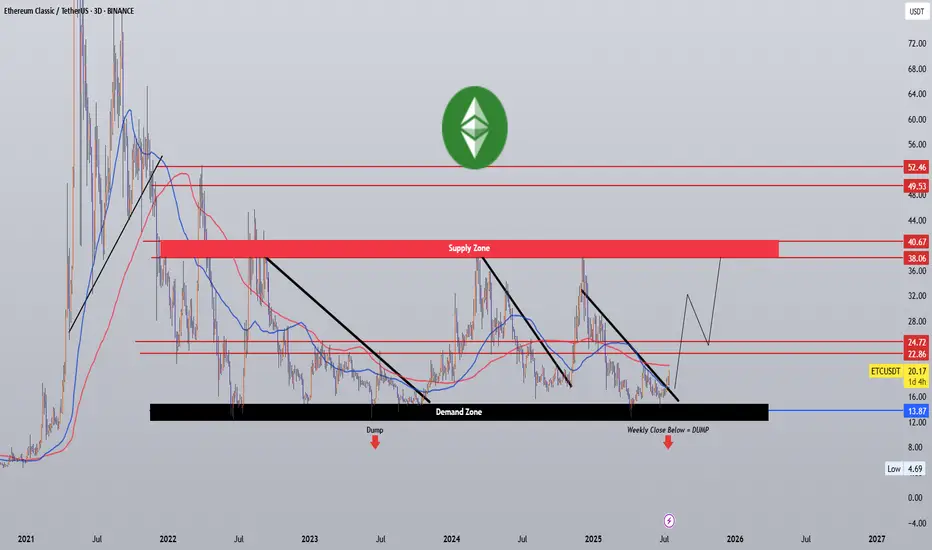
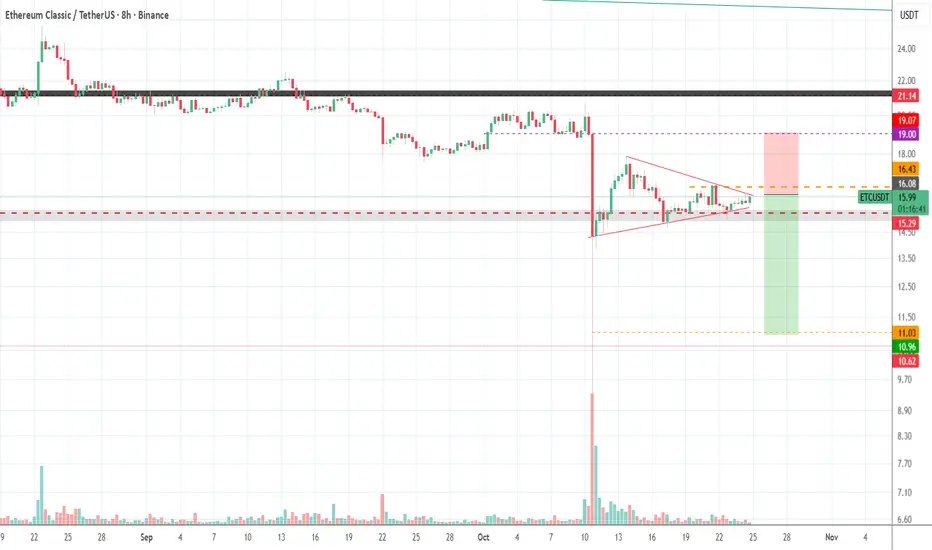
ETCUSDT — The Final Defense Zone Before a Major Move?Ethereum Classic (ETC) is once again standing at its final line of defense — the multi-year support zone between 16.40–13.50, which has successfully absorbed selling pressure several times since 2021.
This area is not just a price range; it’s a psychological stronghold that separates the potential for a massive rebound from the risk of a full-scale breakdown.
For more than three years, ETC has been forming a range-base accumulation structure, where every dip into this zone has triggered strong buying interest.
However, each rally has also failed to create higher highs — a clear signal that supply pressure remains dominant in the mid-term structure.
At this point, the market is in equilibrium — a tension zone between buyers defending the historical base and sellers pressing for continuation.
The next decisive move will be determined right here, inside the yellow block.
---
Bullish Scenario — Reclaim and Rally
If price holds above 16.40 and manages to close a weekly candle above 20.94 with strong buying volume, ETC could begin a structural reversal toward 24.95 and 36.85.
Such a move would confirm that the capitulation phase has ended and that a new accumulation cycle is underway.
Key confirmations:
Weekly close above 20.94
Higher low formed above 16.4
Rising weekly volume
Upside targets:
24.95 → 36.85 → 48.30
---
Bearish Scenario — Breakdown of the Base
Failure to defend the zone, especially with a weekly close below 13.50, would confirm a breakdown of the multi-year base.
This could trigger a new distribution phase, with potential downside targets at 11.00, 8.00, and possibly a wick toward 7.00 as liquidity gets swept.
Key confirmations:
Weekly close below 13.50
Failed retest (support turns to resistance)
Increasing sell volume
Downside targets:
11.20 → 8.00 → potential liquidity sweep near 7.00
---
Pattern Structure
Range Base Accumulation: multi-year accumulation between 13–36 since 2021.
Descending Structure: a series of lower highs, showing continuous supply pressure.
Liquidity Sweep: a deep wick to the 7.0 area indicates previous stop-hunts and possible smart-money accumulation.
Decision Point: 16.4–13.5 remains the make-or-break level that will define ETC’s long-term direction.
---
Conclusion
ETC is at a major decision point after years of sideways consolidation.
If the support holds, the asset could trigger a macro reversal and join the next major crypto bull cycle.
But if it breaks down, the fall could be steep — as liquidity below this zone is thin.
The 16.4–13.5 zone is the last line between hope and capitulation.
Watch the weekly close — that’s where the next big move will be decided.
---
#ETC #ETCUSDT #EthereumClassic #CryptoAnalysis #SwingTrading #TechnicalAnalysis #SupportResistance #WeeklyChart #CryptoBreakout #MarketStructure

ETC/USDT Short Set-upMultiple tests of the $15 support level, solid breakdown and consolidation below the 50/200 MA on the daily timeframe (trend reversal), lower highs, and the Bitcoin market index also failed to confirm the short divergence.
— Entry: $16.00 (market sell)
— Stop: $19.10
— Target: $11.00 ✅
Risk is 1% of the account balance RR 1:1,7
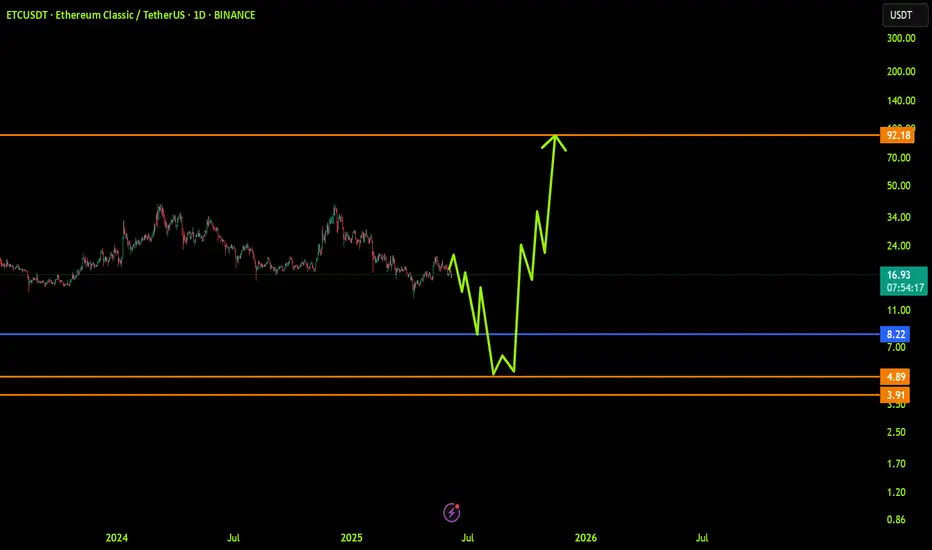
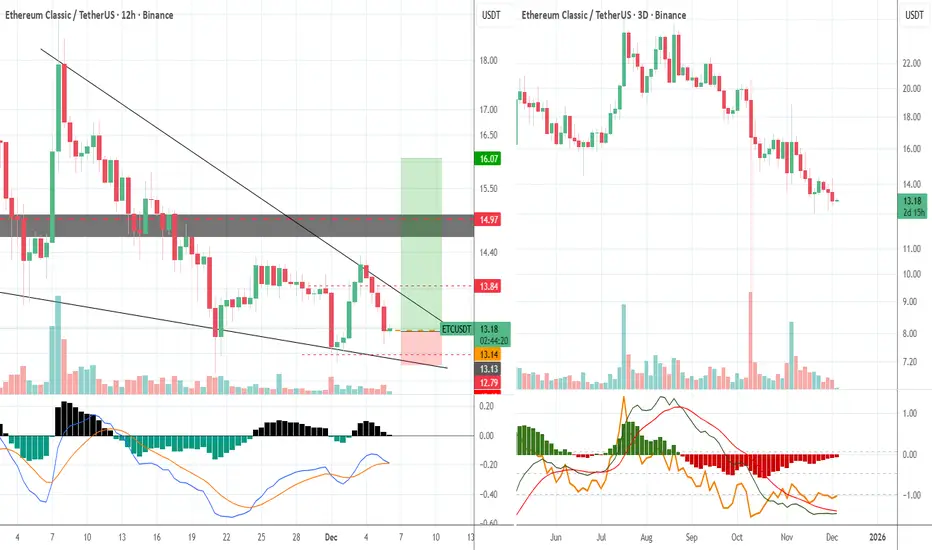
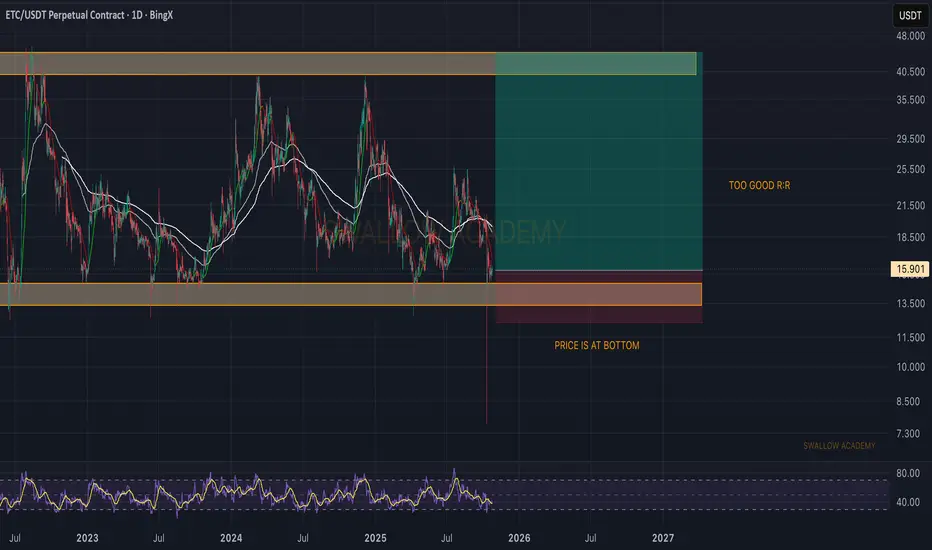
Ethereum Classic (ETC): Too Good of R:R Long Setup | Bullish AFETC has been moving inside a wide sideways channel for quite some time, and right now price is hovering near the lower support zone. The R:R setup here is too good to ignore — we’re sitting on a strong support where even a moderate bounce could offer solid upside potential.
As long as buyers keep defending this area, we expect a good upward reaction soon, potentially targeting the upper range of the channel.
Swallow Academy
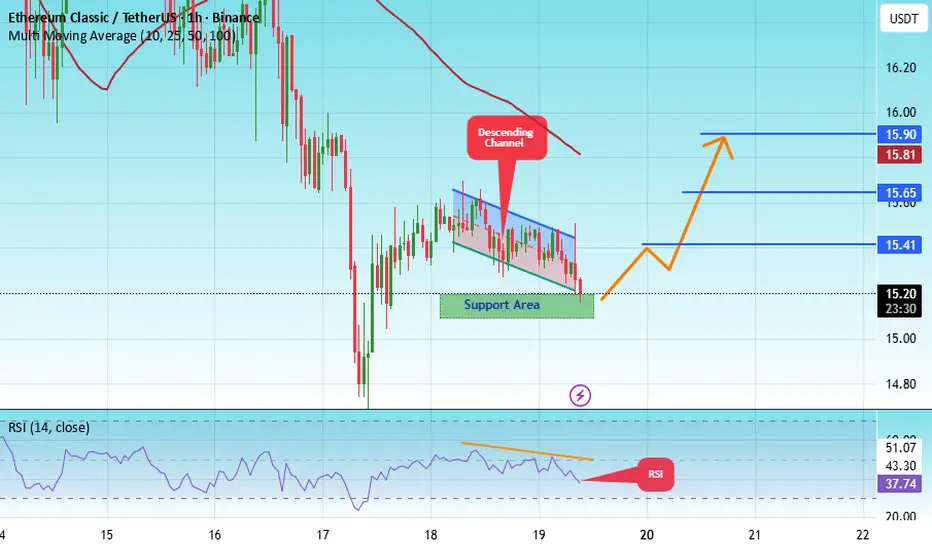
#ETC/USDT Might Be Good Zone to Bounce From#ETC
The price is moving within a descending channel on the 1-hour frame, adhering well to it, and is heading for a strong breakout and retest.
We have a bearish trend on the RSI indicator that is about to be broken and retested, which supports the upward breakout.
There is a major support area in green at 15.10, representing a strong support point.
We are heading for consolidation above the 100 moving average.
Entry price: 15.21
First target: 15.41
Second target: 15.65
Third target: 15.90
Don't forget a simple matter: capital management.
When you reach the first target, save some money and then change your stop-loss order to an entry order.
For inquiries, please leave a comment.
Thank you.
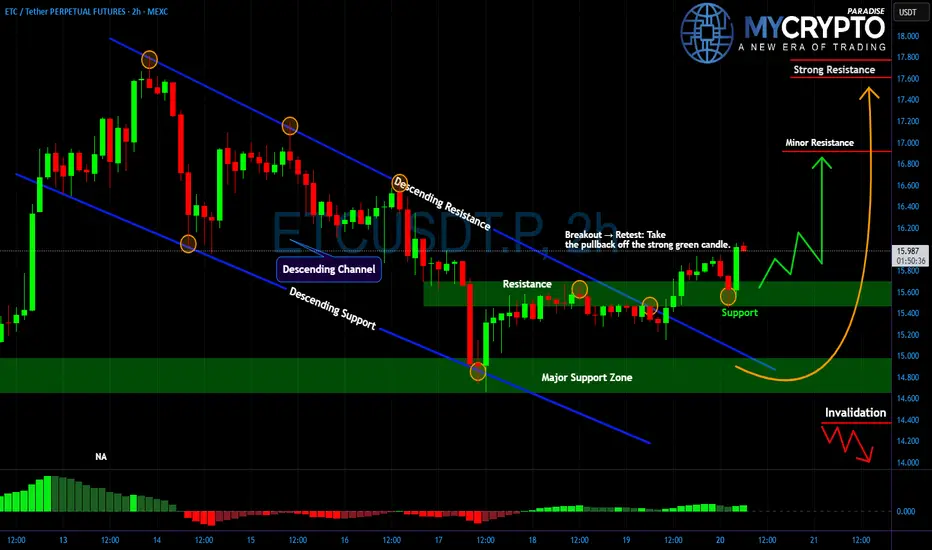
ETC Breakout Confirmed… But Will It Hold or Fake Out?Yello Paradisers, did you catch this clean breakout from the descending channel on ETCUSD just as we expected? If not, you might already be late to the first leg but the real move might still be ahead.
💎#ETCUSDT was trading inside a well-defined descending channel for days, respecting both trendline resistance and support beautifully. The market structure shifted when price broke above the upper boundary of this trend, followed by a textbook retest right at the $15.60 level turning former resistance into support.
💎This move was confirmed by a strong green bullish candle and an uptick in volume, hinting at momentum building up behind the bulls.
💎Currently, #ETC is holding above the key support zone $15.40–$15.80. If this zone holds firm, we expect the price to continue pushing toward the next resistance levels at $16.60 and $17.40. The $17.40 zone is especially important it marks a strong resistance that could either trigger a reversal or lead to an explosive breakout if flipped.
💎On the other hand, any clean breakdown below $15.40 followed by weakness would invalidate this bullish setup and likely drive price back to the $14.00 zone, so risk management is key.
Discipline, patience, robust strategies, and trading tactics are the only ways you can make it long-term in this market.
MyCryptoParadise
iFeel the success🌴
ETCUSDT: Trend in daily timeframeThe color levels are very accurate levels of support and resistance in different time frames, and we have to wait for their reaction in these areas.
So, Please pay special attention to the very accurate trend, colored levels, and you must know that SETUP is very sensitive.
Be careful
BEST
MT