ETHBTC Opportunity Buy: Major 2025 AltcoinSeason & Bull MarketThis is the big one and the good one. ETHBTC was bearish since December 2021 but this cycle finally came to an end in April this year. After the initial bullish breakout and higher low we can clearly see some bullish action developing; three consecutive weeks green. The bullish bias is now confirmed. It is still early.
We are looking at 200% potential. The "back to baseline" target. This is a price range where ETHBTC traded sideways as part of a distribution phase for more than two years. This is a must-to-be-tested resistance zone and thus opens up a sure 200% profits potential for this newly developing bullish wave.
Ethereum's ETFs are coming, Bitcoin already has its ETFs. This can mean Ethereum outperforming Bitcoin, and many altcoins, in so many ways. This also opens up the potential for a new all-time high on this pair.
The same sequence of 'low-higher low' happened in the last bull market. ETHBTC hit bottom in September 2019 then produced a higher low and this signaled the start of a major, long-term 447% rise. The conditions are similar now but the rise will be faster.
We have two main targets for the all-time high in late 2025 or early 2026.
1) 0.13207. With 442% profits potential from current price.
2) 0.20278. With 733% profits potential.
The entire bullish cycle for this pair can unravel within 4-6 months. If it becomes extended, it can last one year or longer. Both scenarios are possible.
It is 100% certain that ETHBTC will go on a major bullish cycle together with the rest of the altcoins market. Bitcoin will also grow.
Thanks a lot for your continued support.
If you are bullish on Crypto, comment below.
Namaste.
ETHBTC trade ideas

ETHBTC vs BTC.DEthereum / Bitcoin 📈 Bitcoin Dominance 📉
CRYPTOCAP:ETH / CRYPTOCAP:BTC vs. CRYPTOCAP:BTC.D

$ETHBTC top in for the year?ETHBTC looks to be topping here. I think we either see this resistance as a top or potentially a final move to the one directly above it, but I think this move is largely it for the year.
From here, we should see a move back down to the lower support levels to retest that region. Once that region has been retested I think the real bull run in ETH begins.
However, until then, it's hard to be bullish at resistance.

ETH vs BTC: Breaking a 3-Year DowntrendEthereum is attempting to break above its long-standing downtrend against Bitcoin for the first time since 2022. ETH strength vs BTC has historically preceded periods of altcoin outperformance.
This is an early signal, confirmation is still needed. Watching closely to see if ETH can sustain momentum here.
Educational chart only, not financial advice. Past performance ≠ future results.

ETHBTCETH pressing into ATH zone for the first time in 5 years
ETHBTC chart shows the possibility of a significant move against BTC by the end of the year.
Fundamental Adoption has spiked massively with ETF inflows matching BTC volumes, with eths market cap orders of magnitude smaller...
This translates to a potential and probable explosive move upwards potentially towards 10kusd zone on the USD chart.
That would look something like this on the BTC chart and seasonality suggests only 4months for this move to take place...
bullish times.

Long trade
🔹 Trade Parameters
Entry: 0.03044
Profit Target: 0.043964 (+43.93%)
Stop Loss: 0.03006 (−1.26%)
Risk-Reward Ratio (RR): 35.68
🔹 Trade Narrative
Execution followed a long accumulation phase where ETHBTC trended lower for months before showing a structural reversal.
Entry taken after a BOS (Break of Structure) and bullish displacement confirmed continuation higher.
Trade targets major imbalance zone above (0.0439), aligning with higher timeframe liquidity pools.
Tight stop placement just below the local higher low at 0.03006 ensured an asymmetric risk profile.
🔹 Market Context
ETHBTC has been in a macro downtrend, but the recent shift signals a potential multi-week accumulation breakout.
Key levels reclaimed:
0.03194 (TMO) acted as a demand zone.
0.03805 – 0.03893 provides intermediate liquidity resistance.
Final target aligns with macro resistance at 0.04396 – 0.05 zone.
Volume uptick confirms institutional order flow supporting reversal.

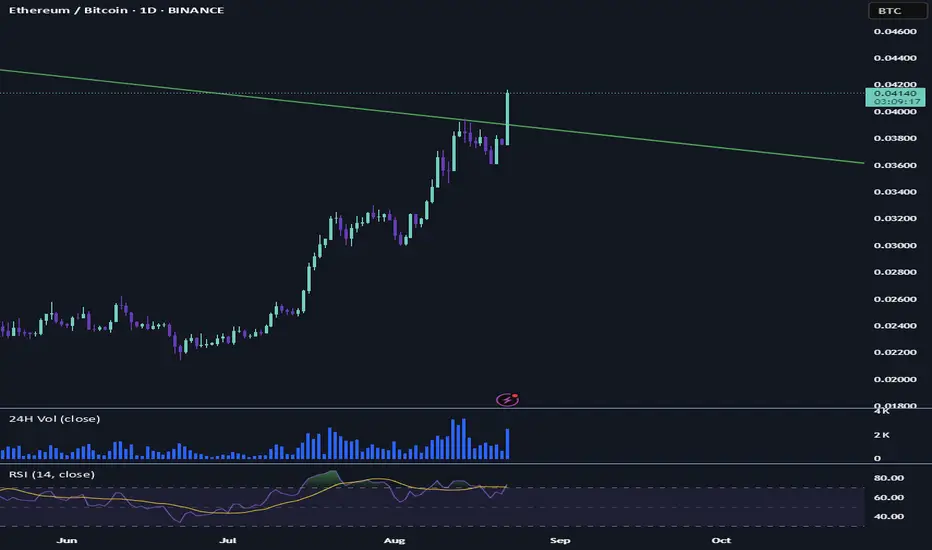
ETHBTC break of resistance from 2022! With todays push upwards BINANCE:ETHBTC finally broke the downward resistance since - get this - September 2022. This is huge IF it materializes. What do I mean?
In the daily and every other timeframe we can expect a continuation of some sort if the day closes above the resistance - which is in eth terms around 4800, but better - in ethbtc terms it means 0.0395 (it currently is at 0.041)
let's hope - even tho the september correction looms over our heads (or a potential one) a rally could go for the following week - and maybe even into the first week of september if everthing goes right.
vitalik rocket coming at u in a few monthsVitalik’s been struggling to get his rocket off the launchpad since 2021-22.
He’s practically begging for liftoff now, and it’s only a matter of time before his engine’s roaring again and his rocket blasts all over your face.

ETHUSDTHIGHER AND AGAIN HIGHER. There is just a thig which you have to keep in your mind that way just up. Decrease the grumble and focus on

ETHBTC IdeaAn idea for ETHBTC showing an increasing into a strong support then acting as the right side of an inverted H&S
If this chart rises it suggest Ethereum's dominance in comparison to Bitcoin
I think BTC funds are rotating from BTC right now to ETH and other alts

ethbtc [W] - 2019 shelf retest & long exit (April to Aug 25)So we've had a pretty eventful 2025 so far for eth . For most wanting to know why eth moves have been so aggressive and to quote an old mentor "Gung-Ho", all we need to do really is take a look at ETHBTC.
Historically alts have had their moments in relation to their strength (or weakness) against bitcoin. this time is no different.
To key my chart, the yellow lines show the point of control or gain/failure for any given local spot. the red and green bands are by extension a couple of points above or below that mark. These bands represent 'slippage' or liquidity points provided by either algo (standard deviations), stop losses and failure of trend.
To be fair the size of the band is relative to the volatility of the underlining pair. In this example i believe it should fall within the 3.2-->13.6% range. enough to liquidate or margin call all positions from 20x to 5x. This represents the majority of open interest in any given point.
My goal is always to observe the point of control and look to rebound from these initial liquidity hunts. April 2025 gave us this opportunity and cleared the bench. For those late to the party the market offered us a juicy little v-bottom setup. from there on you had exits all the way up to the liquidity band sitting just above the support shelf created all the way back in 2019.
By no means am I claiming the move is 100% done, but if you check volume, I'd say 80%+ has exited, and so am I.
NEXT: rotate back into BTC primarily and watch.
Sentiments not all that great in the real world, but at least this move has some definitive-ness to it. Peace out
#btc #eth #ethbtc #2025 #alt #mstr #goingup-goingup
Will Ethereum and Altcoins Continue to Grow?Hello friends
You see the Bitcoin to Ethereum chart.
You may be wondering what caused Ethereum to grow. I should tell you that this chart shows us what happened.
The price is in a downtrend, which indicates a money movement (from Bitcoin to Ethereum).
When you see that after 3 hits to support, the price has managed to break the support and the price has fallen and formed a downward channel, which could indicate that Ethereum's growth is continuing.
So now we have identified the support areas for you using Fibonacci, based on the price range that has formed.
The price is now at an important support area, as you can see, we had a bullish reaction when we hit the support area, but the price reversed due to the strength of the downtrend...
Now, if the support area breaks, the price can move lower to the specified targets.
Keep in mind that if the price grows, the upper support areas that were broken now become resistance and the price must be able to break them for our trend to be bullish, but as long as the price is down, the upward trend of Ethereum will continue and the upward trend of Ethereum will also make the altcoins bullish...
*Trade safely with us*


Ethereum lagging behind BTC - not for much longer ~ $21K ETHI have recently posted a ETH/USDT chart which indicates we will get a 13.8K eth target. The ETH/BTC chart is also looking strong for ETH, with a 3x on the cards, which would come out to around $21k USDT per ETH.
ETH vs BTC 2025 EuforiaWhen ETH rises, it is valued more than BTC.
When it falls, the BTC increases.
Generally, after the rise, it moves horizontally.

Period of ETH outperformance vs BTC is almost overWe got a clean five wave up structure that topped with a bang in April 25
This is from when ETH has been outperforming BTC nicely.
We can see a very clean corrective three wave decline labelled as A down, B up, C down
The ratio BTC vs ETH is approaching my Target 2.
What that chart tells us is that most likely the period of ETF outperformance against BTC is almost over.
That does not necessarily means that BTC should start a big rally. It is possible that both, BTC and ETH would decline. But that chart suggests that BTC would hold better in that case.

ETH/BTCOn 6 June 2025 we saw the 2D ETH/BTC 200 SMA golden cross the 450 DEMA. This was our first indicator that alt szn was upon us. Again, when the 50 EMA golden crosses the 450 DEMA the entire market should explode into the final rally of the cycle.

A return to major structure provides a =SELL opportunity ## 📊 ETH/BTC Analysis - 1H Chart
### 🏗️ Major Structure Breakdown
**1️⃣→3️⃣ Major Structure Push Down** 📉
- ⬇️ Downtrend established
- 💀 Buyers from 1️⃣ got absolutely REKT
- 🦈 Sellers at 2️⃣ = **"BIG BOSS"** of the chart
- 👑 These are our MAJOR SELLERS to watch
**3️⃣→6️⃣ Buyer Retest Rally** 📈
- 🐂 Buyers entered at 3️⃣
- 🎯 Return to 2️⃣ major sellers zone
- ❓ Key Question: Is price still too expensive at 2️⃣?
### 🔮 What I Think Happens Next
**🎯 Primary Scenario:**
- 📍 Return to major structure = bearish continuation likely
- 📉 Expecting move below 3️⃣
- 🔄 OR at least a double bottom retest of 3️⃣
### 🧮 Probability & Confluence Stack
**🍊 Chaos Theory Says:**
- 📊 57% chance to travel to zone below if we close below current zone
- 📈 Based on 2,500 previous bars of data
- ✅ Stats manually verified
**📉 Hidden Bearish Divergences:**
- 🔴 RSI = Hidden Bear
- 🔴 MFI = Hidden Bear
- 🔴 Accum/Dist = Hidden Bear
**🌡️ Oscillator Status:**
- ⚠️ RSI = Overbought
- ⚠️ MFI = Overbought
- 😴 Low volatility = More reliable signals
**🌊 Elliott Wave Count:**
- 5️⃣ Potentially at Wave 5
- ⚡ Incoming correction expected
- ⚠️ BUT... 5th wave could still extend up a bit (conflicting signal!)
**📊 Volume Profile:**
- 🎯 At major volume cluster (POC - Point of Control)
- 🛑 Should slow down price
- 🐻 IF sellers show interest here
### ✅ Bottom Line
**🔥 Pretty good SELL opportunity! 🔥**
### ⚠️ Trade Management
**❌ INVALIDATION:**
- 🚫 Trade cancelled if price closes above orange zone below
**🎯 Stop Order:**
- 📍 Set below the zone for automatic entry
- 🎰 Let probability play out

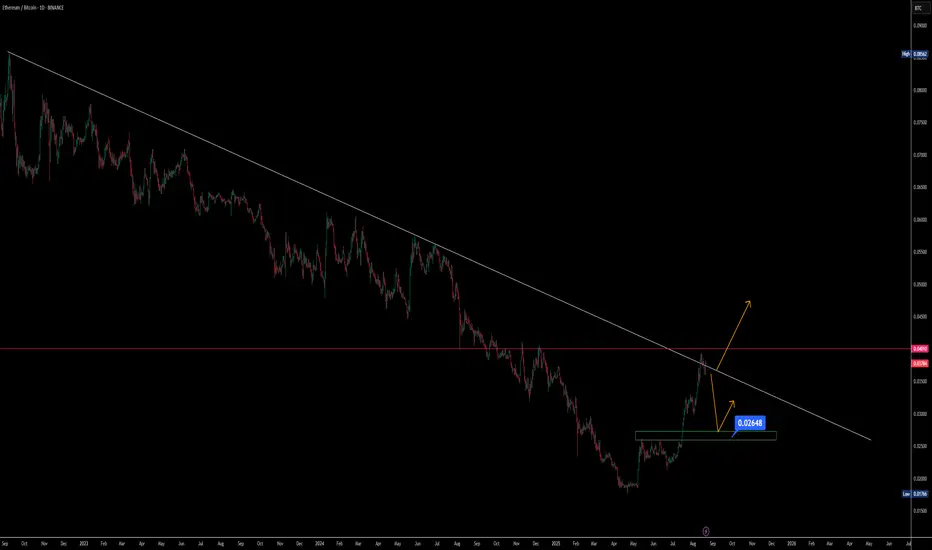
ETHBTC Approaching a Key Decision ZoneSince September 2022, ETHBTC has been in a persistent downtrend as macroeconomic conditions and US interest rate policies favored Bitcoin accumulation over Ethereum. Multiple attempts to break the descending trendline have failed, reflecting limited capital rotation into ETH while BTC remained the dominant asset. The situation began shifting after ETHBTC marked a bottom around April 24, 2025, followed by steady upward movement. This recovery has now brought the pair toward the important resistance region near 0.0378, where price is struggling to break the downtrend line.
If ETHBTC clears both the diagonal and horizontal resistance levels, particularly the 0.04 mark, the pair could see a strong upside continuation driven by renewed momentum. However, recent signals from the FOMC and visible ETF outflows from ETH holdings, alongside fading Bitcoin demand, create uncertainty about immediate bullish continuation. On the downside, if resistance holds, price may revisit the Fibonacci 0.618 retracement zone near 0.02648, often considered a golden pocket that could provide a strong base for the next leg higher.
At present, ETHBTC is in a decisive area where traders should wait for confirmation. A breakout above 0.04 opens the path for bullish momentum, while a correction toward 0.02648 could offer another accumulation opportunity. Until either scenario is confirmed, maintaining patience and avoiding premature entries may be the more prudent approach.
eth outperform btc time? or will it stay being a just for fun $eth outperform btc time?
or will eth stay being a just for fun coin?
let us know!
free transparent no edit no delete
🐉We value full transparency. All wins and fails fully publicized, zero edit, zero delete, zero fakes.🐉
🐉Check out our socials for some nice insights.🐉
information created and published doesn't constitute investment advice!
NOT financial advice

ETH VS BTCHi there!
What to hold BTC or ETH?
High probability correction is coming!
There is another scenario too because EW is relative E=mc2 :-)

4H iHS for 1DHL?if 0.036 holds this could be a inverted head and shoulder in the 4 hour chart.
the 1 day timeframe showed some support at its ema12.
if the 4 hour chart starts a uptrend this could indicate a possible higher low in the daily timeframe.

ETH : BTC [Ethereum is making history]Ethereum vs Bitcoin Finally Breaks 365-Day Moving Average Strongly
The Breakdown of This Moving Average Had Previously Caused Explosive Growth
