$ETHBTC: Weekly trend turning bullish again...Good afternoon lads,
Ethereum vs Bitcoin is now bullish in the short and mid term and can trigger a monthly timeframe trend soon if strength persists in the coming month.
Sentiment had reached the depths of hell by Friday Nov 21st, when I was at the Devconnect event, chatting with traders and peop
Related coins
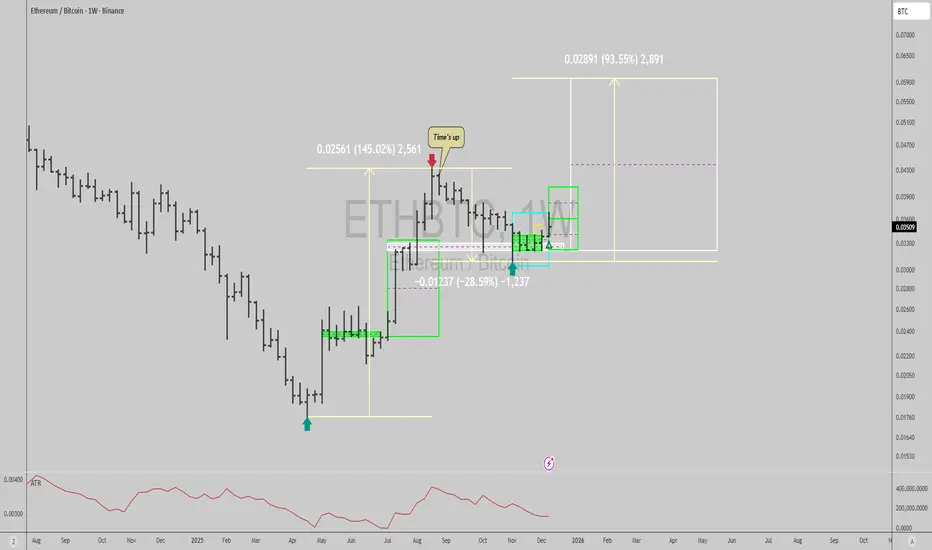
ETHBTC - HTF 3 Wave Buildup + Key Support & ResistanceMost important chart in crypto right now.
Be positioned before 0.043
Buy any dips after the Santa Rally down to current resistance 0.037
Distribute/TP within the shaded box area
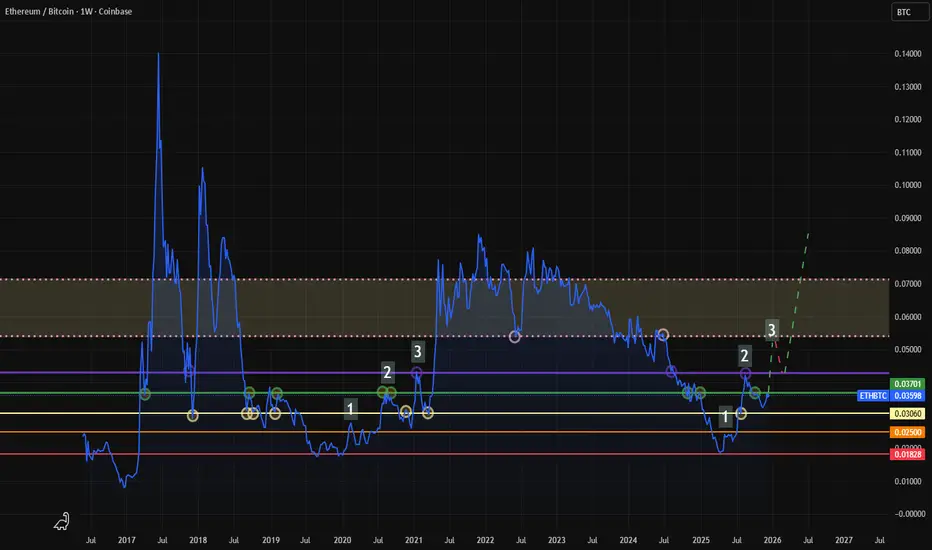
Ehtereum/Btc chart and timing for altseasonPotential targets in theory by timing (May 2026) end of altseason and top in BITSTAMP:ETHBTC pair for Ethereum
I don't think we will reach level of May or Dec 2021
Targets more conservative without any idea of supercycle for altcoins
We retested and hold the line around Point of control by volu

ETH/BTC MULTI MONTH HIDDEN BULLISH DIVERGENCEETH could be gearing up for continued outperformance against BTC. This with BTC.D set to decline, gives the bulls ammo to push alts higher.

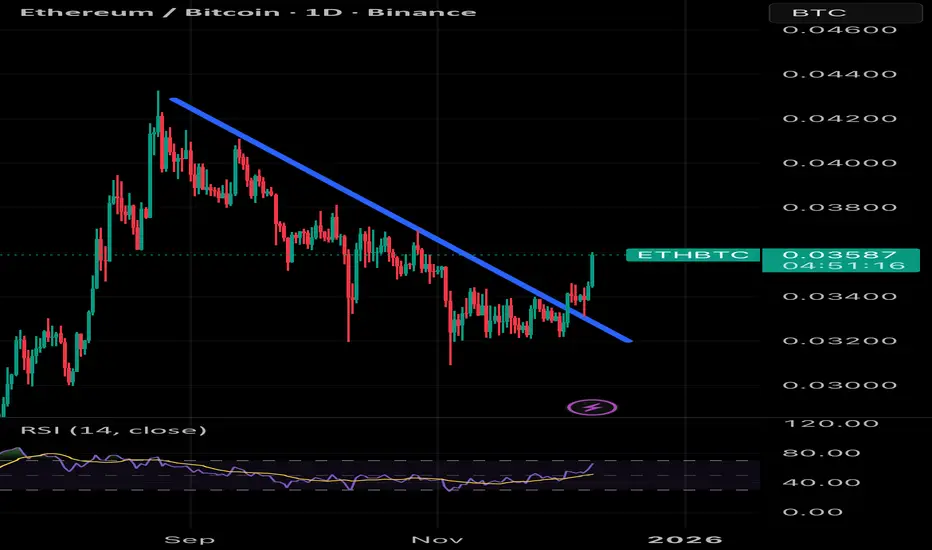
$ETH / $BTC Breakout on Daily TimeframeETH/BTC has appeared to breakout on the daily timeframe, with a successful backtest and continuation higher. This is a great sign for alts in general, but remaining cautious with all the volatility that comes with FOMC decisions. Would like to see this hold and have a strong weekly close to give a c
Altcoins Get a Boost as ETH/BTC Breaks StructureETH/BTC breaking out of the falling wedge is a positive sign for the altcoin market.
When this pair starts gaining strength, it usually boosts overall altcoin performance.
If ETH holds this breakout, it could ignite a broader altcoin rotation in the coming sessions.
DYOR, NFA
#PEACE
Please hit

ETH/BTC – Weekly Fractal Repeating the 2020 SetupThe chart currently shows a highly similar structure to the Ethereum/Bitcoin weekly pattern from late 2020, right before the major altcoin season.
2020 Pattern Recap
• A clear S9 Buy signal triggered on 16 Nov 2020
• Price broke above the red Ichimoku cloud, confirming a major trend shift
• A retra

ETH vs BTC- Sometimes when we look at markets, we get confused by all the noise, Trump and governments news, ETFs, FED, bans, SEC, FUD, FOMO, fake stories, and more.
- As a trader, you must always step back from news, view the trend from a distance, and filter out that noise.
------------------------------

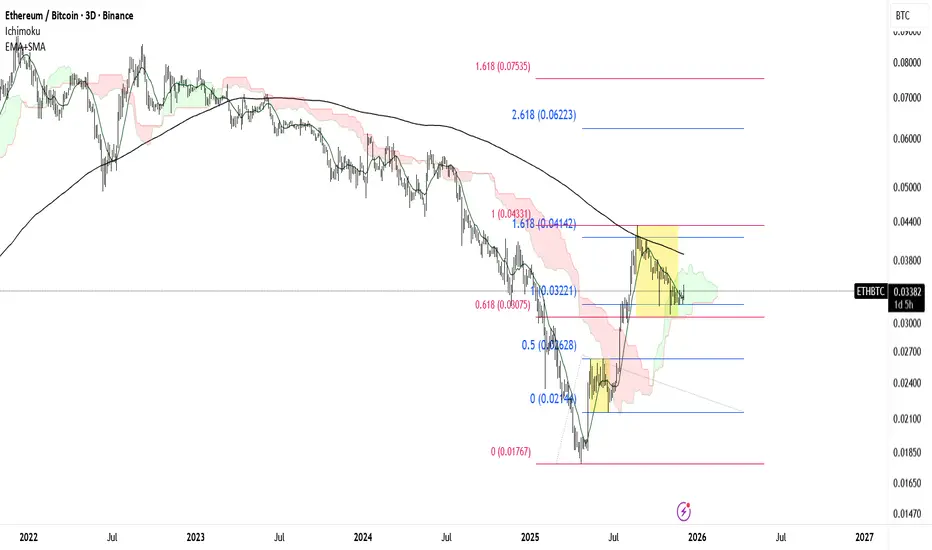
ETH/BTC on the Edge of a Macro BreakoutIt appears that #Ethereum is on the verge of its next major bullish leg.
The 3 day 237 SMA has acted as a key structural resistance, and #ETHBTC has now completed its retracement into the 0.618 Fibonacci zone a level I consider the end of the corrective phase.
A clean breakout above the 237 SMA woul
the rise of eth.good eve'
i bring you this really clean chart today.
ethereum divided by bitcoin.
historically, after bitcoins run, money begins to rotate into ethereum, and then into alt coins.
i believe we are at the edge of what could be a pretty solid run in the ethereum ecosystem,
especially since the fusak

See all ideas
Summarizing what the indicators are suggesting.
Oscillators
Neutral
SellBuy
Strong sellStrong buy
Strong sellSellNeutralBuyStrong buy
Oscillators
Neutral
SellBuy
Strong sellStrong buy
Strong sellSellNeutralBuyStrong buy
Summary
Neutral
SellBuy
Strong sellStrong buy
Strong sellSellNeutralBuyStrong buy
Summary
Neutral
SellBuy
Strong sellStrong buy
Strong sellSellNeutralBuyStrong buy
Summary
Neutral
SellBuy
Strong sellStrong buy
Strong sellSellNeutralBuyStrong buy
Moving Averages
Neutral
SellBuy
Strong sellStrong buy
Strong sellSellNeutralBuyStrong buy
Moving Averages
Neutral
SellBuy
Strong sellStrong buy
Strong sellSellNeutralBuyStrong buy
Displays a symbol's price movements over previous years to identify recurring trends.