Ethereum could once again outperform BTCFrom a technical perspective, the ETH/BTC ratio appears ready to resume its upward movement after several weeks of consolidation. Both timeframes — daily and weekly — point to a bullish scenario for Ethereum against Bitcoin.
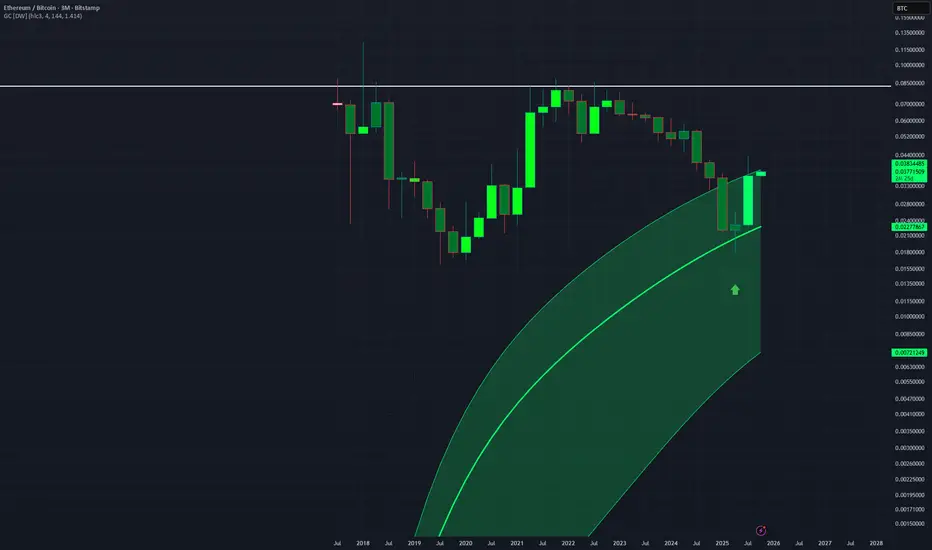
On the daily chart, the ratio is trading in an uptrend established since spring. The three green arrows mark successive rebounds on a solid ascending trendline. The next touchpoint, in November 2025, could show a precise rebound on this dynamic support, accompanied by a stabilization of momentum indicators (RSI and MACD). This setup suggests that the recent correction may be merely a pause before a new bullish impulse. As long as the ratio stays above 0.030 BTC, the structure remains constructive.
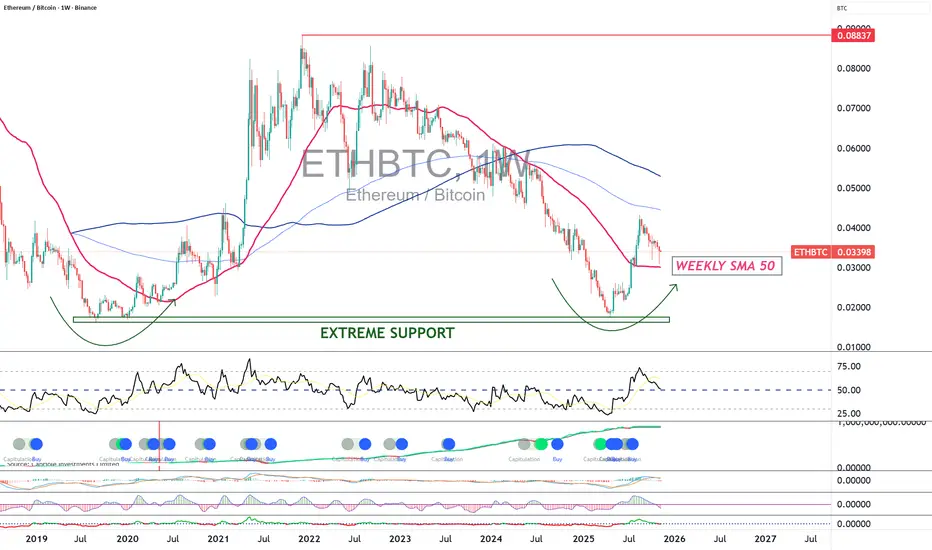
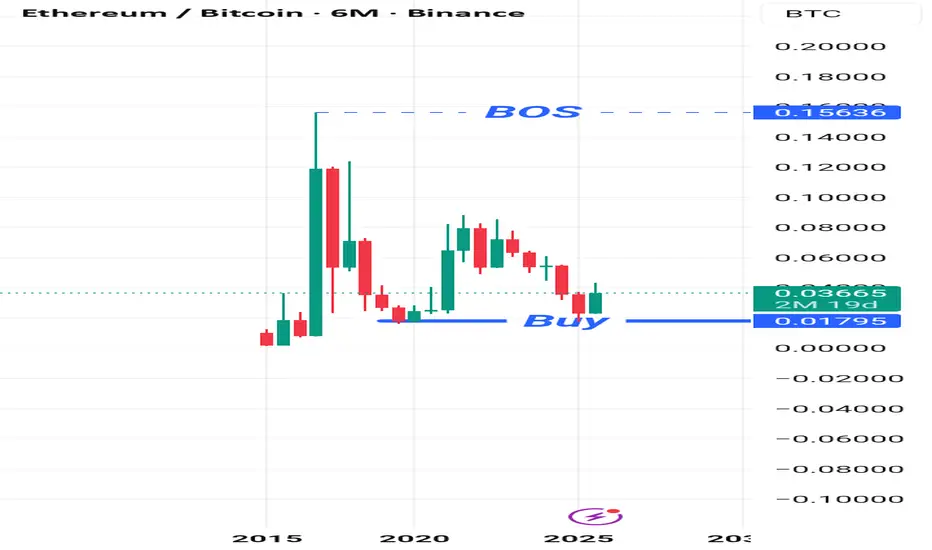
On the weekly chart, the long-term perspective reinforces this scenario. The ratio has formed a broad “cup” pattern, supported by an area identified as “Extreme Support” around 0.020 BTC. After several years of decline, Ethereum has regained relative positive momentum versus Bitcoin. A break above the 50-week moving average, followed by an orderly consolidation phase, could precede a new bullish extension toward the 0.045–0.05 BTC zone, or even higher in the medium term. Historically, every rebound from this support zone has been accompanied by a marked outperformance of ETH versus BTC.
ETF flows support the momentum
On-chain analysis and capital flows also reinforce this scenario. The chart of Ethereum spot ETF inflows and outflows shows a return of significant positive flows since mid-2025. After a period of net outflows during the summer, the trend has stabilized, reflecting renewed institutional interest. Historically, such inflows often precede sustained price increases for ETH.
In a context where Ethereum spot ETFs gain adoption and institutional demand grows, fundamentals support a recovery of the ETH/BTC ratio. If the current zone confirms its role as a floor, Ethereum could enter a new phase of outperformance versus Bitcoin in the coming weeks, supported both by technical structure and market flows.
DISCLAIMER:
This content is intended for individuals who are familiar with financial markets and instruments and is for information purposes only. The presented idea (including market commentary, market data and observations) is not a work product of any research department of Swissquote or its affiliates. This material is intended to highlight market action and does not constitute investment, legal or tax advice. If you are a retail investor or lack experience in trading complex financial products, it is advisable to seek professional advice from licensed advisor before making any financial decisions.
This content is not intended to manipulate the market or encourage any specific financial behavior.
Swissquote makes no representation or warranty as to the quality, completeness, accuracy, comprehensiveness or non-infringement of such content. The views expressed are those of the consultant and are provided for educational purposes only. Any information provided relating to a product or market should not be construed as recommending an investment strategy or transaction. Past performance is not a guarantee of future results.
Swissquote and its employees and representatives shall in no event be held liable for any damages or losses arising directly or indirectly from decisions made on the basis of this content.
The use of any third-party brands or trademarks is for information only and does not imply endorsement by Swissquote, or that the trademark owner has authorised Swissquote to promote its products or services.
Swissquote is the marketing brand for the activities of Swissquote Bank Ltd (Switzerland) regulated by FINMA, Swissquote Capital Markets Limited regulated by CySEC (Cyprus), Swissquote Bank Europe SA (Luxembourg) regulated by the CSSF, Swissquote Ltd (UK) regulated by the FCA, Swissquote Financial Services (Malta) Ltd regulated by the Malta Financial Services Authority, Swissquote MEA Ltd. (UAE) regulated by the Dubai Financial Services Authority, Swissquote Pte Ltd (Singapore) regulated by the Monetary Authority of Singapore, Swissquote Asia Limited (Hong Kong) licensed by the Hong Kong Securities and Futures Commission (SFC) and Swissquote South Africa (Pty) Ltd supervised by the FSCA.
Products and services of Swissquote are only intended for those permitted to receive them under local law.
All investments carry a degree of risk. The risk of loss in trading or holding financial instruments can be substantial. The value of financial instruments, including but not limited to stocks, bonds, cryptocurrencies, and other assets, can fluctuate both upwards and downwards. There is a significant risk of financial loss when buying, selling, holding, staking, or investing in these instruments. SQBE makes no recommendations regarding any specific investment, transaction, or the use of any particular investment strategy.
CFDs are complex instruments and come with a high risk of losing money rapidly due to leverage. The vast majority of retail client accounts suffer capital losses when trading in CFDs. You should consider whether you understand how CFDs work and whether you can afford to take the high risk of losing your money.
Digital Assets are unregulated in most countries and consumer protection rules may not apply. As highly volatile speculative investments, Digital Assets are not suitable for investors without a high-risk tolerance. Make sure you understand each Digital Asset before you trade.
Cryptocurrencies are not considered legal tender in some jurisdictions and are subject to regulatory uncertainties.
The use of Internet-based systems can involve high risks, including, but not limited to, fraud, cyber-attacks, network and communication failures, as well as identity theft and phishing attacks related to crypto-assets.
Trade ideas
ETH / BTC - 3 rising valleysNice 3 rising valleys here on ETH / BTC with the usdt pair putting in a daily 3 bar play. If Ethereum starts to run here on the pair, that would be a positive sign for risk, and another piece of the puzzle for an "alt season". Usually leading patterns like this have a little trickery to them before they reach escape velocity, usually in volatility, which could present another opening for entry in the coming days.


ETH/BTC – Weekly Fractal Repeating the 2020 SetupThe chart currently shows a highly similar structure to the Ethereum/Bitcoin weekly pattern from late 2020, right before the major altcoin season.
2020 Pattern Recap
• A clear S9 Buy signal triggered on 16 Nov 2020
• Price broke above the red Ichimoku cloud, confirming a major trend shift
• A retrace into support followed in December
• Momentum flipped bullish and ETH/BTC accelerated into a multi-month rally
• Strong continuation after retest → Last major altseason (Q1–Q2 2021)
2025 Current Structure
• A new S9 Buy signal triggered on 10 Nov 2025
• ETH/BTC has broken above the red Ichimoku cloud, signaling potential trend reversal
• Market is currently in the first retracement, same as in Dec 2020
• Weekly structure shows higher low formation + early momentum shift
• If the fractal continues, the next move historically was a strong vertical expansion phase
• Major resistance zones above align with long-term equilibrium levels
Key Idea
The ETH/BTC pair is replicating the same sequence:
S9 → Cloud Breakout → Retrace → Expansion → Altseason
If the fractal holds, ETH dominance expansion could follow into 2026, just like 2021.

Potential ETH rallyWith a clear break and retest of weekly trend line.
A possible potential wave C or wave 3 rally
We might be heading for a strong bull move across all alt coins

ETH/BTC Capital Rotation: Altseason Exhaustion ETH/BTC is losing strength below the 0.039–0.040 equilibrium, signaling capital rotation back into BTC.
Structure remains bearish while price holds under 0.041, with downside targets at 0.030–0.025.
This aligns with BTC’s drive toward 116K–126K where alts lag before the macro top.
Watch for reversal signs on alts only once this lower zone is filled.

ETH/BTCHere is the range I'm looking at for the ETH/BTC pair. A bounce in this box means buying Ethereum will be more profitable than Bitcoin.

#ETH_BTC (Large Cap Confidence relatively to #BTC)#ETH/BTC
In Next 2 to 3 months this Analysis must work. We can predict a start of a Altcoin Season in December 2025.

Short trade
📘 Trade Journal Entry
Pair: ETHBTC
Direction: Sell-Side Trade
Date: Thu 30 Oct 25
Time: 12:00 pm
Session: NY Session PM
Timeframe: 1 Hour
🔹 Trade Details
Metric Value
Entry 0.03498
Profit Level (TP) 0.031992 (+ 8.75 %)
Stop Level (SL) 0.03523 (– 0.71 %)
Risk–Reward (RR) 12.24 R
🔸 Technical Context
Wyckoff Structure:
ETHBTC remains in Phase E, completing distribution and entering the markdown sequence.
The pair broke consolidation support following repeated up-thrusts (UTAD) at premium pricing.
Market Structure Shift:
CHOCH confirmed bearish control after rejection from resistance (0.0359–0.0362).
BOS validated breakdown continuation toward the 4 hr FVG (0.0337 – 0.0333).
Phase E now marked by consistent lower highs and liquidity draws below structural lows.
Liquidity Targets / Zones:
Primary Target: 0.0319 (4 hr FVG + order block confluence).
Extended Objective: 0.0300 — deep demand and liquidity resting zone.
Resistance Zone: 0.0359 – 0.0362 (previous supply area).
Volume Profile:
Increasing sell-side volume through breakdown candle; institutional participation confirmed by accelerated momentum at liquidity breach.
🔹 Narrative & Bias
Following weeks of compressed distribution, ETHBTC finally confirmed bearish continuation through Phase E progression. The setup aligns with BTC dominance re-expansion and risk rotation away from ETH as capital flows toward Bitcoin safe-haven liquidity.
Sentiment Context:
Macro: Altcoin weakness amid USD resilience and broader market risk aversion.
On-Chain: ETH exchange inflows rising → evidence of distribution.
Technical: Repeated failures to reclaim resistance zone confirmed bearish supply control.
Projection:
Price expected to extend toward 0.0320 and potentially 0.0300 as the final liquidity objectives beneath September lows are met. Any re-accumulation likely to form only after a full mitigation of the FVG zone (0.0331 – 0.0319).

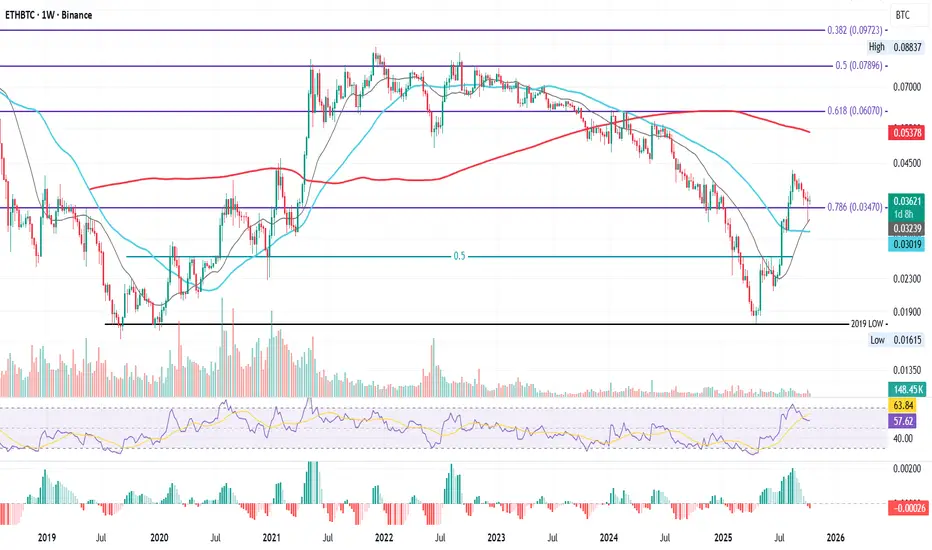
ETHBTC Weekly Series – Tracking the Shift, Week by WeekETHBTC Weekly – Confluence at the 0.786 Fib
This is ETHBTC on the weekly, now retesting one of the most important Fibonacci levels on the chart: the 0.786 Fib at 0.03470.
This time, price isn’t testing it alone. Just below, we have the 21-week MA and 50-week MA, both providing strong confluence. Last week’s flash crash on October 10th already tagged the 21-week MA, showing how reactive this area is for buyers.
This zone could serve as a structural base for a potential bounce toward higher resistance: such as the 200-week MA, or Fibonacci levels around 0.06–0.07. But for any of that to happen, price must hold here first.
That’s why, starting this week, I’ll be tracking this pair closely and updating this idea regularly, to better understand whether ETH can regain strength against BTC, and what that means for the altcoin market as a whole.
Because as history has shown:
when ETHBTC climbs, altcoins breathe again.
Right now, most alts look bruised after the flash crash, but some, especially those with real-world use cases, still hold long-term promise.
The key is timing.
And timing starts with ETHBTC holding this level.
Bias:
Neutral–bullish, strong confluence support, but confirmation needed through weekly close above 0.0347.
Always take profits and manage risk.
Interaction is welcome.
Ethereum is deciding where it wants to live.This is not a trade idea, this is a long term concept, most of my portfolio is swing when bull market comes (monthly/yearly) not trade (daily/weekly).
This is a solid question that will have to be played out in the upcoming years, Ethereum keeps changing its monetary policy and right now has less supply increase than BTC (due to burning mechanisms), will that stay forever? What will happen in the future to the policy? What it will mean for price?
Right now we can clearly see this is a bull case for future months.

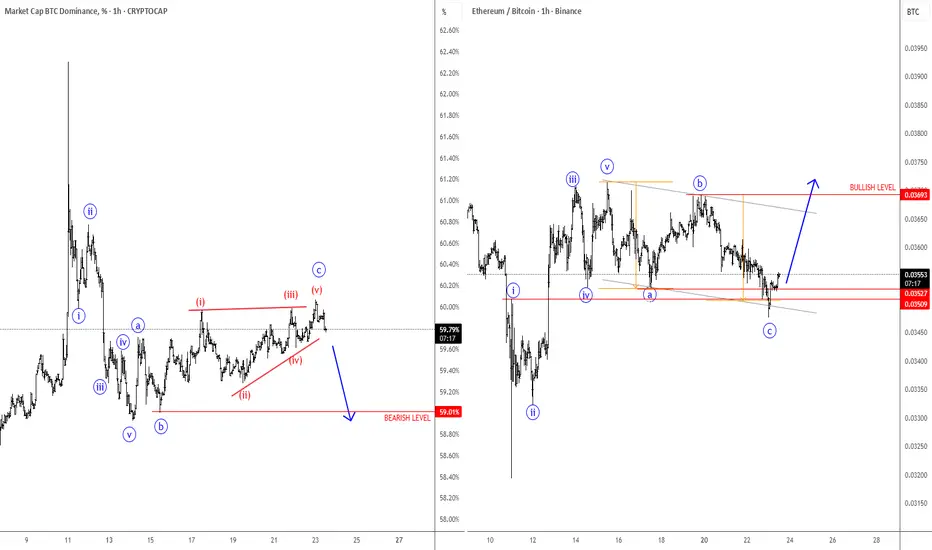
BTC Dominance Is Pointing Lower, While ETHBTC HigherBTC.Dominance chart made an impulsive five-wave decline, which confirms a bearish reversal. Currently, it still appears to be completing wave “c” of an abc correction, which could be forming a potential wedge pattern before further weakness.
As a result, after a five-wave rally on ETHBTC, which confirms a bullish reversal, it might also be finishing wave “c” of an abc flat correction, potentially finding support around the 0.034 area before another rally.
Overall, it seems that Ethereum and ALTcoins will continue to outperform Bitcoin, but a true ALTseason may only emerge if Bitcoin and the whole Crypto market experience a stronger recovery.
ETHBTC Rally into Q4📊 Ethereum vs Bitcoin (ETH/BTC) – Weekly Chart Update
ETH/BTC has officially broken out of its long-term downtrend (yellow trendline) that’s been in play since 2022. After the breakout, price is now retesting the previous resistance area — a classic move before potential continuation.
🔹 Key Levels to Watch:
Resistance Zone: 0.059–0.063 BTC (Fibonacci 1.272–1.414 extension zone, highlighted in yellow)
Major Target: 0.067 BTC (Fib 1.618)
Support: 0.033–0.035 BTC
Long-term support: 0.024 BTC
A successful hold above the breakout zone could confirm a trend reversal in favor of Ethereum dominance. A rejection, however, might lead to another leg down before accumulation.
🚀 Will ETH finally regain strength vs BTC, or is this just a relief rally?
#ETHBTC #Ethereum #Bitcoin #CryptoTrading #TechnicalAnalysis #AltcoinSeason #CryptoChart

ETHBTC. Is it almost altseason for Ethereum?Good afternoon, dear traders.
Here is the situation with the ethbtc pair. According to my observations, the altseason for a particular coin occurs when that coin rises in relation not to the dollar, but specifically to Bitcoin.
Here we see the following:
after a strong impulse, the price corrected to the 61.8 Fibonacci level.
An ascending flag is forming, or, as I like to call it, an impulse-correction-impulse formation.
To find the entry point for this pattern, you need to find a double bottom or an inverted head and shoulders in a corrective trend (in this case, a downward trend). Confirmation is the price consolidation above the 0.3850 level.
The target is the 1.618 level and above, which are also historical resistance levels on ethbtc.
What do you think? I'm interested to hear your opinion.

ETH is greater than BTCBitcoins value as of right now is greater than Eth but Eth is the one in the uptrend against Bitcoin. My money is on ETH over Bitcoin but who says you can't have both.
ETH/BTC ALT season ideaFirst time publishing.
So, plain as it is. End of April 2025 ETH/BTC pair manages to bottom out to a level near to December 2019.
Significant level because this set the foundation for our dear and beloved altseason that blowed 6-8 months later.
BTC dominance peaked around 70 some %, ETH/BTC bottomed out and entered oversold territory.
We see quite some similarities here. Although, heres the thing, it cannot be the same. Crypto cap was significantly lower then, there are at least x1000 new pairs, so we will like not see BTC coming to nearly this % of dominance, and the story may unfold diffefently because of the ETFs that poured significant ammount of assets into BTC that will most likely not rotate into ETH and alts.
Bottom line, and what I await.
ETH/BTC lair makes strong push and closes 1 high. Monthly chart have left sweet FVG area to be filled, maybe during new years santa claus effect? Who knows, but the timing correlates.
My idea --- wait ETH/BTC higher low to form and look for possible RSI divergence that may confirm this theory unfolding until end of December.
I posted to simply get any feedbacj possibly regarding this corelation.
Thank you!
Either way, I am in no way in a position to provide financial advise, so DYOR before investing or trading your money.

eth\btcThe Ethereum / Bitcoin pair is showing a pattern quite similar to that seen in 2019.
The price received a strong reaction from the demand zone and is currently in a falling trend retest process.
If it manages to stay above this zone, the first target will be the mid-level supply zone, followed by the major supply zone (0.08 BTC).

ETH/BTC (1W)ETH/BTC (1W)
ETH/BTC is turning previous resistance into new support on the weekly timeframe.

ETHBTC - Strong 3Month ReversalETHBTC has found its footing on the middle of this Gaussian Channel indicator.
From here likely it will continue to a top at the white horizontal line.
hopefully like 0.08
Very bullish on ETHUSD and altcoins
Long trade
📌 Trade Journal Entry – ETHBTC
🔻 First Trade (Sell-side)
Date/Time: Thursday, 25th Sept 2025 – 4:00 PM
Session: LND to NY PM
Entry: 0.037180
Profit Level (TP): 0.03003 (+19.23%)
Stop Level (SL): 0.037644 (-1.24%)
RR: 15.54
Outcome:
Trade closed on Friday, 26th Sept 2025 at 9:30 AM
Final TP: 0.03615 (+2.77%)
Final RR: 2.24
🔹 Second Trade (Buyside)
Date/Time: Friday, 26th Sept 2025 – 9:30 AM
Session: LND to NY AM
Entry: 0.03628
Profit Level (TP): 0.03741 (+3.11%)
Stop Level (SL): 0.03599 (-0.80%)
RR: 3.9
📊 Technical Structure
Consolidation Phase: Observed before the breakdown, with a range of 0.03539–0.03516.
Phase E Regression: Market transitioned from Phase D bottoming into a Phase E decline, characterised by lower highs. MSBs: Multiple market structure breaks confirm downside momentum before a potential reversal.
Demand Zone (4hr TF): 0.03611 – 0.03660 acted as the buyside support where a bullish response was initiated. FVGs: Noted along retracement path; price filled gaps before continuation.
🏦 Narrative
Sell-side Play: The first short capitalised on ETHBTC weakness, but the closure collapsed to a more modest 2.24 as profit, which led to the assumption of Buyside Recovery:
A clean demand zone (4hr TF) tap allowed for a reversal entry and upside aligned with order flow and EMA/WMA support.
Overall: This trade sequence shows an effective switch from distribution to the accumulation phase and Wyckoff alignment.

Short trade
Pair: ETH/BTC
Direction: Sell-side trade
Date: Tuesday, 23rd September 2025
Session: LDN to Tokyo Session PM
Entry: 0.037818
Profit Level (TP): 0.030306 (-19.26%)
Stop Level (SL): 0.038284 (-1.24%)
Risk-Reward (RR): 15.57
Wyckoff Narrative
Distribution Phase: Price exhibited signs of distribution after a prolonged uptrend, consolidating beneath resistance and forming supply at premium levels.
Upthrust After Distribution (UTAD): A liquidity grab above prior highs was observed, trapping late buyers before the market reversed downward.
Change of Character (ChoCH): The break below the consolidation range confirmed a bearish bias, shifting the market structure into markdown.
Phase D–E Progression: Price is transitioning from Phase D into Phase E, characterised by lower highs, lower lows, and confirmed supply dominance.
Target: Drawdown into deeper demand zones, consistent with Wyckoff markdown objectives and liquidity resting beneath prior lows.

ETHBTC LongThe BAT harmonic pattern suggests a promising upward trajectory for ETHBTC. This pattern begins at the $0.39 level, aligning with the critical 0.886 Fibonacci retracement level. From here, the price is anticipated to climb, with potential target points identified at TP1 and TP2.

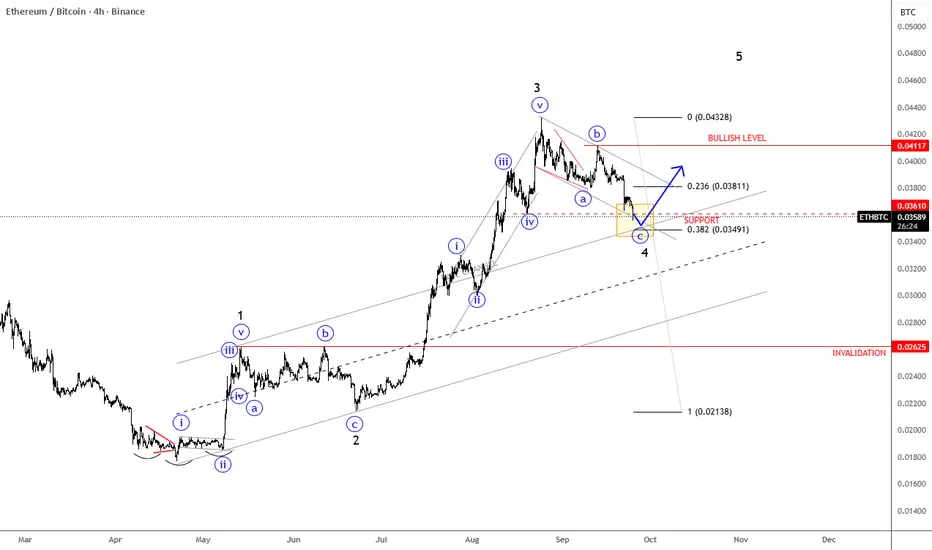
ETHBTC Has A TextBook Bullish PatternETHBTC Has A TextBook Bullish Pattern, as we see an ongoing five-wave bullish impulse by Elliott Wave model
ETHBTC pair is slowed down after a massive extension higher into wave 3, and it's right now testing important 0.035 - 0.034 support zone within an abc correction for wave 4. It's also trading at an important 38,2% Fibonacci retracement and base channel upper line, which can act as a strong support. So soon watch out for a bullish continuation within wave 5, especially if we see a rebound and recovery back above channel resistance line near 0.038 level. Bullish confirmation is above 0.041 level, while the invalidation level is at 0.026.