Euro FX Playbook: Key Levels That Will Decide the Next Leg1. Macro overview
The broader narrative driving the dollar and Euro FX in the past quarter has been centered on shifting Federal Reserve expectations and the market’s evolving outlook on global growth. The dollar has remained firm as traders continue to balance softer inflation prints against persistent uncertainty around the timing and magnitude of future rate adjustments. While inflation has moderated, the market has not fully embraced a clear easing cycle, which has kept the dollar supported during periods of risk aversion.
For Euro FX, this environment has created a backdrop where price action has been more about relative policy expectations and the pace at which each central bank signals a shift. The Euro has struggled to sustain directional conviction because both sides have been sending mixed signals. This has produced choppy two sided auctioning within a broader range. Sellers have shown responsiveness at the upper end of the structure, while buyers have continued to defend well defined pockets of liquidity near the lows. The result has been repeated consolidation blocks forming as neither side fully takes control.
2. What the market has done
The market was trending lower from September into November while still trading within the larger multi month range between 1.200 (daily resistance) and 1.155 (daily support). Offers consistently stepped down through this period.
Buying liquidity was found again at the 1.155 area. Buyers had previously responded here, initiating the August rally off May’s Bid Block 1 which formed the daily support. This zone once again acted as a key response area. Bids stepped up as the market compressed into late November, and buyers were able to push back through the descending offer sequence.
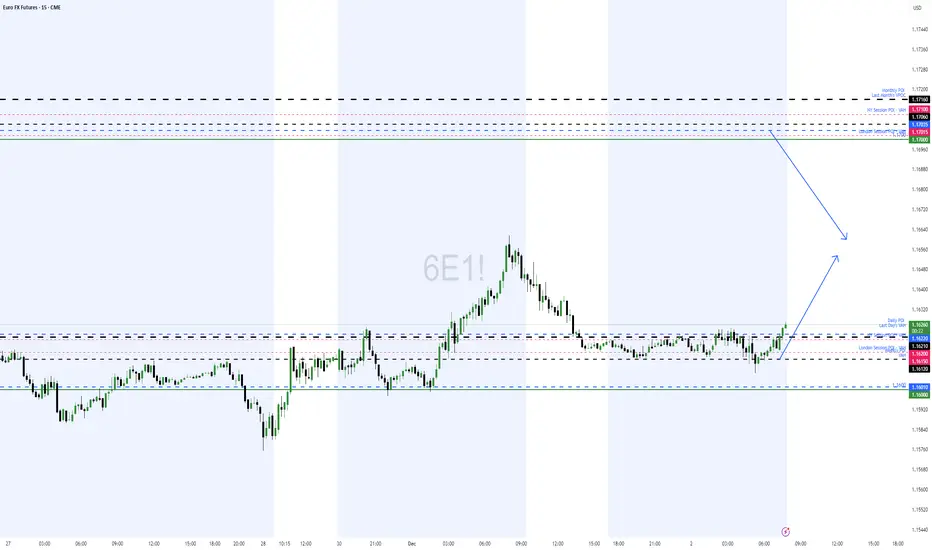
From there, the market auctioned two way between the 1.174 area (1 December weekly VAH and daily pivot zone 2) and the 1.155 daily support. Buyers stepped up bids in early December and succeeded in bidding prices back above 1.174, showing that buyers were still present and willing to auction the market back up. This move also confirmed that sellers failed to hold the breakdown from the prior 1.5 month consolidation block.
3. What to expect in the coming week
The key level to watch is the 1.182 area (29 September weekly VAH).
Bullish Scenario
• If the market is able to accept above 1.182, it is expected to continue higher toward 1.187 (daily pivot zone 1).
• Sellers are expected to respond here from 1.187.
• If sellers fail to respond, the next upside target becomes 1.1967 (15 September weekly VPOC) and possibly 1.200 (daily resistance).
• A move into these levels would place price near the upper boundary of the larger multi month range.
Neutral Scenario
• If the market is unable to accept above 1.182, or if sellers defend and reject price from 1.187 (daily pivot zone 1), the market is expected to remain rotational.
• The likely rotation range sits between 1.173 (1 December weekly VAH / daily pivot zone 2) and 1.187.
• This should allow the market to establish value higher and form a base for further directional resolution.
Bearish Scenario
• If buyers fail to defend 1.173 (1 December weekly VAH, daily pivot zone 2, and Bid Block 3 range high), the market is expected to push lower to 1.1666 area (17 November VAH).
• If selling continues, price may extend further to 1.1644 (24 November weekly VPOC).
Conclusion
Euro FX remains in a larger range with clearly defined response zones on both sides, and next week’s behavior around 1.182 will set the tone for whether the market rotates higher or slips back into balance.
Let me know what levels you are watching or if you see anything different on your charts. Please give this post a boost so more traders in the community can join the discussion! Thank you.
Disclaimer: This is not financial advice. Trade your own plan and manage your own risk carefully.
EUREX, EUR/USD PHYSICAL, CURRENCY Futures
No trades
Market insights

The Anatomy of an Overextended Market MoveMarket Context: When Momentum Accelerates
Markets periodically enter phases where price accelerates rapidly, often driven by a combination of macro catalysts, positioning imbalances, and behavioral feedback loops. In such environments, momentum can appear self-reinforcing: higher prices attract more participation, which in turn pushes prices even higher. While these phases can feel decisive and convincing, they also introduce an important analytical question — is the move being accepted by the market, or is it simply expanding faster than structure can support?
This distinction matters because strong momentum does not automatically imply durability. In fact, the most aggressive moves often carry the seeds of their own instability, particularly when price begins to disconnect from commonly observed reference points such as volatility envelopes, prior value zones, and resting order clusters.
The recent advance examined in this case study provides a clear example of this dynamic: a structurally bullish resolution followed by a sharp acceleration that raises legitimate questions about sustainability.
Pattern Resolution Versus Move Sustainability
Classical chart patterns are useful because they describe how markets transition from balance to imbalance. A double bottom, for example, reflects a failed attempt by sellers to extend lower prices, followed by renewed demand. Once the neckline is cleared, the pattern is considered resolved.
However, pattern resolution only explains directional bias — it does not guarantee how price will behave after the breakout.
In practice, many pattern completions coincide with:
Early participants reducing exposure
Profit-taking activity near projected objectives
New positioning that is more sensitive to short-term adverse movement
As a result, the completion of a pattern can sometimes mark the end of a clean directional phase rather than the beginning of an extended one. This is especially relevant when the breakout is followed by aggressive price expansion rather than gradual acceptance.
Volatility Expansion and the Bollinger Band Framework
Bollinger Bands® are commonly misunderstood as directional indicators. In reality, they function as volatility envelopes, providing context for how far price has deviated from its recent mean.
When price trades:
Outside the upper band
After a gap higher
And remains extended for multiple sessions
it signals volatility expansion, not necessarily trend continuation.
From a statistical perspective, such conditions indicate that price has moved beyond its recent distribution range. From a behavioral perspective, they often reflect:
Late participation
Emotional decision-making
Reduced liquidity on one side of the market
None of these imply that price must reverse immediately. What they do imply is that the informational risk of continuation increases, while the probability of mean reversion back toward equilibrium also rises.
Mean Reversion as a Structural Tendency
Mean reversion is not a prediction tool. It is a structural tendency observed across liquid markets, driven by the constant interaction between:
Value discovery
Liquidity provision
Inventory management by participants
When price moves “too far, too fast,” it stretches these mechanisms. Liquidity providers become more selective, directional participants begin to manage exposure, and resting orders closer to the mean regain relevance.
Importantly, mean reversion does not require a bearish narrative. It simply reflects the market’s natural inclination to revisit areas where participation was previously deeper and more balanced.
In this context, mean reversion should be viewed as a risk consideration, not a directional conviction.
Order-Flow Structure
A key element of this case study is the alignment between classical technical projections and observable order-flow structure, described here through the lens of UnFilled Orders (UFOs).
UFOs represent areas where prior activity suggests the presence of resting interest that has not yet been fully executed. These zones often coincide with:
Prior consolidations
Structural inflection points
Pattern-derived objectives
In the current structure:
o An upper zone near 1.18350 aligns with:
The projected objective of the resolved pattern
UFO resistance
Likely areas of trade closure and sell on-field activity
o A lower zone near 1.16875 aligns with:
UFO support
Areas where price previously attracted participation
A logical mean reversion destination
The importance of these zones lies not in their precision, but in their confluence. When multiple frameworks point to the same areas, they tend to attract attention from a broader range of participants.
Why Overextended Moves Become Fragile
Overextended markets often appear strongest right before they become most sensitive. This is because:
Positioning becomes one-sided
Liquidity thins as fewer participants are willing to transact at extremes
Small shifts in order flow can have outsized impact
In such conditions, price does not need a major catalyst to retrace. It often only needs:
A pause in aggressive buying
Routine profit-taking
A minor shift in expectations
This fragility is what makes mean reversion a relevant consideration after sharp extensions, even within broader bullish structures.
Illustrative Trade Framework (Case Study Only)
To translate these concepts into a practical framework, consider the following illustrative structure, presented strictly as a case study.
o Context
Price has resolved a bullish pattern
Volatility has expanded sharply
Price is trading outside the upper Bollinger Band
o Area of Interest - Upper reference zone near 1.18350, where:
Pattern objectives converge
UFO resistance is present
Trade closure activity is likely
o Mean Reversion Reference - Lower zone near 1.16875, aligned with:
Buy UFO support
Prior participation
The statistical mean
o Risk Definition
Invalidation occurs if price demonstrates acceptance above the resistance zone rather than rejection
This framework highlights an important principle: mean reversion trades are defined by risk first, not by direction. They require patience, flexibility, and a clear understanding of when the underlying premise no longer applies.
Standard and Micro Contracts
This case study can be examined using both standard and micro futures contracts, which offer different exposure profiles while referencing the same underlying market. Understanding their basic specifications is essential, particularly when volatility expands and mean reversion risk increases.
o Standard Futures Contract (6E)
Minimum price fluctuation (tick): 0.000050 per Euro increment = $6.25
Typical margin characteristics: ~$2,700 per contract
o Micro Futures Contract (M6E)
Minimum price fluctuation (tick): 0.0001 per euro = $1.25
Typical margin characteristics: ~$270 per contract
Margin requirements are dynamic, not fixed. They are influenced by market volatility, exchange risk controls, and clearing firm policies.
From a risk-management perspective, the availability of both standard and micro contracts enables traders to align position size with conviction and uncertainty, rather than forcing binary exposure decisions.
Risk Management Considerations
Mean reversion setups carry unique risks. Unlike momentum trades, they often involve entering against recent price direction, which requires:
Smaller position sizing
Wider tolerance for initial adverse movement
Strict invalidation criteria
It is also important to distinguish between being early and being wrong. Overextended markets can remain extended longer than expected. Risk management exists to ensure that such scenarios do not result in disproportionate losses.
Ultimately, the objective is not to capture every retracement, but to participate selectively when structure, volatility, and order-flow context align.
Data Consideration
When charting futures, the data provided could be delayed. Traders working with the ticker symbols discussed in this idea may prefer to use CME Group real-time data plan on TradingView: www.tradingview.com - This consideration is particularly important for shorter-term traders, whereas it may be less critical for those focused on longer-term trading strategies.
General Disclaimer
The trade ideas presented herein are solely for illustrative purposes forming a part of a case study intended to demonstrate key principles in risk management within the context of the specific market scenarios discussed. These ideas are not to be interpreted as investment recommendations or financial advice. They do not endorse or promote any specific trading strategies, financial products, or services. The information provided is based on data believed to be reliable; however, its accuracy or completeness cannot be guaranteed. Trading in financial markets involves risks, including the potential loss of principal. Each individual should conduct their own research and consult with professional financial advisors before making any investment decisions. The author or publisher of this content bears no responsibility for any actions taken based on the information provided or for any resultant financial or other losses.

FX Futures and the Fed Decision The foreign exchange futures markets experienced a week dominated by divergent central bank signals, leading to significant price action across major currency pairs. The Euro and the Japanese Yen futures contracts saw sustained upward momentum against the U.S. Dollar. The Euro was buoyed by comments from European Central Bank officials who pushed back against aggressive rate-cut expectations, suggesting Eurozone inflation remains stickier than anticipated. Simultaneously, the Yen futures rallied sharply as the market intensified speculation that the Bank of Japan might be preparing to exit its negative interest rate policy sooner than expected, following strong domestic wage growth data. This dual pressure on the U.S. Dollar, driven by tighter monetary policy outlooks abroad, created a favorable environment for non-Dollar currencies.
Traders today saw the announcement from the Fed where interest rates were cut by 25-basis points, which was anticipated going into the meeting. There was volatility across asset classes outside of the currencies and equity prices were able to finish the day positive, which was led by the Russell trading up near 1.4%. Silver had another strong day as well trading up over 2% to a new all time high price $60.40/oz. Looking at the FedWatch now, there is a 77% probability that in the January meeting, the Fed will keep rates unchanged, but that figure has been volatile over the last few months and traders will be watching markets as we wrap up 2025 to see if this changes.
If you have futures in your trading portfolio, you can check out on CME Group data plans available that suit your trading needs tradingview.com/cme/
*CME Group futures are not suitable for all investors and involve the risk of loss. Copyright © 2023 CME Group Inc.
**All examples in this report are hypothetical interpretations of situations and are used for explanation purposes only. The views in this report reflect solely those of the author and not necessarily those of CME Group or its affiliated institutions. This report and the information herein should not be considered investment advice or the results of actual market experience.

When Price Gets Ahead of ItselfMarkets love drama.
Price breaks out, momentum accelerates, and suddenly everything feels obvious. Charts look clean, conviction is high, and everyone agrees — this thing is strong.
But here’s the catch: strong doesn’t always mean sustainable.
When price moves too far too fast, it stretches liquidity, pulls in late participants, and often leaves structure behind. That’s when volatility expands, Bollinger Bands® get left in the dust, and the market quietly becomes fragile.
This is where mean reversion sneaks into the conversation — not as a call for collapse, but as a reminder that markets like balance. Extremes attract attention, and attention attracts counter-flow.
Add in order-flow context — like UnFilled Orders (UFOs) lining up near pattern objectives — and suddenly those “obvious” moves don’t look quite as comfortable anymore.
Mean reversion trades aren’t about being right.
They’re about managing risk when price runs ahead of itself.
Because in trading, the real edge isn’t momentum.
It’s knowing when momentum starts to wobble.
Know your specs…
Standard Futures Contract (6E)
Minimum price fluctuation (tick): 0.000050 per Euro increment = $6.25
Typical margin characteristics: ~$2,700 per contract
Micro Futures Contract (M6E)
Minimum price fluctuation (tick): 0.0001 per euro = $1.25
Typical margin characteristics: ~$270 per contract
Want More Depth?
If you’d like to go deeper into the building blocks of trading, check out our From Mystery to Mastery trilogy, three cornerstone articles that complement this one:
🔗 From Mystery to Mastery: Trading Essentials
🔗 From Mystery to Mastery: Futures Explained
🔗 From Mystery to Mastery: Options Explained
When charting futures, the data provided could be delayed. Traders working with the ticker symbols discussed in this idea may prefer to use CME Group real-time data plan on TradingView: www.tradingview.com - This consideration is particularly important for shorter-term traders, whereas it may be less critical for those focused on longer-term trading strategies.
General Disclaimer:
The trade ideas presented herein are solely for illustrative purposes forming a part of a case study intended to demonstrate key principles in risk management within the context of the specific market scenarios discussed. These ideas are not to be interpreted as investment recommendations or financial advice. They do not endorse or promote any specific trading strategies, financial products, or services. The information provided is based on data believed to be reliable; however, its accuracy or completeness cannot be guaranteed. Trading in financial markets involves risks, including the potential loss of principal. Each individual should conduct their own research and consult with professional financial advisors before making any investment decisions. The author or publisher of this content bears no responsibility for any actions taken based on the information provided or for any resultant financial or other losses.

Euro FuturesEuro futures have displayed a clear upward trend over the last week, pushing higher primarily due to shifting expectations for U.S. Federal Reserve monetary policy. The move was ignited by weaker-than-expected economic data out of the U.S., such as a slowdown in the ADP private payrolls report and a softer ISM services index. This fueled market anticipation that the Fed is highly likely to ease monetary policy (cut rates) sooner than previously forecast. As U.S. interest rate expectations declined relative to the European Central Bank (ECB) outlook, the interest rate differential narrowed, making the Euro more attractive to investors compared to the U.S. Dollar and thus driving the Euro futures price higher.
This strength in Euro futures has persisted despite the European Central Bank (ECB) being widely expected to keep its interest rates unchanged at its upcoming meeting. The fundamental support for the Euro is largely coming from the weakness in its counter-currency, the U.S. Dollar. Furthermore, resilient economic indicators within the Eurozone, such as improving Purchasing Managers' Indices (PMIs) and signs of stabilizing domestic demand, have provided a floor for the currency. This environment of sustained European rates and anticipated U.S. cuts has created a favorable short-term macroeconomic backdrop for the Euro futures, causing the contract to trade at multi-week highs and suggesting market participants are pricing in continued Dollar headwinds.
If you have futures in your trading portfolio, you can check out on CME Group data plans available that suit your trading needs tradingview.com/cme/
*CME Group futures are not suitable for all investors and involve the risk of loss. Copyright © 2023 CME Group Inc.
**All examples in this report are hypothetical interpretations of situations and are used for explanation purposes only. The views in this report reflect solely those of the author and not necessarily those of CME Group or its affiliated institutions. This report and the information herein should not be considered investment advice or the results of actual market experience.

6EH2026 4-HOUR ANALYSISThere are three significant volume cluster areas identified around 1.19075,1.17510 and 1.16985. If price goes up, it will reach 1.19075 before reversing. If it price continues with the downward movement, it will reach the maximum volume area at 1.17510 before reversing or it may continue to 1.16985 before reversing.

EURUSD SHORTPrice tapped the supply zone at daily
overall trend bearish
ABC formation high probability for short trade to 1.1550
Trend safe

EURUSD - 3 ScenariosWe have 3 ascending channels.
1st one was breached & Retested earlier taking the chart into the 2nd green channel. We have seen rejection twice over SUPPORT 1 giving us a good bullish momentum; On the way up, chart broke a resistance line & retested it, turning it into SUPPORT 2.
Now we are heading for the red resistance zone.
We have 3 potential scenarios;
1- A CONTINUATION of the Upward Momentum keeping us inside the Green Channel.
2- BREACHING the green Channel and moving into the BLUE one, yet staying above SUPPORT 2. 3- BREACHING the green channel & SUPPORT 2.
Scenarios 1 & 2 remain favorable over 3. We need to watch how the chart will react in the red zone & watch out for FAKE Breakouts.
Trade Safe.

Long Euro at 1.165As euro yesterday respected our level of 1.162 we expect the move to continue till 1.17. I would like to get in at 1.165 for longs and if the price rejects 1.17-1.171 we will short the future.

Rapid ORB Pro in ActionOur indicator has popped a signal in the Asia session. We have already executed the trade and let see where we will go. Please remember to manage your trade all the time..

Value Suggest 6e is cheap. Looking at the monthly Vol profile o euro i see 1.162 as a key level to buy and price can be bought and sold at 1.175. but everything comes down to orderflow and what the buyers think.
Runtime Error- Rapid ORB ProIf you facing this issue. please go the video this will solve the issue. this is just a memory buffer limitation. We just need to reset the buffer.

USD Index Proxy: EURUSD Breakout to Validate T-Note & XAGUSD MovThe Core Thesis: The Euro Futures chart, which is the mirror image of the US Dollar Index (DXY), is consolidating in a Symmetrical Triangle pattern. The direction of the inevitable breakout will be the ultimate fundamental driver for the Silver ATH move and the T-Note's wedge break. This chart holds the key to the macro move.
Technical Snapshot: The Symmetrical Triangle
The Pattern: The daily chart shows a clear Symmetrical Triangle formed since mid-2025, characterized by converging trendlines (lower highs and higher lows). This pattern signals indecision but precedes a high-momentum directional move.
Key Levels: The price is hovering near a critical support zone around 1.15000 and just above a major long-term EMA (shown in pink/red).
Trendline Breakouts:
Bullish Breakout: A decisive close above the upper trendline and the resistance around 1.16840 would confirm a move higher.
Bearish Breakdown: A close below the lower trendline and the major support cluster around 1.14300 - 1.15000 would confirm a move lower.

Rapid ORB Pro- In action- Hyper Precision signal NY sessionWe are providing update live trade with our indicator. Very clean signal generated by our indicator.
Hopefully by next week we will publish the guidelines.

SP500, Bitcoin, Dollar & Euro Daily Trade SetupsIn this update we review the recent price action the SP500, Bitcoin, Dollar Index and the Euro and identify the high-probability trading opportunities and price objectives to target. To review today's video analysis, click here!

GC1 & 6E1 Daily Trade SetupsIn this update we review the recent price action in the Gold and Euro futures and identify the next high probability trading opportunties and price objectives to target. To review today's video analysis click here!

The COT trader - EUJust waiting for a strong bearish daily candle to form.
Take an entry on the next day daily open.
Target the previous swing lows.

Euro Under Pressure as Dollar Dominance and Economic Worries WeiOver the past two weeks, the Euro futures have experienced significant downward pressure, struggling to hold ground against a strengthening U.S. Dollar. One driver of this depreciation has been a marked divergence in monetary policy expectations between the European Central Bank (ECB) and the Federal Reserve. While the Fed has maintained a hawkish stance, signaling higher-for-longer interest rates supported by resilient U.S. economic data, the ECB has appeared more cautious, with recent eurozone economic indicators hinting at a potential slowdown. This widening interest rate differential makes the Euro less attractive to yield-seeking investors, leading to capital flows away from the single currency and into the Dollar.
Adding to the Euro's woes, recent economic reports from key eurozone members have painted a picture of subdued growth and persistent inflationary challenges, creating a difficult balancing act for the ECB. Traders in FX futures have actively priced in these concerns, pushing the Euro to test critical support levels against the Dollar. This dynamic underscores how intertwined global economic performance and central bank rhetoric are in shaping currency valuations within the futures market, with the Euro's path heavily dependent on both domestic economic recovery signals and the evolving strength of the mighty U.S. Dollar.
If you have futures in your trading portfolio, you can check out on CME Group data plans available that suit your trading needs tradingview.com/cme/
*CME Group futures are not suitable for all investors and involve the risk of loss. Copyright © 2023 CME Group Inc.
**All examples in this report are hypothetical interpretations of situations and are used for explanation purposes only. The views in this report reflect solely those of the author and not necessarily those of CME Group or its affiliated institutions. This report and the information herein should not be considered investment advice or the results of actual market experience.

Rapid ORB ProThis a live demonstration about our indicator. We will publish details tutorial in you tube and over her as well. How to use and guidelines to enter.

Next week 6E(EURUSD) BearishNext week’s price outlook appears bearish.
Market structure shows a clear downtrend following the confirmed break of the previous swing low.
Price is expected to retrace into the FVG before continuing lower toward the downside FVG.
The FVG is untapped. We have to watch the major support area . if the area broke, price has higher chance to reach the below FVG
The FVG below is a high-probability area, as five liquidity lows are positioned directly above it.

EUR/USD Running Flat Near CompletionAbout the Asset
Micro EUR/USD Futures on the CME are a smaller version of the standard EUR/USD futures contract. They move exactly like the EUR/USD currency pair, which reflects how strong or weak the Euro is compared to the US Dollar. Because the Dollar sits at the centre of the global financial system, the movements in this pair carry broader meaning. Traders often use EUR/USD as a guide to understand shifts in global liquidity and risk appetite.
Why This Chart Matters
A rising EUR/USD usually means the Dollar is weakening. When the Dollar weakens, financial conditions soften and risk assets often find support. A falling EUR/USD usually means the Dollar is strengthening, which can tighten liquidity and add pressure on equities and other risk-sensitive markets. Tracking this currency pair helps identify where global sentiment may turn next.
Relationship With SPX500
EUR/USD and the SPX500 tend to move in similar directions because both respond to the strength of the Dollar. When the Dollar strengthens, EUR/USD drops and the SPX500 often struggles. When the Dollar weakens, EUR/USD rises and the SPX500 usually recovers. The comparison on this chart shows how both markets have been moving through similar cycles. This helps confirm whether a turning point in EUR/USD is also likely to influence equities.
Elliott Wave Structure
From the early part of the chart, the pair completed a clear five-wave advance, ending near 1.1890. After this high, the market moved into a three-wave A-B-C correction. Wave A ended at 1.1420. Wave B then bounced strongly and briefly moved above the start of Wave A, which is a typical sign of a running flat structure.
Wave C has been weak and overlapping, which fits the behaviour of an ending diagonal. Diagonals often show slowing momentum and choppy swings, and they tend to appear at the end of a corrective pattern. Importantly, Wave C has not broken below the Wave A low at 1.1420. This supports the running flat idea, where the final leg fails to make a new low.
Key Levels
The level at 1.1420 is the invalidation point for the bullish running flat structure. As long as price stays above this level, the market retains the potential to complete Wave C and turn higher. The area around 1.1500 to 1.1520 has already shown some reaction, hinting that the diagonal may be complete or close to completing.
A break above the downward-sloping trendline that has contained the recent decline would be the first sign of strength. A stronger confirmation would come if price moves above the high of the internal Wave (4) within C.
What I Expect
If the running flat interpretation is correct, the market may bounce before testing the 1.1420 low. Ending diagonals are known for turning early, and failed C-waves are common in this pattern. A recovery from the current zone would align with the SPX500 pullback slowing down as well. Both assets would then be in a position to move higher together if the Dollar’s strength eases.
Disclaimer: This analysis is for educational purposes only and does not constitute investment advice. Please do your own research (DYOR) before making any trading decisions.

Rapid ORB ProLive trade using our advanced indicator. This is free for everyone to use in trading view. We are working with guidelines and different ways to enter trade with out indicator. This will make everyone profitable.

EURUSD long with the most obvious signals.This is a dream of a longshot. What better time than now, when so much is happening in the world and the price has retested the support already, to dream? When the trend is poised to spring up after a retraction, the eventuality is on the buyers. We need the price back up to sell it again.
