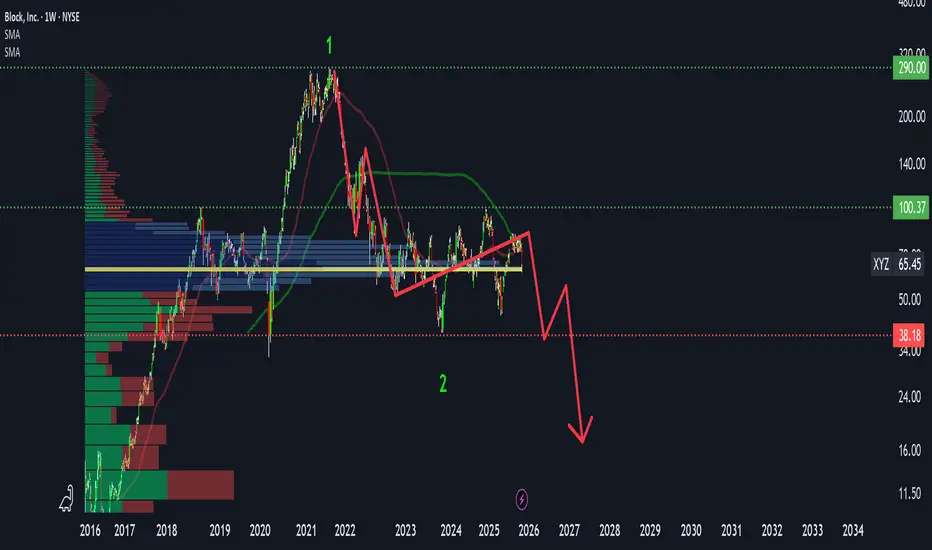
XYZ(BLOCK) HIGH PROBAIBILITY LONG SETUP SOON!!!🚨 XYZ HIGH PROBABILITY BUY SETUP 🚨
* Here We Can See Clearly The Next Potential Moves For BLOCK Coming Hours/Days.
* Keep Your Eyes Close On Your Trading Positions.
* Happy PIP Hunting Traders.
FXKILLA.
Block, Inc. Class A
No trades
Next report date
—
Report period
—
EPS estimate
—
Revenue estimate
—
4.34 EUR
2.80 B EUR
23.30 B EUR
531.31 M
About Block, Inc.
Sector
CEO
Jack Patrick Dorsey
Website
Headquarters
Oakland
Founded
2021
Identifiers
3
ISIN:US8522341036
Block, Inc. engages in creating ecosystems for distinct customer audiences. It operates through the Square and Cash App segments. The Square segment provides payment services, software solutions, hardware, and financial services to sellers. The Cash App segment includes the financial tools available to individuals within the mobile Cash App, including peer-to-peer payments, bitcoin and stock investments. It also includes Cash App Card, which is linked to customer stored balances that customers can use to pay for purchases or withdraw funds from an ATM. The company was founded by Jack Patrick Dorsey and James Morgan McKelvey in February 2009 and is headquartered in Oakland, CA.
Related stocks

3-Year Range Breakout in MotionXYZ is shaping up for a potential breakout after nearly three years of range-bound accumulation and it looks like it wants to push through relatively soon. Granted there is a key supply structure just above (marked), which should be respected, but given the duration of the base, a clean push through

XYZ LongSupport Zone
Long entry 62
Stop 59,
Target 72, 81
Risk management is much more important than a good entry point.
I am not a PRO trader.
In my trading plan, the Max Risk of each short term trade should be less than 1% of an account.

Block (XYZ): Weak Earnings, Bitcoin Exposure, and the Next Move📊 Fundamental Overview
I entered Block (XYZ) about a year ago when the company’s cash flow trends were very strong.
However, right now the picture is becoming more concerning.
EPS growth is not stable.
Previously, EPS was growing rapidly (65%, 38%, 155%), but the last two quarters showed onl
XYZ is looking likely to form a Bullish Flag Patternafter a surge of price and then a long consolidation phase, XYZ may burst through the 82.44 resistance and go on a rally. the recent 50\200 MA semi-golden cross and the likely upcoming 150\200 MA golden cross are making the bullish speculative more likely.
XYZ - Blocks stacking up=======
Volume
=======
- slight decrease
==========
Price Action
==========
- Broken out downtrend line of 3 years, rebounded and supported above trendline
- Bullish flag forming
- Double bottom noticed
=========
Oscillators
=========
- Ichimoku
>>> price closed above cloud
>>> red kumo thinning
>
Block - a potential break out of a bullish flagFollowing a significant downtrend, the stock NYSE:XYZ has been consolidating since May 2022, trading within a range of $45–$50 and $90.
Within this broad consolidation, the price has repeatedly reacted to the $81–$82 level. Recently, after a sharp rally from $45, the stock is now consolidating r
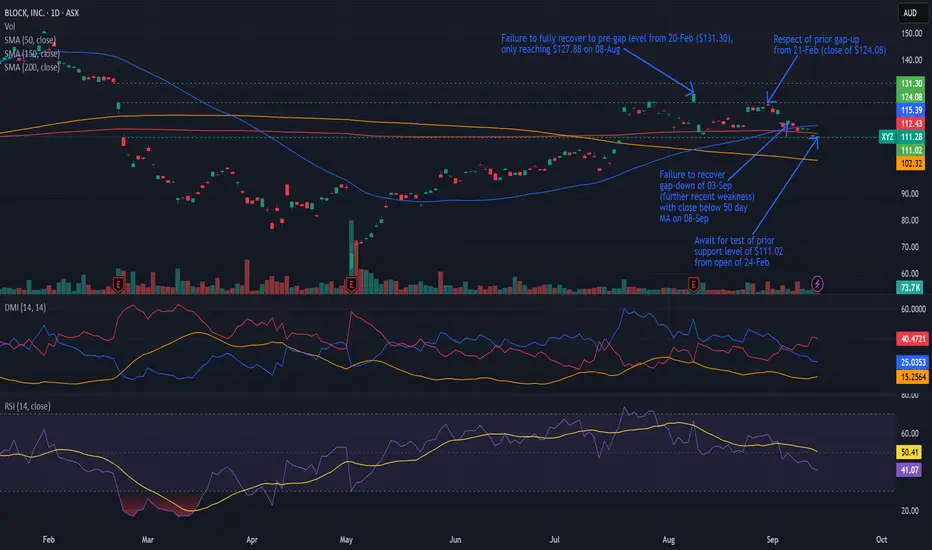
Bearish potential detected for XYZEntry conditions:
(i) lower share price for ASX:XYZ along with swing of DMI indicator towards bearishness and RSI downwards, and
(ii) observing market reaction around the share price of $111.02 (open of 24th February).
Depending on risk tolerance, the stop loss for the trade would be:
(i) above t
Bullish trendline keeps beeing rock solid 📈 We can clearly see a bullish trendline confirming the trend since mid-May.
✅ The trendline has been tested and confirmed on multiple occasions, especially over the last two weeks.
🔥 The candles that broke through ended up attracting a huge amount of buyers, turning them into extremely bullish ca

XYZ Bullish Setup: Pending Entry & Target Strategy!📌 Asset & Plan
XYZ (Block, Inc.) NYSE | Swing/Day Trade
Plan: Bullish 💹 (Pending Order Setup)
Breakout Entry: Near $83.00 ⚡ (Set alerts to catch the breakout!)
🧩 Thief-Style Layer Strategy
Multiple limit layer entries after breakout: $82.00 / $80.00 / $78.00
Scale your positions according to your r
See all ideas
Summarizing what the indicators are suggesting.
Neutral
SellBuy
Strong sellStrong buy
Strong sellSellNeutralBuyStrong buy
Neutral
SellBuy
Strong sellStrong buy
Strong sellSellNeutralBuyStrong buy
Neutral
SellBuy
Strong sellStrong buy
Strong sellSellNeutralBuyStrong buy
An aggregate view of professional's ratings.
Neutral
SellBuy
Strong sellStrong buy
Strong sellSellNeutralBuyStrong buy
Neutral
SellBuy
Strong sellStrong buy
Strong sellSellNeutralBuyStrong buy
Neutral
SellBuy
Strong sellStrong buy
Strong sellSellNeutralBuyStrong buy
Displays a symbol's price movements over previous years to identify recurring trends.
SQ6150163
Block, Inc. 6.0% 15-AUG-2033Yield to maturity
5.47%
Maturity date
Aug 15, 2033
SQ6150161
Block, Inc. 5.625% 15-AUG-2030Yield to maturity
5.14%
Maturity date
Aug 15, 2030
SQ5449300
Block, Inc. 3.5% 01-JUN-2031Yield to maturity
4.80%
Maturity date
Jun 1, 2031
SQ5449301
Block, Inc. 2.75% 01-JUN-2026Yield to maturity
4.40%
Maturity date
Jun 1, 2026
SQ5307445
Block, Inc. 0.25% 01-NOV-2027Yield to maturity
—
Maturity date
Nov 1, 2027
SQ5307444
Block, Inc. 0.0% 01-MAY-2026Yield to maturity
—
Maturity date
May 1, 2026
See all 4SQ bonds
Frequently Asked Questions
The current price of 4SQ is 53.77 EUR — it has increased by 0.50% in the past 24 hours. Watch Block, Inc. Class A stock price performance more closely on the chart.
Depending on the exchange, the stock ticker may vary. For instance, on EUROTLX exchange Block, Inc. Class A stocks are traded under the ticker 4SQ.
4SQ stock has risen by 1.51% compared to the previous week, the month change is a −4.61% fall, over the last year Block, Inc. Class A has showed a −40.74% decrease.
We've gathered analysts' opinions on Block, Inc. Class A future price: according to them, 4SQ price has a max estimate of 90.45 EUR and a min estimate of 38.77 EUR. Watch 4SQ chart and read a more detailed Block, Inc. Class A stock forecast: see what analysts think of Block, Inc. Class A and suggest that you do with its stocks.
4SQ stock is 0.50% volatile and has beta coefficient of 1.57. Track Block, Inc. Class A stock price on the chart and check out the list of the most volatile stocks — is Block, Inc. Class A there?
Today Block, Inc. Class A has the market capitalization of 33.53 B, it has increased by 1.32% over the last week.
Yes, you can track Block, Inc. Class A financials in yearly and quarterly reports right on TradingView.
Block, Inc. Class A is going to release the next earnings report on Feb 19, 2026. Keep track of upcoming events with our Earnings Calendar.
4SQ earnings for the last quarter are 0.46 EUR per share, whereas the estimation was 0.54 EUR resulting in a −15.34% surprise. The estimated earnings for the next quarter are 0.56 EUR per share. See more details about Block, Inc. Class A earnings.
Block, Inc. Class A revenue for the last quarter amounts to 5.21 B EUR, despite the estimated figure of 5.37 B EUR. In the next quarter, revenue is expected to reach 5.37 B EUR.
4SQ net income for the last quarter is 393.33 M EUR, while the quarter before that showed 457.10 M EUR of net income which accounts for −13.95% change. Track more Block, Inc. Class A financial stats to get the full picture.
No, 4SQ doesn't pay any dividends to its shareholders. But don't worry, we've prepared a list of high-dividend stocks for you.
As of Dec 13, 2025, the company has 11.37 K employees. See our rating of the largest employees — is Block, Inc. Class A on this list?
EBITDA measures a company's operating performance, its growth signifies an improvement in the efficiency of a company. Block, Inc. Class A EBITDA is 2.45 B EUR, and current EBITDA margin is 10.01%. See more stats in Block, Inc. Class A financial statements.
Like other stocks, 4SQ shares are traded on stock exchanges, e.g. Nasdaq, Nyse, Euronext, and the easiest way to buy them is through an online stock broker. To do this, you need to open an account and follow a broker's procedures, then start trading. You can trade Block, Inc. Class A stock right from TradingView charts — choose your broker and connect to your account.
Investing in stocks requires a comprehensive research: you should carefully study all the available data, e.g. company's financials, related news, and its technical analysis. So Block, Inc. Class A technincal analysis shows the sell today, and its 1 week rating is sell. Since market conditions are prone to changes, it's worth looking a bit further into the future — according to the 1 month rating Block, Inc. Class A stock shows the sell signal. See more of Block, Inc. Class A technicals for a more comprehensive analysis.
If you're still not sure, try looking for inspiration in our curated watchlists.
If you're still not sure, try looking for inspiration in our curated watchlists.