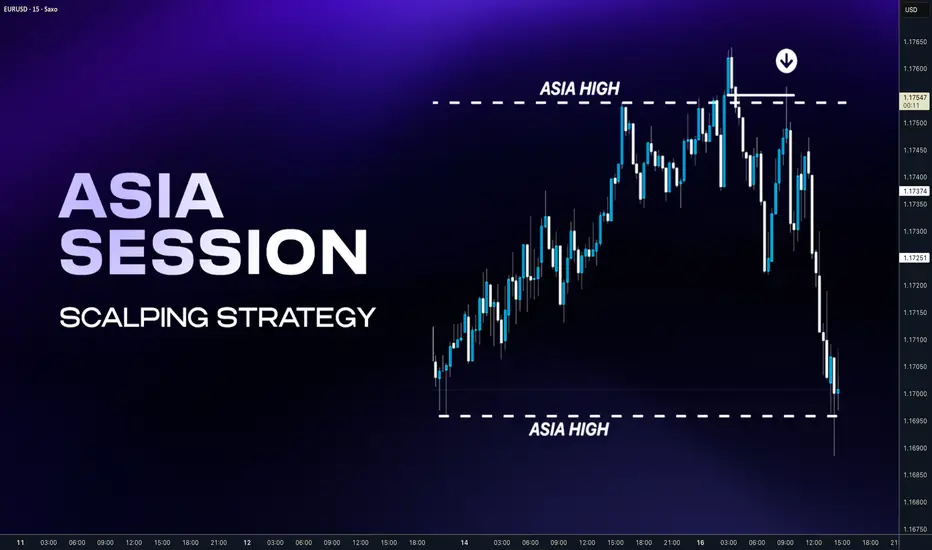
Understand Asia Session & Conquer London SetupsAsia is the “setup session.” Price often builds a tight box, prints equal highs and lows, and leaves obvious resting liquidity. London loves to raid that liquidity because it’s easy fuel. But before we go to the concept of how to trade it's also good to know why it is created. We already know that FX markets are controlled by CLS Market maker. Do we know it 100% ? No, but they trade almost 7 Trillion daily volume which is almost entire daily FX volume. This company is aggregator the many other bigger ones, they are collecting the orders during the the Asia and processes continuous settlement, during the next day the liquidity is found on the markets. (Im not promoting or something like that, this is institutional player which 99.9% of use here will not have access) Thats where they destroy most less informed traders, not purposely but their work is so effective that small % of traders succeed in this game.
🧩 Simplicity of the concept
You don't trade in the Asia session, Let Asia build the trap , Let price raid one side. Wait for proof it’s done raiding Enter on the retrace, not in the raid and trade contininuation during the London. In the scalping version . You can trader just one side of Asia range to the other side. This requires precisions on lower timeframes. Im planning to explain this later in the next post. For now let's do continuation setups during the London Session.
📌 Asian Session
Low volatility & accumulation phase — the market usually consolidates inside a tight range after the previous New York close. If the Asia session is trending, London will be continuation setup.
📌 London Session
The highest-probability setups often occur during this session.
If Asia was tight range, London usually manipulates the Asian range sweeping stops above or below then reverses and starts the true daily move. London will be Reversal setup. Often sets the daily high or low of the day
❌ Don't overthink it you need to understand HTF Bias
I you dont have HTF Bias your win ration will decrease, you will be frustrated and than you will typically jump to another strategy, like you did it already many times.
⁉️ Always start with question - Where is the liquidity
Always follow the Daily / Weekly candle close. Yes Daily and Weekly !! Even when you are trading intraday. You intraday trades must be within HTF flow. IT means you will not have a trade every day if you want hight win rate. You must be patient.
📈 Continuation
If todays daily candle closed above previous days high and its still not reaching the key level, then liquidity is above todays high. Why ? Because people have intentions to sell highs to early, so and price will most likely go there. So we are bullish. Bullish Close 📈 Reversal
If todays candle wicked above previous day high, but closed below , then we can expect liquidity is below Previous days low. Why? Because mostl likely traders entered fake high break out they put SL below days low. It's signs of reversal. Yes that simple it is. For more details scroll down and find my posts about Daily Bias.
🧩 4 X Potential Frameworks
If you drill what I will show you bellow you will see it on the charts happening at least 2 times a week. If you apply this to the 3 pairs. You got 6 high probability setups . Add patience and risk management = You will conquer the forex trading
🧪 London Continuation Bearish setup
•Narrative: Asia did the manipulation → London does the continuation.
• Asia session already made a manipulation into a key level
• Price displaced away from that level
• CIOD / OB on M15 or H1 before London open • H1: Asia runs above the stops above H1 high into a key level
• It gets rejected and followed by order block and displacement
• At London open, price retraces into M15 premium key level and continues in the same direction
❌Invalidation: the manipulation high/low from Asia session
🧪 London Continuation Bullish setup
• Narrative: Asia did the manipulation → London does the continuation.
• Asia session already made a manipulation into a key level
• Price displaced away from that level
• CIOD / OB on M15 or H1 before London open • H1: Asia runs bellow the stops above H1 high into a key level
• It gets rejected and followed by order block and displacement
• At London open, price retraces into M15 discount key level and continues in the same direction
❌Invalidation: the manipulation high/low from Asia session
🧪 London Reversal Bearish setup
• Narrative: London performs the manipulation → price reverses.
• Asia session consolidates near a higher timeframe key level
• London open initiates the manipulation into the key level
• Price reject at the key level and created M15 order block • H1: Asia consolidates Bellow Key Level
• London opens, price runs Asia high into that Key Level
• M15 breaks down → Change in order flow → clean short setup
• Target: higher timeframe draw on liquidity (e.g., previous day low)
❌Invalidation: the London session high (manipulation point)
🧪 London Reversal Bullish setup
• Narrative: London performs the manipulation → price reverses.
• Asia session consolidates near a higher timeframe key level
• London open initiates the manipulation into the key level
• Price reject at the key level and created M15 order block • H1: Asia consolidates above the Key Level
• London opens, price runs Asia high into that Key Level
• M15 breaks up → Change in order flow → clean short setup
• Target: higher timeframe draw on liquidity (e.g., previous day low)
❌Invalidation: the London session low (manipulation point)
‼️ In trading, you make most money by making precisely best decisions and controlling your risk. Hence understanding the different probabilistic scenarios we can start focusing on quality over quantity by avoiding lower probability conditions. The aim is to improve our decision making process by knowing when it's better to trade and when not.
❌ Low Probability London Session Conditions
• After a series of 3 consecutive bullish daily candles - Avoid Longs.
• After a series of 3 consecutive bearish daily candles - Avoid Shorts.
• After FOMC event that produces an extreme range.
• Ahead of NFP and CPI data release
• Multiple high and medium impact news events.
• The Asian Range is has been trending and is larger than 40 pips.
• If the Asian Range is not visually consolidating.
• Absence of a candle range
✅ High Probability London Session Conditions
• The market has recently reacted off of Daily /H4 key level
• The Asian Range is visually a consolidating and smaller than 40 pips.
• Presence of a clean visual candle range
• Presence of a higher timeframe key level.
• Clean higher timeframe draw on liquidity.
✅ High Probability Intraday Setups
The highest importance is placed on the H TF Daily or 4h direction:
• Clean orderflow.
• Clean higher timeframe draw on liquidity and directional bias.
• Strong price based narrative.
• Strong time based narrative.
• 4h candle range
• 4h Key level.
• Key time
❌ Common mistakes (quick and painful)
Trading every day, even when Asia is messy and wide
Entering during the sweep instead of after displacement
Stop too tight inside noise instead of beyond the actual swept point
Ignoring higher timeframe bias and wondering why London runs you over
Not journaling screenshots of the sweep + confirmation + entry (then you “feel” like it works, but you don’t know)
---------------------------
I promised myself I’d become the person I once needed the most as a beginner. Below are links to a powerful lessons I shared on Tradingview. Hope it can help you avoid years of trial and error I went thru.
📊 Sharpen your trading Strategy
⚙️ 100% Mechanical System - Complete Strategy
🔁 Daily Bias – Continuation
🔄 Daily Bias – Reversal
🧱 Key Level – Order Block
📉 How to Buy Lows and Sell Highs
🎯 Dealing Range – Enter on pullbacks
💧 Liquidity – Basics to understand
🕒 Timeframe Alignments
🚫 Market Narratives – Avoid traps
🐢 Turtle Soup Master – High reward method
🧘 How to stop overcomplicating trading
🕰️ Day Trading Cheat Code – Sessions
🇬🇧 London Session Trading
🔍 SMT Divergence – Secret Smart Money signal
📐 Standard Deviations – Predict future targets
🎣 Stop Hunt Trading
🧠 Level Up your Mindset
🛕 Monk Mode – Transition from 9–5 to full-time trading
⚠️ Trading Enemies – Habits that destroy success
🔄 Trader’s Routine – Build discipline daily
💪 Get Funded - $20 000 Monthly Plan
🧪 Winning Trading Plan
🛡️ Risk Management
🏦 Risk Management for Prop Trading
📏 Risk in % or Fixed Position Size
🔐 Risk Per Trade – Keep consistency
Never stop learning
David Perk aka Dave FX Hunter ⚔️
Euro / U.S. Dollar
No trades
Market insights
EUR/USD - Central Bank Week in Control (18.12.2025)📝 Description🔹 Market Context (Fundamental) FX:EURUSD
This week is central-bank heavy, keeping EUR/USD sensitive to volatility and USD strength:
BoE (Thursday): High impact – rate cut expected → risk-off tone
ECB (Thursday): Low impact – policy hold expected
BoJ (Friday): High impact – rate hike expectations, supporting JPY and pressuring USD pairs via risk repricing
Overall, policy divergence + risk uncertainty keeps EUR/USD capped near resistance.
🔹 Technical Setup
Price is trading below a key resistance zone and struggling to hold above short-term EMA / cloud levels. Repeated rejections from the highlighted zone indicate seller dominance.
As long as price stays below resistance, pullbacks are likely to extend lower.
📌 Trade Plan 🔴 Bearish below resistance
Sell-on-rejection from the resistance zone
Momentum confirmation preferred on lower timeframes
🔴 1st Support: 1.1685
🔴 2nd Support: 1.1660
#EURUSD #ForexTrading #FundamentalAnalysis #CentralBankWeek #PriceAction #SupportResistance #FXMarket #TradingView #Kabhi_TA_Trading
⚠️ Disclaimer
This analysis is for educational purposes only.
Not financial advice. Always manage risk and use a stop-loss.
❤️ Support the Analysis 👍 Like if this breakdown helps 💬 Comment your EUR/USD bias
🔁 Share with fellow traders

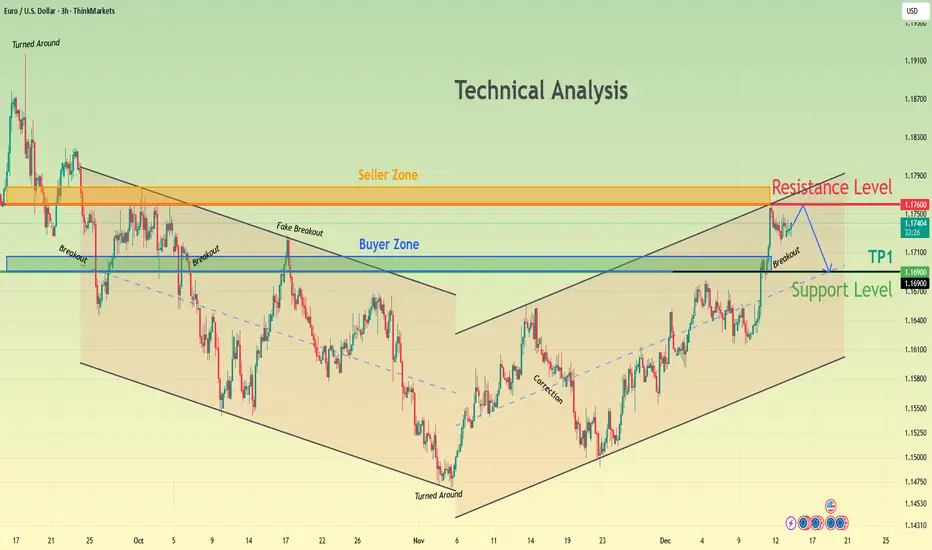
EURUSD Weakens at Seller Zone - Support at 1.1690 Under WatchHello traders! Here’s my technical outlook on EUR/USD based on the current chart structure. After a prolonged bearish move inside a downward channel, EURUSD found a base and reversed from the lower boundary, signaling a loss of bearish momentum. The price then broke above the descending resistance and entered a recovery phase, forming a higher low structure. Following this shift, EURUSD moved into a rising channel, where buyers have been gradually gaining control. Currently, price has pushed into the 1.1760 Resistance Zone (Seller Zone), which previously acted as a strong supply area. The market has already shown signs of rejection from this level, suggesting sellers remain active. Below the current price, the 1.1690–1.1670 Support Level (Buyer Zone) acts as the key demand area and aligns with the lower boundary of the rising structure. As long as EURUSD holds below the resistance, a pullback toward the support zone (TP1) is likely. A deeper correction would still be considered healthy as long as the price remains above structural support. However, a clean breakout and acceptance above 1.1760 could invalidate the short-term bearish pullback scenario and open the way for further upside. For now, the market favors a corrective move, with resistance at 1.1760 and support around 1.1690 as the key levels to watch. Please share this idea with your friends and click Boost 🚀
EURUSD: Sellers Drive Pullback - 1.1670 Support in FocusHello everyone, here is my breakdown of the current EURUSD setup.
Market Analysis
EURUSD remains in a broader bearish structure, and the recent price action is unfolding within a clear downward context. After moving through a prolonged range phase, the pair broke lower and continued to respect the descending trend line, confirming sustained selling pressure. Price later formed a Triangle Support Line, where buyers attempted to reverse the trend, leading to a breakout above the trend line and a retest of the Support Zone around 1.1670. However, after this retest, EURUSD quickly reached the major 1.1760 Resistance, which has repeatedly acted as a strong reaction zone. From this level, a sharp rejection occurred, showing that sellers are still firmly active and protecting this resistance area.
Currently, the market is pulling back from the Resistance Zone and heading back toward the Support Zone, where the ascending structure meets previous breakout levels.
My Scenario & Strategy
My scenario is bearish as long as EURUSD remains below the 1.1760 Resistance and continues to move away from this rejection zone. I expect the price to pull back toward the 1.1670 Support, where the next reaction will determine short-term direction.
Therefore, a clean breakdown below the 1.1670 Support Zone would confirm further bearish continuation and open the path toward lower levels. However, if the pair tests the support and shows a strong bounce, a short-term recovery toward the trend line may occur — but the bearish outlook remains valid while price stays under the 1.1760 Resistance. For now, the market favors sellers, with the key objective being a move back into the Support Zone around 1.1670.
That's the setup I'm tracking. Thank you for your attention, and always manage your risk.

EURUSD Weekly CLS Model 1 nested in Monthly CLS Hi friends, new range created. As always we are looking for the manipulation in to the key level around the range. Don't forget confirmation switch from manipulation phase to the distribution phase to make the setup valid. Stay patient and enter only after change in order flow. If price reaches 50% of the range take partial or full close.
👊 Your ultimate goal as a trader is not to be a generalist who knows 10 000 patterns. But rather create one system with narrowed criteria of each element of the trade to remove subjective and emotional decisions as much as possible and stick to this system no matter what. Practice it 10 000 times become a MASTER.
I promised myself I’d become the person I once needed the most as a beginner. Below are links to a powerful lessons I shared on Tradingview. Hope it can help you avoid years of trial and error I went thru.
📊 Sharpen your trading Strategy
⚙️ 100% Mechanical System - Complete Strategy
🔁 Daily Bias – Continuation
🔄 Daily Bias – Reversal
🧱 Key Level – Order Block
📉 How to Buy Lows and Sell Highs
🎯 Dealing Range – Enter on pullbacks
💧 Liquidity – Basics to understand
🕒 Timeframe Alignments
🚫 Market Narratives – Avoid traps
🐢 Turtle Soup Master – High reward method
🧘 How to stop overcomplicating trading
🕰️ Day Trading Cheat Code – Sessions
🇬🇧 London Session Trading
🔍 SMT Divergence – Secret Smart Money signal
📐 Standard Deviations – Predict future targets
🎣 Stop Hunt Trading
🧠 Level Up your Mindset
🛕 Monk Mode – Transition from 9–5 to full-time trading
⚠️ Trading Enemies – Habits that destroy success
🔄 Trader’s Routine – Build discipline daily
💪 Get Funded - $20 000 Monthly Plan
🛡️ Risk Management
🏦 Risk Management for Prop Trading
📏 Risk in % or Fixed Position Size
🔐 Risk Per Trade – Keep consistency
Never stop learning
David Perk

Liquidity Sweep: All the Info You Ever Need to ConquerHi whats up guys, today lets try to do it in a bullet points instead of writing my stories.
• Liquidity is the reason price moves.
• Markets move toward areas where orders are stacked.
• Most orders sit above highs and below lows.
• That’s why price keeps attacking those areas again and again. 🧪 What a liquidity sweep really is
• A liquidity sweep is a move beyond a clear high or low.
• Its purpose is to trigger clustered stop losses.
• It is not personal and not about your stop.
• It is required so larger players can enter or exit positions. 🧪 Why most traders get caught
• Traders enter at obvious levels inside ranges.
• They usually use tight stop loss
• These areas become liquidity pools.
• Price must visit them before a real move starts. 🧪 Double tops and bottoms
• Repeated reactions are not strength.
• They are preparation.
• Every touch builds more resting stops.
• Triple tops and bottoms are even more attractive.
• Never enter before price runs into them. 🧪 How I read market structure
• I don’t focus on patterns in isolation.
• I focus on where liquidity is being collected.
• Structure is simply the path price takes to grab orders.
• The real move usually starts after the sweep.
1️⃣ USDCHF Sweep and Long - CIOD confirmation click picture👇https://www.tradingview.com/chart/USDCHF/2AbnD2TR-USDCHF-I-Daily-CLS-range-I-Key-Level-FVG-I-HTF-CLS/ 2️⃣ USDJPY Sweep andLong - CIOD confirmation - Click picture 👇https://www.tradingview.com/chart/USDJPY/j18Eh18R-USDJPY-Weekly-CLS-I-Key-Level-OB-Model-1/ 3️⃣ AUDUSD Turtle Sweep and short - CIOD confirmation click picture👇https://www.tradingview.com/chart/AUDUSD/YzC7vNOf-AUDUSD-I-Daily-CLS-range-I-Manipulation-I-Short/
📌 Up Trend - Trade Stop Hunt (LQ Sweep) buy below the lows
– Highs are broken
– Lows are respected
– Liquidity below is being cleaned 📌 Down Trend - Trade Stop hunts (LQ Sweep) sell above the highs
– Lows are broken
– Highs are respected
– Liquidity above is being cleaned 🧪 Stop hunts are not random
• Quick wicks at range extremes are intentional.
• Trendline breaks often appear before reversals.
• Breakout traders provide liquidity.
• The move after the stop hunt is what matters.
1️⃣ EURUSD Short Click picture below to see how price action formed 👇https://www.tradingview.com/chart/EURUSD/vgXOeYfG-EURUSD-Daily-Range-LQ-taken-Rates-cut-was-priced-in/ 2️⃣ GBPUSD Short Click picture below to see how price action formed 👇https://www.tradingview.com/chart/GBPUSD/FKtc84k9-GBPUSD-Daily-CLS-Liqudity-taken-Model-1-Oposing-side-target/ 3️⃣ USDCHF Long Click picture below to see how price action formed 👇https://www.tradingview.com/chart/USDCHF/WrvLuU3j-USDCHF-Daily-CLS-Model-Long-from-KL-rates-cut-is-priced-in/ It's effective because it capitalizes on the retail traders classic mistakes- FOMO and trading break out of the highs and selling the lows. While market makers are doing the opposite (don't get me wrong, Im also retail trader and you are too) trading so called smart money concepts doesn't make us smart money traders.
🧪 How I use stop hunts
• I never enter at the first touch of a level.
• I wait for price to go through it.
• Only after the sweep do I look for entries.
• This gives better timing and tighter risk.
📌 Bearish Scenario - (LTF view) - price (yellow has structured movements and should be crating AMD profiles on the edge of the range. We need to drop to LTF to read the structure. 📌 Bullish Scenario ITF view - Price should not have candle close below the range on the same timeframe otherwise setup is invalidated and new range created. 🧪 Where liquidity sweeps matter most
• Range highs and lows
• Previous week high or low
• Clear swing extremes
• Higher-timeframe key levels
• Daily and weekly ranges 🧪 CLS strategy connection
• Liquidity sweep is the foundation of my CLS approach.
• Fake breakouts create urgency and FOMO.
• Late buyers and sellers get trapped.
• I trade against that behavior.
🧠 Having mechanical system with backtested data is your EDGE.
💪 That is what makes you DISCIPLINED TRADER.
📌 Bullish continuation setups
Model 1 - Entry after manipulation - 50% target
Model 2 - Entry on pullback on level between 61.8 - 80% pullback 📌 Bearish Continuation setups
Model 1 - Entry after manipulation - 50% target
Model 2 - Entry on pullback on level between 61.8 - 80% pullback 🧪 Manipulation phase
• No manipulation means no institutional move.
• Liquidity must be taken first.
• Big candles after sweeps signal readiness.
• That is where opportunity appears.
🧪 Basic CLS workflow
• Define higher-timeframe trend
• Define the range near a key level
• Wait for price to sweep the high or low
• No candle close outside the range on that timeframe
• Enter only after manipulation
📌 Bullish LTF Range within HTF Range
Analyze HTF range and define models, then drop it to your TF and trade your ranges with the HTF range. Always follow the same process only on the LTF - Lower timeframe. 📌 BearishLTF Range within HTF Range
Analyze HTF range and define models, then drop it to your TF and trade your ranges with the HTF range. Always follow the same process only on the LTF - Lower timeframe. 🧪 Why this approach fixes psychology
• Rules remove hesitation
• Backtesting builds confidence
• Losses become expected data points
• Overtrading naturally disappears
🧪 Brief note on SMT
• Sometimes price moves without LQ sweep its because of SMT
• In other words Sweep has happen on correlated pair so it doesn't have to happen on the we are looking for.
• If it’s not at a key level, I ignore it.
📌 SMT EURUSD and GBPUSD Example
GU - just shallow manipulation but creates clean OB
EU - Deeper manipulation but OB created later.
🧪 Final perspective
• Liquidity is sweep / Stop hunt / manipulation is happening ona key levels where mostly traders enters false break to the wrong side and those who has been right are now taken out.
📌 Example of manipulation
Less informed traders bought early and other group of Turtles selling the break out of the lows, they are wrong on the lows. Sellers were used as liqudity and buyers are now trapped in the long where price reverse against them.
I promised myself I’d become the person I once needed the most as a beginner. Below are links to a powerful lessons I shared on Tradingview. Hope it can help you avoid years of trial and error I went thru.
📊 Sharpen your trading Strategy
⚙️ 100% Mechanical System - Complete Strategy
🔁 Daily Bias – Continuation
🔄 Daily Bias – Reversal
🧱 Key Level – Order Block
📉 How to Buy Lows and Sell Highs
🎯 Dealing Range – Enter on pullbacks
💧 Liquidity – Basics to understand
🕒 Timeframe Alignments
🚫 Market Narratives – Avoid traps
🐢 Turtle Soup Master – High reward method
🧘 How to stop overcomplicating trading
🕰️ Day Trading Cheat Code – Sessions
🇬🇧 London Session Trading
🔍 SMT Divergence – Secret Smart Money signal
📐 Standard Deviations – Predict future targets
🎣 Stop Hunt Trading
🧠 Level Up your Mindset
🛕 Monk Mode – Transition from 9–5 to full-time trading
⚠️ Trading Enemies – Habits that destroy success
🔄 Trader’s Routine – Build discipline daily
💪 Get Funded - $20 000 Monthly Plan
🛡️ Risk Management
🏦 Risk Management for Prop Trading
📏 Risk in % or Fixed Position Size
🔐 Risk Per Trade – Keep consistency
Adapt what is useful. Reject what is not. Add something of your own.
David Perk aka Dave FX Hunter

EURUSDHello Traders! 👋
What are your thoughts on EURUSD?
EURUSD extended its rally and touched the upper boundary of the ascending channel.
After reaching this resistance area, price has started a pullback, which appears to be a healthy correction within the broader bullish structure.
Price is now expected to retrace toward the channel support, which overlaps with a strong demand zone and key Fibonacci levels (0.382–0.5).
This confluence area increases the probability of bullish reactions.
As long as the structure remains intact, a rebound from this support zone could trigger the next upward leg, targeting higher highs inside the channel.
Don’t forget to like and share your thoughts in the comments! ❤️

EUR/USD | Testing the supply zone (READ THE CAPTION)By examining the 4H chart of EURUSD, we can see that it has stuck to the supply zone and it's having a hard time making it through the zone. I expect another move to 1.17590 (high of the supply zone) and if it breaks through, I expect it to challenge the FVG zone.
If EURUSD fails to go through the supply zone, a drop to 1.17130 is likely.
Make sure to like and leave comment folks.

EURUSD – 1-Hour Timeframe Tradertilki AnalysisMy friends, good morning,
I have prepared an EURUSD analysis for you on the 1-hour timeframe.
My friends, if EURUSD reaches the positive levels between 1.16418 and 1.16216, I will open a buy position and target the 1.17075 level.
Additionally, buy opportunities may also come from the 1.16604-1.16542 levels, but for me, the most suitable positive buy zone is between 1.16418 and 1.16216.
My friends, I share these analyses thanks to each like I receive from you. Your likes increase my motivation and encourage me to support you in this way.🙏✨
Thank you to all my friends who support me with their likes.❤️

EURUSD Holds Demand - Retest of 1.1760 Resistance LikelyHello traders! Here’s my technical outlook on EURUSD based on the current chart structure. After a prolonged bearish phase inside a descending channel, EURUSD found a solid base near the lower boundary, where selling pressure weakened and price turned around. This reversal led to a clean breakout above the descending resistance, signaling a shift in market structure from bearish to bullish. Following the breakout, price moved higher but entered a corrective phase, forming a series of pullbacks while maintaining higher lows. As momentum rebuilt, EURUSD broke above the key horizontal level and accelerated into an ascending channel, confirming bullish continuation. Price then pushed into the Seller Zone near 1.1760, where a fake breakout occurred — indicating strong supply but not a full trend reversal. After this rejection, the pair pulled back into the Buyer Zone around 1.1700–1.1720, which aligns with previous resistance turned support and the lower boundary of the ascending structure. Currently, EURUSD is holding above the support level, suggesting that the pullback remains corrective. Buyers continue to defend this zone, keeping the bullish structure intact. My scenario: as long as price holds above the 1.1700 Buyer Zone, EURUSD may bounce and make another attempt toward the 1.1760 Resistance / TP1. A confirmed breakout and acceptance above this level would open the door for further upside continuation. A failure to hold support, however, could lead to a deeper correction within the structure. For now, the bias remains bullish, with support holding and resistance as the main upside target. Please share this idea with your friends and click Boost 🚀

EURUSD: Rejection at Key Resistance - Support Zone at 1.1720Hello everyone, here is my breakdown of the current EURUSD setup.
Market Analysis
EURUSD is trading within a broader bullish structure, but the current price action points to a short-term corrective phase. After establishing an upward channel, price successfully broke above the previous consolidation range, confirming bullish momentum. This breakout pushed the pair higher toward the 1.1770 Resistance Zone, which has historically acted as a strong supply area.
Currently, at this resistance, price has shown hesitation and rejection, indicating that sellers are starting to defend this level. As a result, EURUSD is now pulling back from the highs, moving toward the 1.1720 Support Zone, which aligns with the previous breakout area and the lower boundary of the upward channel. This support zone is critical, as it represents the key demand area sustaining the bullish structure.
My Scenario & Strategy
My scenario is short-term bearish as long as EURUSD remains capped below the 1.1770 Resistance Zone. I expect a controlled pullback toward the 1.1720 Support, where buyers are likely to step in and attempt to defend the trend. A clean breakdown below this support would confirm a deeper correction within the channel.
However, if price holds above the support zone and shows a strong bullish reaction, the broader uptrend remains intact, and another attempt toward the resistance highs may follow. For now, the focus is on the corrective move, with 1.1720 as the key level to watch.
That's the setup I'm tracking. Thank you for your attention, and always manage your risk.

EURUSD SELL | Idea Trading AnalysisEURUSD is moving on resistance zone
The chart is above the support level, which has already become a reversal point twice.
We expect a decline in the channel after testing the current level.
We expect a decline in the channel after testing the current level
Hello Traders, here is the full analysis.
I think we can soon see more fall from this range! GOOD LUCK! Great SELL opportunity EURUSD
I still did my best and this is the most likely count for me at the moment.
-------------------
Traders, if you liked this idea or if you have your own opinion about it, write in the comments. I will be glad ⚜️

EURUSD Next Buying Move AnalysisThe chart is showing EUR/USD with two key zones marked
Strong Support Level (bottom blue zone):
Price has bounced from this area multiple times, meaning buyers tend to enter here.
Strong Resistance Level (upper blue zone):
Price has been rejected here several times, meaning sellers tend to enter here.
What the drawn idea on the chart indicates
The sketch on the chart suggests a bullish scenario:
1. Price pulls back slightly
2. Forms a higher low
3. Breaks above the resistance zone
4. Continues up toward the “Target Level” (around 1.17)
This is a typical support → consolidation → breakout → continuation idea.
Reminder
This is only a technical analysis illustration, not a prediction or trading recommendation. Real market conditions can behave differently.

EURUSD: Pin-Bar Candle Signal for Deeper PullbackEURUSD: Pin-Bar Candle Signal for Deeper Pullback
EURUSD has shown clear signs of exhaustion after a false breakout above resistance, followed by a strong pin-bar rejection on both the daily and 4H charts.
The failure to hold above the 1.1788–1.1800 zone confirms strong selling pressure at higher levels. This rejection invalidates the bullish breakout attempt and shifts the bias back to the downside.
On the 4H timeframe, the pin-bar candle reinforces the bearish scenario, suggesting that buyers are losing control and that a corrective move is likely to continue. As long as price remains below the broken resistance, further downside pressure should be expected.
🔻 Bearish targets:
1.1675
1.1595
1.1540
You may find more details in the chart!
Thank you and Good Luck!
PS: Please support with a like or comment if you find this analysis useful for your trading day

EUR/USD Decision PhaseEUR/USD Decision Phase
Recent candles indicate a slowdown in upside follow-through, implying that short-term positioning may be crowded. This pause does not immediately invalidate the broader constructive tone but introduces the risk of a corrective rotation as liquidity is rebalanced. The projected move on the chart highlights a scenario where price may seek efficiency before determining the next directional leg.
Overall conditions suggest the market is transitioning from expansion into evaluation. Continuation higher would require renewed participation, while failure to attract follow-through could lead to a deeper reset driven by profit-taking and short-term repricing. Patience is advised as the market reveals whether this phase resolves through continuation or corrective realignment.
Price action reflects a market that has recently expanded after a prolonged phase of balanced participation. The sequence of higher intraday pushes shows growing initiative from buyers, supported by repeated structure continuation and shallow pullbacks, suggesting confidence rather than urgency. Momentum has remained constructive, with price spending more time advancing than correcting, a sign of controlled accumulation rather than emotional buying.
Recent candles indicate a slowdown in upside follow-through, implying that short-term positioning may be crowded. This pause does not immediately invalidate the broader constructive tone but introduces the risk of a corrective rotation as liquidity is rebalanced. The projected move on the chart highlights a scenario where price may seek efficiency before determining the next directional leg.
Overall conditions suggest the market is transitioning from expansion into evaluation. Continuation higher would require renewed participation, while failure to attract follow-through could lead to a deeper reset driven by profit-taking and short-term repricing. Patience is advised as the market reveals whether this phase resolves through continuation or corrective realignment.

EURUSD Bullish Continuation Toward 1.17802Quick Summary
After the recent strong rally, EURUSD is expected to continue higher following a brief corrective move. The pair has not yet reached 1.17802, which remains a valid upside target. A pullback toward the H1 orderblock at 1.17080, aligned with the 61 Fibonacci level, may provide a solid buy opportunity if a clear reversal signal appears.
Full Analysis
EURUSD has delivered a strong bullish move recently, confirming sustained buying pressure in the market. Despite this strength, EURUSD has not yet reached the key level at 1.17802, which remains an active target within the current bullish structure.
Before continuing toward this level, a short term correction is likely. This pullback is expected to bring price into the H1 orderblock around 1.17080. The importance of this zone is reinforced by its alignment with the 61 Fibonacci retracement, making it a technically strong area for potential demand.
The preferred approach is not to buy the level blindly. A clear reversal signal or rejection from the orderblock is required to confirm that buyers are stepping back in. If such a reaction appears, the correction would likely be complete, opening the path for EURUSD to resume its upward move and continue toward 1.17802.

2 Scenarios - EURUSDHello traders,
the EURUSD price is currently trading below the recent higher high .
We now have two possible scenarios :
🟢 BULLISH SCENARIO:
If the market breaks and closes above the higher high ,
we can expect a bullish continuation 📈
🎯 TARGET: 1.18020
🔴 BEARISH SCENARIO:
If the price breaks and closes below the higher low ,
we may see a strong bearish move 📉
🎯 TARGET: 1.16860

EURUSD Short: Bears Defend Resistance - Next Stop 1.1700Hello, traders! EURUSD is trading within a broader bearish structure, with price action clearly respecting a descending trend line from the higher timeframe. Earlier, the pair reacted from a Pivot Point near the trend line and moved into a consolidation Range, showing indecision before the next directional move. During this phase, price attempted a breakout above the mid-range level, but this move turned into a Fake Breakout, confirming that buyers lacked strength at higher prices. Shortly after, EURUSD formed a clear Head and Shoulders pattern, with a well-defined left shoulder, head, and right shoulder, signaling a potential bearish reversal within the larger downtrend. Following the completion of the right shoulder, price pushed higher and briefly broke above the 1.1700 Demand Zone, but this breakout was quickly rejected. The market then reached the major Supply Zone around 1.1760, where sellers stepped in aggressively, causing a sharp rejection and confirming this area as a strong resistance.
Currently, EURUSD is pulling back from the Supply Zone and moving back toward the 1.1700 Demand Zone, which aligns with previous breakout levels and acts as a key decision area.
My scenario remains bearish as long as EURUSD stays below the descending trend line and the 1.1760 Supply Zone. I expect price to continue pulling back toward the 1.1700 Demand Zone, where the next reaction will define short-term direction. A clean breakdown and acceptance below the 1.1700 level would confirm bearish continuation and open the path toward lower support levels. If price temporarily reacts from demand, a short-term bounce is possible, but the overall bearish bias remains valid while price is capped below the Supply Zone and trend line. For now, sellers remain in control, with the main focus on a move back into the Demand Zone around 1.1700. Manage your risk!

EURUSD Long: 1.1700 Demand Zone Holds the Key to a 1.1760 RetestHello traders! Here’s a clear technical breakdown of EURUSD based on the current chart structure. EURUSD remains within a well-defined ascending channel, forming consistent higher highs and higher lows from the pivot point — a clear sign that the broader structure is still bullish. After the impulsive move higher, price reached the 1.1760 Supply Zone, where temporary rejection and a fake breakout occurred. This reaction signaled short-term profit-taking rather than a structural reversal.
Currently, following the rejection, price pulled back into the 1.1700 Demand Zone, which aligns with the previous breakout level and the mid-range of the ascending channel. This pullback appears corrective, not impulsive, suggesting buyers are absorbing supply and defending structure. The market is now stabilizing above demand, indicating renewed buying interest.
My scenario: as long as EURUSD holds above the 1.1700 Demand Zone, the bullish structure remains intact. A strong reaction from this area could trigger the next impulsive leg toward the 1.1760 Resistance / Supply Zone. A clean breakout and acceptance above 1.1760 would confirm trend continuation and open the path for further upside. Only a decisive breakdown below demand would invalidate the long scenario. For now, the bias favors buyers while price respects the ascending channel. Manage your risk.

Hellena | EUR/USD (4H): LONG to resistance area of 1.18000.Colleagues, the price is successfully moving in an upward impulse “12345” in a medium-term wave “3”.
I believe that this week we will see a continuation of the upward movement.
A slight correction to the support area of 1.17049 is possible to complete wave “4”, followed by an update of the local maximum of the lower-order wave “3” and reaching the resistance area of 1.18000.
Manage your capital correctly and competently! Only enter trades based on reliable patterns!

EURUSD Retest to support reversal to bullishEUR/USD has shown a strong bullish shift after spending several weeks trading inside a descending channel. Price respected the lower and upper boundaries of this channel for a long time, confirming a controlled bearish-to-neutral structure.
Recently, however, the market broke decisively above the channel, signalling a trend reversal from bearish to bullish after the breakout, price rallied strongly and is now consolidating above the former resistance zone, which has turned into key support around 1.1700–1.1720,
Technically this area is very important because holding above it confirms bullish strength and healthy continuation rather than a false breakout we could see next upper side target 1.18003 to 1.18500
You may find more details in the chart,
Trade wisely best of luck buddies.
Ps; Support with like and comments for better analysis thanks for supporting,.

EURUSD Potential UpsidesHey Traders, in today's trading session we are monitoring EURUSD for a buying opportunity around 1.16800 zone, EURUSD is trading in an uptrend and currently is in a correction phase in which it is approaching the trend at 1.16800 support and resistance area.
Trade safe, Joe.

EUR/USD (H2) Chart Pattern..EUR/USD (H2) – Targets
From My chart:
Price is at the upper channel resistance and showing rejection / pullback setup.
Bias: SELL (correction within uptrend)
🎯 Targets
TP1: 1.1620 (first demand / mid-support)
TP2: 1.1520 (major demand zone / channel support)
🛑 Invalidation (for safety)
Above: 1.1760 – 1.1780 (channel top & supply)
📌 Structure-wise this looks like a healthy pullback before next move.
If you want, I can also give exact entry + SL in pure ..
