Artificial Superintelligence (FET): Expecting a Strong BounceFET is coming back into the same support zone where we previously saw a very strong and volatile reaction from buyers. That area already gave us a sharp move up before, so this zone clearly matters.
If price reacts again from here and buyers start stepping in, we could be looking at a similar high-volatility bounce like the last one. For now, we’re simply watching how price behaves at this zone and whether buyers show control again.
Swallow Academy
Market insights

FETUSDT have liquidity at 0.2007 possible to drop to that area after liquidity and then climb towards 0.26

FET/USDT – Long Trade Setup (Daily)FET/USDT – Long Trade Setup (Daily)
Price forming a base after a strong downtrend
Falling wedge/compression near support
Price below cloud, but selling pressure weakening
Long Plan
Entry Zone: 0.19 – 0.205
Stop Loss: 0.1840
Targets:
T1: 0.26
T2: 0.32
T3: 0.37+
DYOR | NFA

FET long term analysisin long term, after bitcoin meet 65000 to 68000 $, FET token can raise from 0.09 to 0.1 zone to 1$ and more.

FETUSDT – Trade ideaFET has shown a local market structure shift (MSS) and is currently pulling back into a key demand zone.
This setup aligns with a TOTAL Market Cap MSS on the 4H, supporting a broader bullish continuation scenario.
Bias
As long as price holds above demand, a bounce and continuation higher is favored.
Confluence with TOTAL MC MSS (4H) increases the probability of this move.
Invalidation
Acceptance below demand invalidates the bullish setup.
Are you waiting for reaction at demand or already positioned? 📊👀
MrC

FETCH – Weekly AnalysisFETCH is currently trading at a key HTF support zone that has acted as
support → resistance → support multiple times in the past.
Price is also compressing against a descending trendline, which increases the probability of a volatility expansion.
Key observations:
Strong historical support around current price
Downtrend structure still intact
Potential trendline breakout if buyers step in
No confirmation yet → patience required
Bullish scenario:
Weekly close above the descending trendline
Support holds as higher low
➡️ Possible trend reversal / expansion
Bearish scenario:
❌ Loss of HTF support
➡️ Continuation of the macro downtrend
Always wait for confirmation. What’s your bias here?

#FET/USDT bullish momentum#FET
The price is moving in a descending channel on the 1-hour timeframe. It has reached the lower boundary and is heading towards breaking above it, with a retest of the upper boundary expected.
We have a downtrend on the RSI indicator, which has reached near the lower boundary, and an upward rebound is expected.
There is a key support zone in green at 0.2280. The price has bounced from this level multiple times and is expected to bounce again.
We have a trend towards consolidation above the 100-period moving average, as we are moving close to it, which supports the upward movement.
Entry price: 0.2440
First target: 0.2522
Second target: 0.2630
Third target: 0.2765
Don't forget a simple principle: money management.
Place your stop-loss order below the support zone in green.
For any questions, please leave a comment.
Thank you.

TradeCityPro | FET Testing Key Range, Bears in Control for Now👋 Welcome to TradeCity Pro!
In this analysis, I want to review FET, one of the AI projects, which with a market cap of $558 million is ranked 80th on CoinMarketCap.
⏳ 4-hour timeframe
On the 4-hour timeframe, this coin is ranging between the zones 0.2321 and 0.2652.
💥 The overall trend for FET is currently bearish, but the price is now ranging between these two zones and forming a new structure.
⚡️ After the last time the price reached 0.2652, it got rejected, and volume started decreasing, and it is still decreasing.
✔️ The bottom of the range can also be considered as a support zone. Breaking this zone would be a very good trigger for a short position, and the price could move towards 0.2021 after breaking this level.
🎲 The middle line of the range is at 0.2472, and breaking this level will give us a early long trigger.
✨ The next level we can open the main long position after breaking is 0.2652.
📝 Final Thoughts
Stay calm, trade wisely, and let's capture the market's best opportunities!
This analysis reflects our opinions and is not financial advice.
Share your thoughts in the comments, and don’t forget to share this analysis with your friends! ❤️

M and W formations With LevelsHere we have M formation on top then level 1 to down...level 2....level 3...and W fromation with level 1 to the up now i am expecting Level 2.... pay attention on the vecter candels how they get fully recovered.

$FET bullish setupey traders,
I’m feeling pumped today and bringing you the second analysis of the day. The last time I talked about NYSE:FET I was wrong and the price dropped sharply. This time, backed by my previous analysis on Ethereum dominance, I believe Fetch could perform quite well over the coming months.
Leaving behind the legal issues with Ocean Protocol, it seems the project is about to regain momentum. It has been forming higher lows over the past few weeks, and I’ve noticed some very interesting on-chain accumulation.
Because of that, I think it may enter a small rally in the next few months:
1st target → $0.50
2nd target → $0.80
3rd target → $1.00
As I always say — stay smart and stay calm!
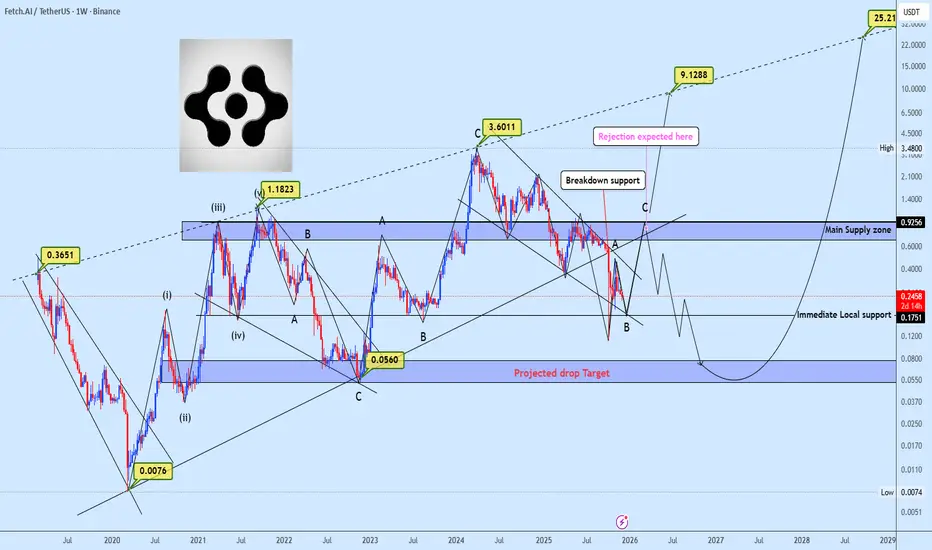
FET/USDT — Decision Point: The 0.21–0.14 Zone That Defined!The FET/USDT weekly chart is revisiting one of the most historically significant zones in its entire price history — the 0.21–0.14 demand block.
This zone is not just a support area. It has consistently acted as the boundary between Accumulation and Capitulation since 2019. Every major FET rally began only after this zone was defended.
And now, price has returned to this zone once again — making this a major decision point for the next macro trend.
---
Why This Zone Matters
The 0.21–0.14 range served as the structural base for the powerful rallies in 2020, 2021, and the AI-driven surge in 2024.
The sharp downside wick below the zone followed by a fast recovery suggests a liquidity grab, hinting that larger players may still be accumulating here.
Price action is forming a compression pattern, a structure that typically precedes explosive breakouts — either up or down.
This is a point where the market rarely stays quiet for long.
---
Technical Structure & Pattern
FET has formed Lower Highs since the 2024 peak → medium-term downtrend still intact.
But price reactions within 0.21–0.14 remain strong, indicating an early-stage reaccumulation pattern.
The wick sweep below the zone resembles a potential Wyckoff Spring, not yet confirmed but clearly visible.
In simple terms:
If this zone holds, a long-term reversal can begin. If it fails, the chart opens the door to a new bearish leg.
---
Bullish Scenario
🔵 1. Demand Holds: “Buyers Take Control”
If the weekly candle closes above 0.21–0.18, it signals that buyers are still defending this historical demand block.
A stronger confirmation appears once price reclaims 0.30, the nearest structural resistance.
➡️ Bullish Targets:
0.30 → short-term confirmation
0.50 – 0.60 → mid-range resistance
0.90 – 1.50 → major recovery zone
2.50 – 3.40 → full cycle retracement if the AI narrative reignites
This would frame the 0.21–0.14 zone as a macro reaccumulation base before the next expansion phase.
---
Bearish Scenario
🔴 1. Clean Breakdown: “Demand Fails”
A weekly close below 0.14 would invalidate the entire multi-year structure.
If that happens:
the demand block collapses,
bearish continuation becomes highly likely,
and the chart enters a deeper macro range.
➡️ Bearish Targets:
0.10 – 0.07 → historical liquidity zone from 2019–2020
Further downside becomes possible if momentum accelerates
A breakdown below 0.14 would turn FET into a completely new market structure.
---
Key Insight
FET is currently sitting on a zone that has defined every major trend shift for the past 5 years.
The next weekly closes will determine whether we are entering:
a Phase B Accumulation → new macro rally, or
a structural breakdown → multi-month bearish continuation.
This is the calm before a major move — and the 0.21–0.14 zone remains the battlefield.
---
#FETUSDT #FetchAI #CryptoAnalysis
#KeyLevel #DecisionPoint #WeeklyChart #CryptoTA
#SupportZone #Wyckoff #SmartMoneyConcepts #AINarrative

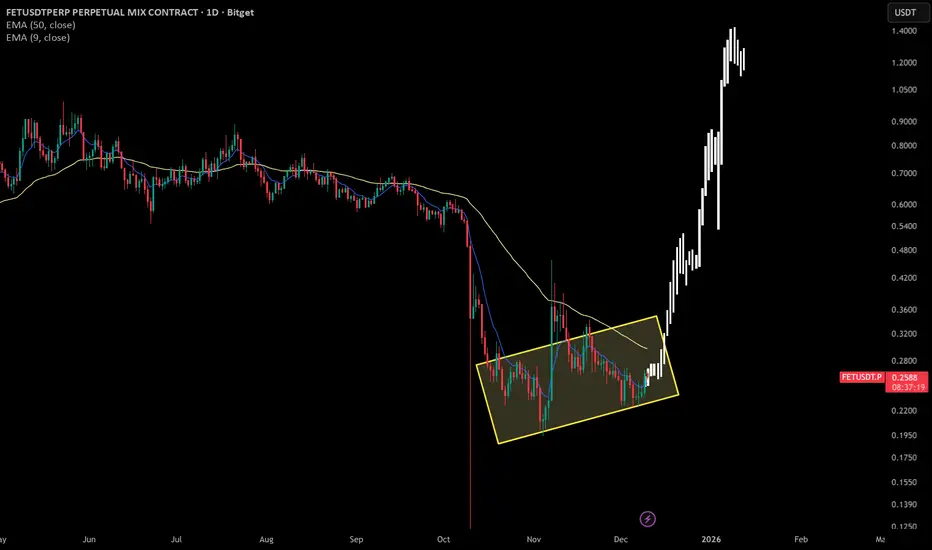
Rising Wedge Breakdown on FETUSDT Retest Before Next MoveFETUSDT has completed a classical rising wedge distribution which triggered a clean breakdown into the $0.53 zone, shifting the short term structure from demand led momentum into corrective flow.
Price is now trading beneath the major support that previously served as demand, turning it into an active supply zone. Current structure favors planning around the pullback any relief rally back into the supply area offers an ideal region to monitor for rejection and continuation of the corrective leg.
However, a decisive breakout and acceptance above the supply zone would invalidate the immediate bearish thesis and open the door for bullish continuation, with the market attempting to resume trend as clearly outlined on the chart.
$FET USDT 4H CHART UPDATE 📌 NYSE:FET USDT is currently seeing a short-term price increase ✅
📌 NYSE:FET could turn BEARISH again from the STRONG Resistance above. Be careful of that RANGE 🔥✅

FETUSDT 12H#FET is moving inside a bullish flag on the 12H timeframe. It is currently facing the flag resistance and the 12H SMA100. In case of a breakout above the flag, the potential targets are:
🎯 $0.2879
🎯 $0.3268
🎯 $0.3582
🎯 $0.3897
🎯 $0.4344
🎯 $0.4914
❌ Invalidation: a 12H candle closing below the flag support line.
⚠️ Always remember to use a tight stop-loss and maintain proper risk management.


FET/USDT Accumulating for a Wave 2FET/USDT is accumulating for a potential Wave 2, with price holding in a support zone while trading volume has increased significantly, signaling stronger buying interest.

FETUSDTThe overall trend of BINANCE:FETUSDT remains bearish as long as the price stays below the major moving averages. However, a potential bullish correction could start if buyers defend the key demand zone around $0.2100. A break above $0.3400 would strengthen bullish momentum and shift focus toward higher resistance targets.
Supports
$0.2100
$0.1120
Resistances
$0.3400
$0.5500
$0.7800

FET 🚨📊 FET Update
FET has also formed a new resistance zone in red 🔴.
This level is now acting as a strong ceiling,
and price must break out above this red resistance
to show any real bullish momentum again.
Until that breakout happens,
sellers remain in control and upside stays limited.

FET Bullish Flag Breakout Near Liquidity Zone Hints FET - the price has reached the liquidity zone marked in purple, moving within a bullish flag pattern.
It is more likely that the movement will continue toward the upper boundary of the pattern.
Current price: $0.2608
If the price reaches below the purple area, it is more likely that the price will continue its downward movement without rebounding upward.
Full breakdown on website

TradeCityPro | FETUSDT Ready for a Move!
👋 Welcome to TradeCityPro!
In this analysis, I want to review the FET coin, one of the crypto projects in the artificial intelligence sector, with a $635 million market cap and currently ranked 78th on CoinMarketCap.
🌐 Bitcoin Overview
Before we begin, let me remind you once again that at your request, we’ve moved the Bitcoin analysis section to a dedicated daily report — allowing us to analyze Bitcoin’s trend, dominance, and overall market sentiment in greater depth each day.
In the 4-hour timeframe, after bouncing from 0.2331, price made a sharp move upward toward 0.3835, where it began a corrective phase.
At the moment, price is ranging inside the 0.2673 – 0.2895 box, and it is expected that the market will soon break out of this consolidation zone and finally decide its direction.
For a long position, due to multiple rejections and repeated touches around 0.2895, a breakout above this level—combined with the existing bullish structure behind it—would provide a logical long-entry setup.
For a short position, since 0.2673 is our daily support, a break below this level—accompanied by increasing volume and bearish momentum—would give us a valid trigger to open a short position.
📝 Final Thoughts
Stay calm, trade wisely, and let's capture the market's best opportunities!
This analysis reflects our opinions and is not financial advice.
Share your thoughts in the comments, and don’t forget to share this analysis with your friends! ❤️

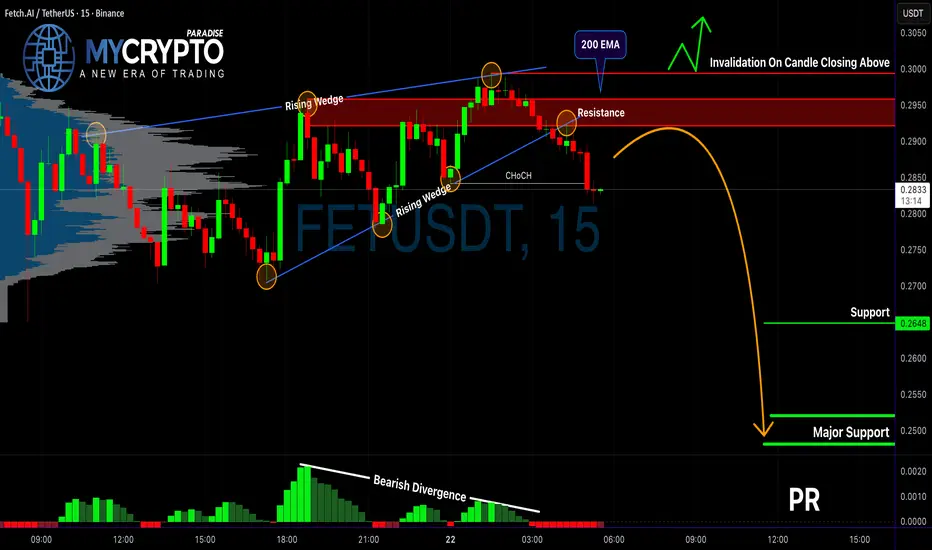
FET Breakdown: Is a Major Dump Just Getting Started?Yello, Paradisers! Have you seen what just happened on FET/USDT? The chart is flashing multiple warning signs, and if you’re not paying close attention, you could get caught on the wrong side of the next big move. Let’s break it down.
💎FETUSDT has officially broken out of a rising wedge pattern—a well-known bearish structure. This breakdown didn’t happen in isolation. It was accompanied by a clear bearish divergence, showing that while the price pushed higher, the underlying momentum was already fading. That’s a red flag for anyone still thinking bullish.
💎More importantly, price action has shown a bearish Change of Character (CHoCH), confirming a potential shift in the trend direction. On top of that, the recent rejection came precisely from the 200 EMA and a known resistance zone, both of which have historically acted as key turning points. When these factors align, they significantly increase the probability of a deeper move to the downside.
💎If the price pulls back from here, the smarter move is to wait for a bearish candlestick pattern to form right at the resistance zone. That would give a cleaner entry with stronger confirmation and a higher reward-to-risk ratio. While aggressive traders may be tempted to enter from current levels—where a 1:1 RR still exists—this is not a sustainable strategy over the long run. Discipline and patience are key if you want to stay consistently profitable.
💎However, if the price breaks out above our invalidation level and closes with conviction, the bearish setup becomes invalid. In that case, it’s best to step aside and wait for more favorable price action to form. There’s no need to rush; missing a trade is always better than forcing one with poor structure.
🎖Strive for consistency, not quick profits. Treat the market as a businessman, not as a gambler.
MyCryptoParadise
iFeel the success🌴
FET reached my buy levelsAlmost two years ago, I shared the idea of buying back FET at 20 cents while the price was still above $2. Since then, FET has indeed retraced more than 96% from its all-time high, and during the biggest liquidation event in crypto history we even tagged 10 cents.
The volume on this last pump confirmed my view that we may have formed a bottom here. From a risk-reward perspective, the setup for FET to at least reach the buy-side liquidity around $1.70 looks extremely attractive. No FA of course :)

FETNYSE:FET is showing a clean descending wedge pattern and the structure points to a potential 1000 percent move from the current price. Based on the compression and timing of the setup, this breakout looks like it can happen before June 6. Momentum is loading.
