Artificial Superintelligence (FET): Expecting a Strong BounceFET is coming back into the same support zone where we previously saw a very strong and volatile reaction from buyers. That area already gave us a sharp move up before, so this zone clearly matters.
If price reacts again from here and buyers start stepping in, we could be looking at a similar high-
Related pairs

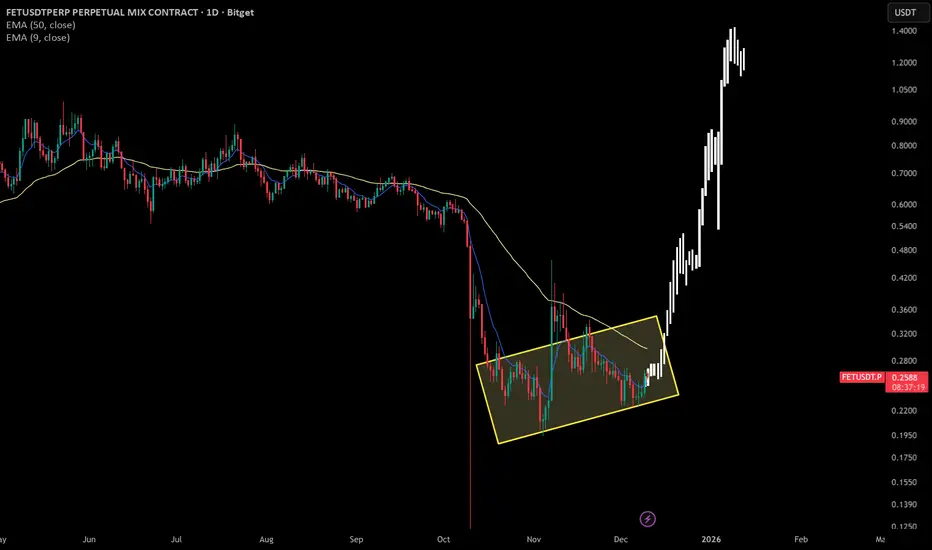
FET/USDT – Long Trade Setup (Daily)FET/USDT – Long Trade Setup (Daily)
Price forming a base after a strong downtrend
Falling wedge/compression near support
Price below cloud, but selling pressure weakening
Long Plan
Entry Zone: 0.19 – 0.205
Stop Loss: 0.1840
Targets:
T1: 0.26
T2: 0.32
T3: 0.37+
DYOR | NFA

FETUSDT have liquidity at 0.2007 possible to drop to that area after liquidity and then climb towards 0.26

FETCH – Weekly AnalysisFETCH is currently trading at a key HTF support zone that has acted as
support → resistance → support multiple times in the past.
Price is also compressing against a descending trendline, which increases the probability of a volatility expansion.
Key observations:
Strong historical support around

FETUSDT – Trade ideaFET has shown a local market structure shift (MSS) and is currently pulling back into a key demand zone.
This setup aligns with a TOTAL Market Cap MSS on the 4H, supporting a broader bullish continuation scenario.
Bias
As long as price holds above demand, a bounce and continuation higher is favored

FET long term analysisin long term, after bitcoin meet 65000 to 68000 $, FET token can raise from 0.09 to 0.1 zone to 1$ and more.

#FET/USDT bullish momentum#FET
The price is moving in a descending channel on the 1-hour timeframe. It has reached the lower boundary and is heading towards breaking above it, with a retest of the upper boundary expected.
We have a downtrend on the RSI indicator, which has reached near the lower boundary, and an upward reb

TradeCityPro | FET Testing Key Range, Bears in Control for Now👋 Welcome to TradeCity Pro!
In this analysis, I want to review FET, one of the AI projects, which with a market cap of $558 million is ranked 80th on CoinMarketCap.
⏳ 4-hour timeframe
On the 4-hour timeframe, this coin is ranging between the zones 0.2321 and 0.2652.
💥 The overall trend for FET is

M and W formations With LevelsHere we have M formation on top then level 1 to down...level 2....level 3...and W fromation with level 1 to the up now i am expecting Level 2.... pay attention on the vecter candels how they get fully recovered.

$FET bullish setupey traders,
I’m feeling pumped today and bringing you the second analysis of the day. The last time I talked about NYSE:FET I was wrong and the price dropped sharply. This time, backed by my previous analysis on Ethereum dominance, I believe Fetch could perform quite well over the coming months.
See all ideas
Summarizing what the indicators are suggesting.
Oscillators
Neutral
SellBuy
Strong sellStrong buy
Strong sellSellNeutralBuyStrong buy
Oscillators
Neutral
SellBuy
Strong sellStrong buy
Strong sellSellNeutralBuyStrong buy
Summary
Neutral
SellBuy
Strong sellStrong buy
Strong sellSellNeutralBuyStrong buy
Summary
Neutral
SellBuy
Strong sellStrong buy
Strong sellSellNeutralBuyStrong buy
Summary
Neutral
SellBuy
Strong sellStrong buy
Strong sellSellNeutralBuyStrong buy
Moving Averages
Neutral
SellBuy
Strong sellStrong buy
Strong sellSellNeutralBuyStrong buy
Moving Averages
Neutral
SellBuy
Strong sellStrong buy
Strong sellSellNeutralBuyStrong buy
Displays a symbol's price movements over previous years to identify recurring trends.
Frequently Asked Questions
The current price of FETUSDT SPOT (FET) is 0.2131 USDT — it hasn't changed in the past 24 hours. Try placing this info into the context by checking out what coins are also gaining and losing at the moment and seeing FET price chart.
FETUSDT SPOT price has risen by 2.83% over the last week, its month performance shows a −17.18% decrease, and as for the last year, FETUSDT SPOT has decreased by −83.78%. See more dynamics on FET price chart.
Keep track of coins' changes with our Crypto Coins Heatmap.
Keep track of coins' changes with our Crypto Coins Heatmap.
FETUSDT SPOT (FET) reached its highest price on Mar 28, 2024 — it amounted to 3.4803 USDT. Find more insights on the FET price chart.
See the list of crypto gainers and choose what best fits your strategy.
See the list of crypto gainers and choose what best fits your strategy.
FETUSDT SPOT (FET) reached the lowest price of 0.0527 USDT on Nov 22, 2022. View more FETUSDT SPOT dynamics on the price chart.
See the list of crypto losers to find unexpected opportunities.
See the list of crypto losers to find unexpected opportunities.
The safest choice when buying FET is to go to a well-known crypto exchange. Some of the popular names are Binance, Coinbase, Kraken. But you'll have to find a reliable broker and create an account first. You can trade FET right from TradingView charts — just choose a broker and connect to your account.
Crypto markets are famous for their volatility, so one should study all the available stats before adding crypto assets to their portfolio. Very often it's technical analysis that comes in handy. We prepared technical ratings for FETUSDT SPOT (FET): today its technical analysis shows the sell signal, and according to the 1 week rating FET shows the sell signal. And you'd better dig deeper and study 1 month rating too — it's sell. Find inspiration in FETUSDT SPOT trading ideas and keep track of what's moving crypto markets with our crypto news feed.
FETUSDT SPOT (FET) is just as reliable as any other crypto asset — this corner of the world market is highly volatile. Today, for instance, FETUSDT SPOT is estimated as 3.76% volatile. The only thing it means is that you must prepare and examine all available information before making a decision. And if you're not sure about FETUSDT SPOT, you can find more inspiration in our curated watchlists.
You can discuss FETUSDT SPOT (FET) with other users in our public chats, Minds or in the comments to Ideas.