FLOKI/USDT – Big Rebound or Structural Breakdown?Timeframe: 5 Day
Market Condition: After a strong parabolic rally, FLOKI has entered a macro correction and distribution phase
Price is currently trading at a critical decision zone that will determine whether the macro bullish trend continues or shifts into a bearish structure
---
🟨 Key Suppo
Related pairs

Long trade 🟢 FLOKIUSDT — Institutional Buyside Expansion Setup (1H)
Market: FLOKIUSDT Perpetual
Timeframe: 1H
Session: Tokyo PM → London → NY
5.00 pm
Model: AMD (Accumulation → Manipulation → Distribution)
📌 TRADE DETAILS
Type: Buyside Trade
Entry: 0.00004768
Stop: 0.00004719 (-1.03%)
Target: 0.00005290 (+10.

Long trade
🟦 TAB 1 — TRADE DETAILS
Pair: FLOKIUSDT
Direction: 🟩 Buy-side
Entry: 0.00004531
Take Profit: 0.00005294 (+16.84%)
Stop Loss: 0.00004475 (-1.23%)
Risk–Reward: 13.62R
Session: NY PM
2️⃣ TAB 2 — AMD MODEL (
A-Leg — Accumulation
Sell-side liquidity taken at 0.0000417
Volume climax + stopping action

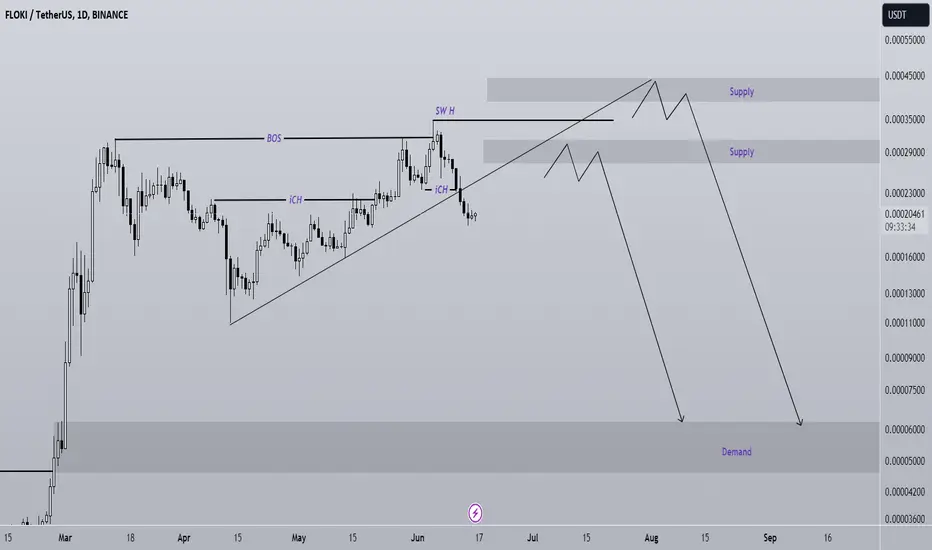
FLOKI analysisAfter the bearish iCH in the internal structure, the price has created an internal pullback.
A trend line has also been broken, but the bullish momentum is very high. FLOKI's bearish trend is expected to be created from one of the two specified supplies.
By maintaining the resistance swap range, i
Floki (FLOKI): Buyers Showing Some Kind of Reaction Near SupportFLOKI is showing a decent reaction near the local support zone, which again confirms the validity of this area. As long as buyers keep holding this zone, the game plan stays the same.
If they manage to pull off a clean BOS from here, we’ll be looking for a long setup and aim for a retest of the 100

#FLOKI/USDT – Trading Signal & Technical Analysis#FLOKI
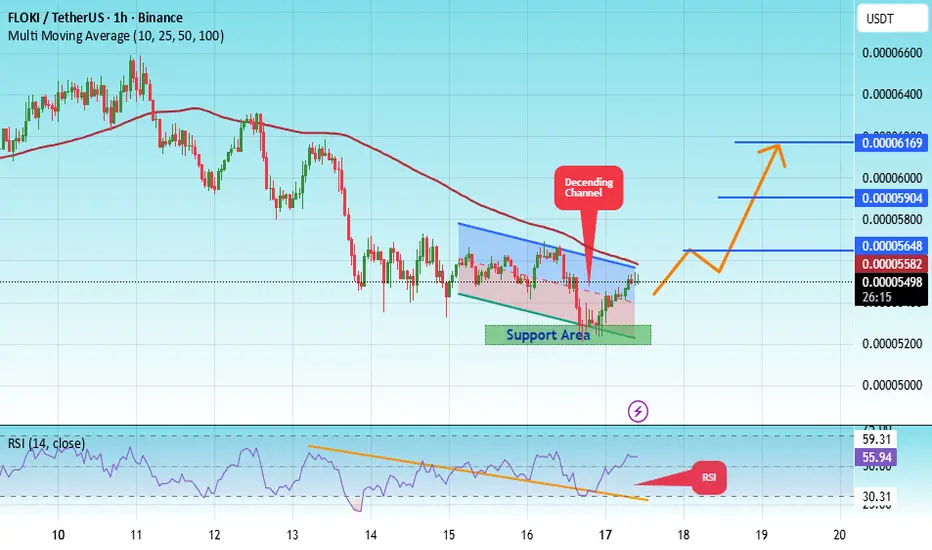
The price is moving within an ascending channel on the 1-hour timeframe and is adhering to it well. It is poised to break out strongly and retest the channel.
We have a downtrend line on the RSI indicator that is about to break and retest, which supports the upward move.
There is a key sup
FLOKI : BUY MARKETHello friends
According to the technical analysis carried out, we can say that with the entry of buyers, it is possible to enter into a transaction with risk and capital management and move towards the specified goals.
*Trade safely with us*

Wave 3 Loading? FLOKI Prepares for Potential Upside ContinuationFLOKIUSDT is trading within an ascending channel, recently rejecting from the upper boundary near $0.00034416. Price has since entered a prolonged consolidation phase, forming a descending broadening wedge.
The current focus remains on the $0.00020188 region; a breakout from this level would valid

Floki (FLOKI): Waiting For Breakout from EMAsFLOKI is showing a clear turnover here — buyers are slowly switching the trend and testing the EMAs again. What we want to see now is a clean EMA reclaim; that would confirm buyers have proper control. If that happens, the next upside move could aim toward the liquidity zones above.
Good momentum

FLOKIUSDT 3D#FLOKI is moving inside a descending channel on the 3-day timeframe chart and is currently trading above the midline of the channel, which increases the likelihood of a bullish move. Consider buying here and near the support level at $0.00005967.
In case of a breakout above the channel resistance a

See all ideas
Summarizing what the indicators are suggesting.
Oscillators
Neutral
SellBuy
Strong sellStrong buy
Strong sellSellNeutralBuyStrong buy
Oscillators
Neutral
SellBuy
Strong sellStrong buy
Strong sellSellNeutralBuyStrong buy
Summary
Neutral
SellBuy
Strong sellStrong buy
Strong sellSellNeutralBuyStrong buy
Summary
Neutral
SellBuy
Strong sellStrong buy
Strong sellSellNeutralBuyStrong buy
Summary
Neutral
SellBuy
Strong sellStrong buy
Strong sellSellNeutralBuyStrong buy
Moving Averages
Neutral
SellBuy
Strong sellStrong buy
Strong sellSellNeutralBuyStrong buy
Moving Averages
Neutral
SellBuy
Strong sellStrong buy
Strong sellSellNeutralBuyStrong buy
Displays a symbol's price movements over previous years to identify recurring trends.
Curated watchlists where FLOKIUSDT is featured.

Memecoins: Top meme tokens
10 No. of Symbols
See all sparks
Frequently Asked Questions
The current price of FLOKI / Tether USD (FLOKI) is 0.00005737 USDT — it has risen 19.57% in the past 24 hours. Try placing this info into the context by checking out what coins are also gaining and losing at the moment and seeing FLOKI price chart.
FLOKI / Tether USD price has risen by 43.39% over the last week, its month performance shows a 15.88% increase, and as for the last year, FLOKI / Tether USD has decreased by −70.70%. See more dynamics on FLOKI price chart.
Keep track of coins' changes with our Crypto Coins Heatmap.
Keep track of coins' changes with our Crypto Coins Heatmap.
FLOKI / Tether USD (FLOKI) reached its highest price on Jun 5, 2024 — it amounted to 0.00034865 USDT. Find more insights on the FLOKI price chart.
See the list of crypto gainers and choose what best fits your strategy.
See the list of crypto gainers and choose what best fits your strategy.
FLOKI / Tether USD (FLOKI) reached the lowest price of 0.00000482 USDT on Jun 19, 2022. View more FLOKI / Tether USD dynamics on the price chart.
See the list of crypto losers to find unexpected opportunities.
See the list of crypto losers to find unexpected opportunities.
The safest choice when buying FLOKI is to go to a well-known crypto exchange. Some of the popular names are Binance, Coinbase, Kraken. But you'll have to find a reliable broker and create an account first. You can trade FLOKI right from TradingView charts — just choose a broker and connect to your account.
Crypto markets are famous for their volatility, so one should study all the available stats before adding crypto assets to their portfolio. Very often it's technical analysis that comes in handy. We prepared technical ratings for FLOKI / Tether USD (FLOKI): today its technical analysis shows the buy signal, and according to the 1 week rating FLOKI shows the sell signal. And you'd better dig deeper and study 1 month rating too — it's sell. Find inspiration in FLOKI / Tether USD trading ideas and keep track of what's moving crypto markets with our crypto news feed.
FLOKI / Tether USD (FLOKI) is just as reliable as any other crypto asset — this corner of the world market is highly volatile. Today, for instance, FLOKI / Tether USD is estimated as 24.42% volatile. The only thing it means is that you must prepare and examine all available information before making a decision. And if you're not sure about FLOKI / Tether USD, you can find more inspiration in our curated watchlists.
You can discuss FLOKI / Tether USD (FLOKI) with other users in our public chats, Minds or in the comments to Ideas.