FORMUSDT Forming Falling WedgeFORMUSDT is forming a clear falling wedge pattern, a classic bullish reversal signal that often indicates an upcoming breakout. The price has been consolidating within a narrowing range, suggesting that selling pressure is weakening while buyers are beginning to regain control. With consistent volum

FORMUSDT Forming Falling WedgeFORMUSDT is forming a clear falling wedge pattern, a classic bullish reversal signal that often indicates an upcoming breakout. The price has been consolidating within a narrowing range, suggesting that selling pressure is weakening while buyers are beginning to regain control. With consistent volum

FORMThe chart shows a clear bearish downtrend. After a strong uoward move where the price reached the area around 3,8-4,0USDT , a rapid decline followed with several consecutive red condles. The current price is around 0,53 USDT meaning it has lost more than 85% of its value from the peak - a clear sing

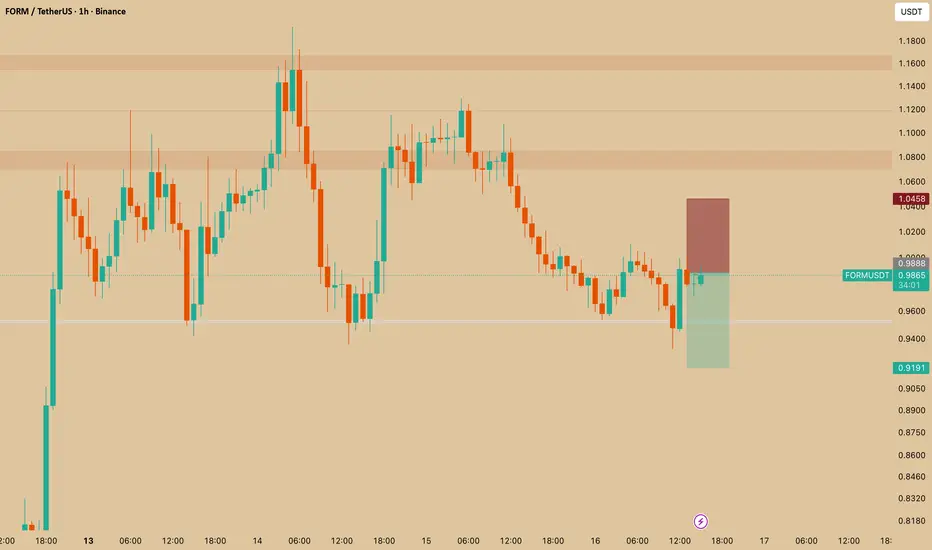
FORM SHORT1. Chart Context
Pair: FORM/USDT
Timeframe: 1h
Current Price: ≈ 0.9868 USDT
The market recently dropped from resistance zones and is now retesting.
2. Trade Setup
This is a short entry, expecting the price to fall again after rejection:
Entry Zone: Around 0.98–0.99 USDT (current consolidation area).
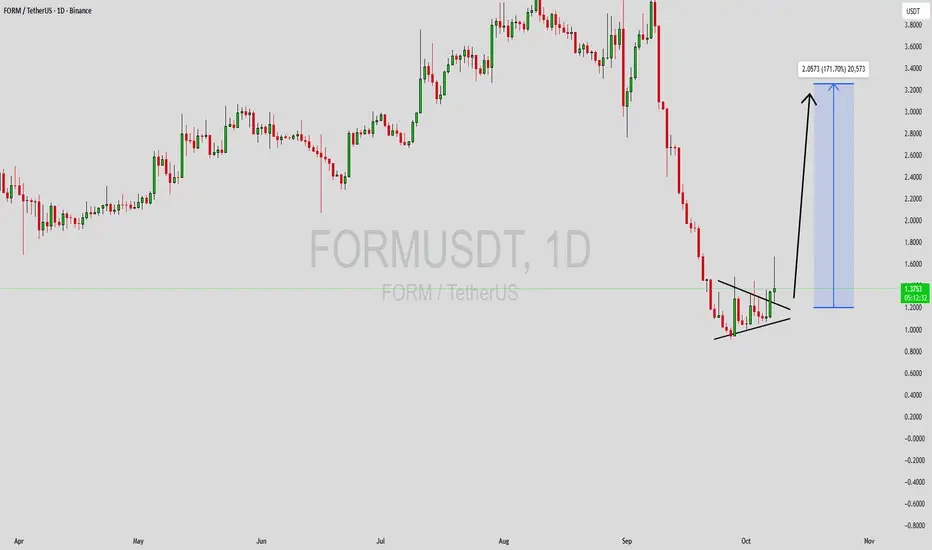
FORMUSDT Forming Bullish ContinuationFORMUSDT is forming a classic bullish continuation pattern, often seen as a strong bullish reversal signal. This pattern typically represents a period of consolidation before a major upward breakout, and FORM appears to be nearing that crucial breakout zone. The price action has shown decreasing vol
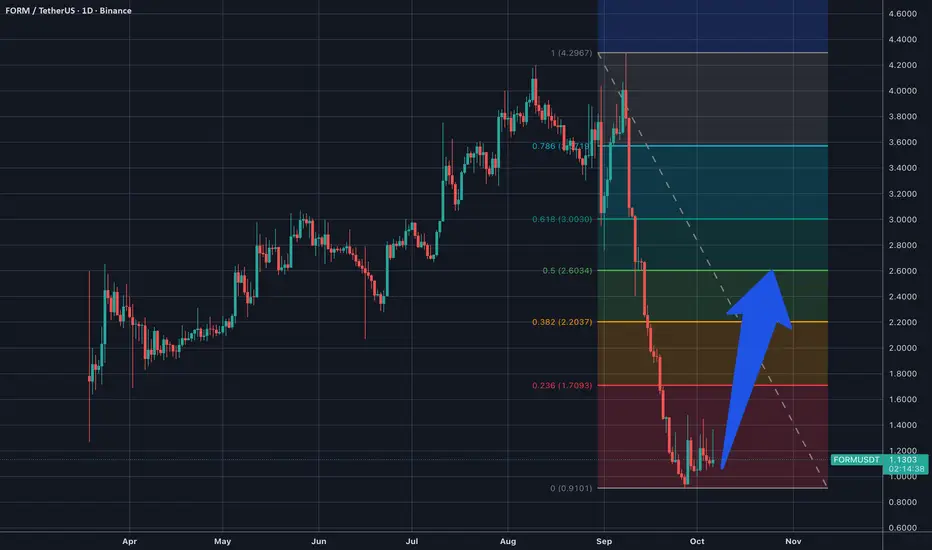
FORMUSDT 1D#FORM has likely found its bottom, and on the daily chart we can see a bullish divergence on the RSI. We expect an upward move toward the following targets:
🎯 $1.4414
🎯 $1.8841
🎯 $2.2419
🎯 $2.5996
🎯 $3.1090
🎯 $3.7578
⚠️ Always remember to use a tight stop-loss and maintain proper risk management.

FORMUSDT Forming Falling WedgeFORMUSDT is displaying a powerful **falling wedge pattern**, a formation often recognized as one of the most reliable bullish reversal indicators in technical analysis. After a period of consolidation and gradual price compression, the pair seems ready to break out from this structure with increasin
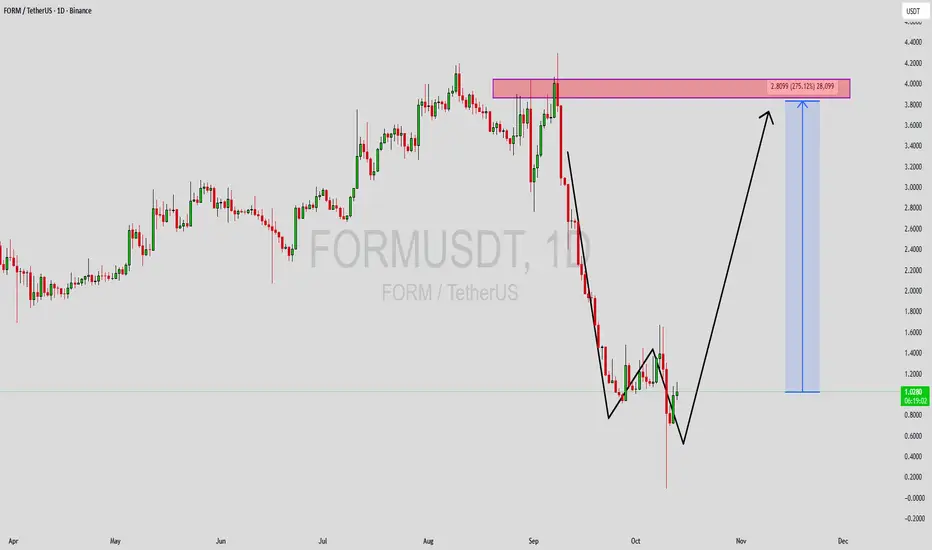
FORM looks interesting after the dropThe FORM token has pulled back quite a bit but seems to be holding strong above the $0.90 level.
I believe it has potential to make a move up to around $3, though I’ll be satisfied closing the position once it reaches that target.
As always — everyone trades at their own risk.
I share my trades
FORMUSDT Forming Bullish PennantFORMUSDT is displaying a strong bullish pennant pattern on the chart — a continuation setup that typically forms after a significant upward move, followed by a brief consolidation before another potential rally. The current structure suggests that bulls are maintaining control while the price takes

FORMUSDT UPDATE#FORM
UPDATE
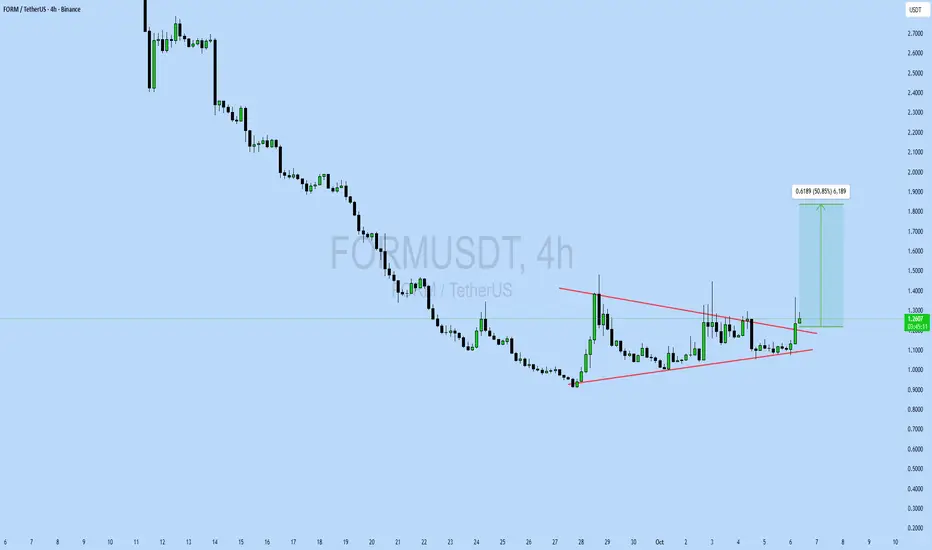
FORM Technical Setup
Pattern: Bullish falling wedge pattern
Current Price: $1.23
Target Price: $1.85
Target % Gain: 50.85%
NASDAQ:FORM is breaking out of a falling wedge pattern on the 4H timeframe. Current price is $1.23 with a target near $1.85, showing about 50% potential upside
See all ideas
Summarizing what the indicators are suggesting.
Oscillators
Neutral
SellBuy
Strong sellStrong buy
Strong sellSellNeutralBuyStrong buy
Oscillators
Neutral
SellBuy
Strong sellStrong buy
Strong sellSellNeutralBuyStrong buy
Summary
Neutral
SellBuy
Strong sellStrong buy
Strong sellSellNeutralBuyStrong buy
Summary
Neutral
SellBuy
Strong sellStrong buy
Strong sellSellNeutralBuyStrong buy
Summary
Neutral
SellBuy
Strong sellStrong buy
Strong sellSellNeutralBuyStrong buy
Moving Averages
Neutral
SellBuy
Strong sellStrong buy
Strong sellSellNeutralBuyStrong buy
Moving Averages
Neutral
SellBuy
Strong sellStrong buy
Strong sellSellNeutralBuyStrong buy