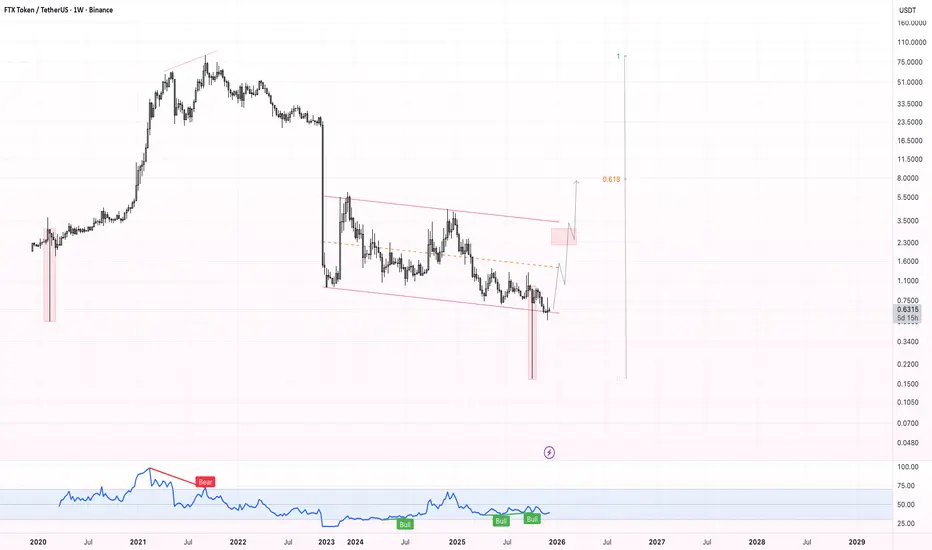
FTT – Potential Reversal Structure 2$->8$The chart shows a clear bullish divergence forming on the weekly timeframe, which aligns with the structure seen during the major 2020 shakeout. Once again, the price was pushed below the long-term descending channel, triggering an aggressive stop-hunt before quickly reclaiming the range — a cla
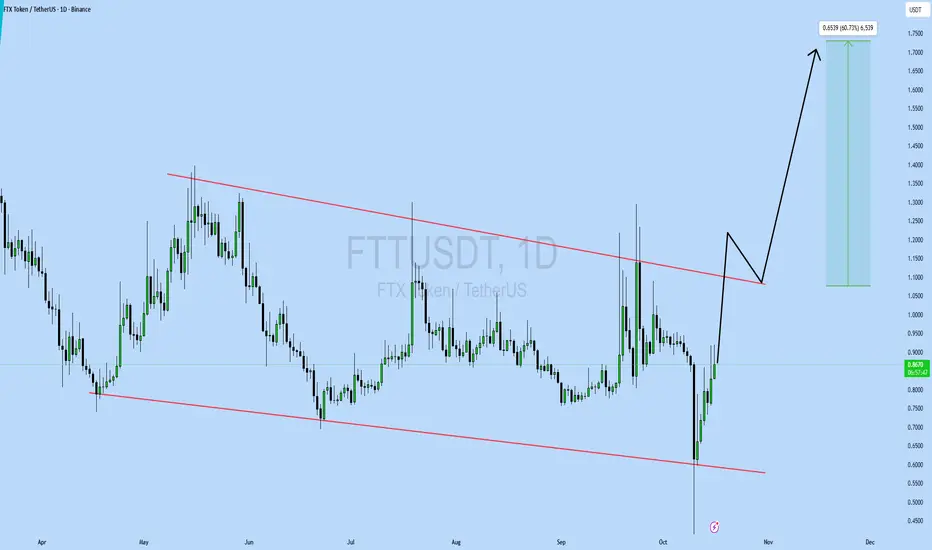
FTTUSDT 1D#FTT is moving inside a falling wedge pattern on the daily chart. It has just bounced off the wedge support. In case of a breakout above the pattern resistance, the potential targets are:
🎯 $0.9398
🎯 $1.2029
🎯 $1.4155
🎯 $1.6281
🎯 $1.9309
❌ Invalidation: a daily candle closing below the wedge.
⚠️

FTT NEXT TARGET ?🔥 #FTT Update :
FTT is moving inside a falling wedge, and it has just tapped a very strong demand zone near the 0.786 Fibonacci level — a classic area for big reversals.
First bounce target: $0.8337
Main upside target: $0.9849
As long as FTT holds above the marked demand zone, a bullish reversal

FTTUSDT – new accumulation in an interesting zone🚨 This information is intended for thoughtful market participants who are willing to work in this field - not for those chasing gambling, guesswork, or getting stuck in news flow.
Price has returned to the support zone of the outer horizontal channel. Accumulation is currently taking place in this

FTT/USDT – The Final Accumulation Zone Before a Major Move?FTT’s price is once again testing the critical support zone (0.88–0.70), which has served as the final stronghold for buyers for more than a year.
Each touch of this area has triggered a bounce, yet the strength of each rebound has weakened over time — signaling consistent selling pressure from the

Hi, I see A very good Swing trade opportunityHi, I see A very good Swing trade opportunity
Risk Reward is very good
Some of you will say FTT is doomed, will I am a chart analyst, and there is a very good sign of accumulation in the chart.
The SL is around the corner (-15%) with almost 700% possible gain , so it worth the risk.
good luck ever

TTUSDT Forming Falling WedgeFTTUSDT is currently forming a falling wedge pattern, a bullish reversal setup that often signals a strong breakout ahead. This pattern indicates that selling pressure is fading, while buyers are gradually regaining control. The price has been consolidating within a narrowing range, and with good tr

FTTUSDT UPDATE#FTT
UPDATE
FTT Technical Setup
Pattern: Bullish falling wedge pattern
Current Price: $0.870
Target Price: $1.523
Target % Gain: 60.73%
TSX:FTT is breaking out of a bullish falling wedge pattern on the 1D timeframe. Current price is $0.870 with a potential target near $1.523, showing around 60%
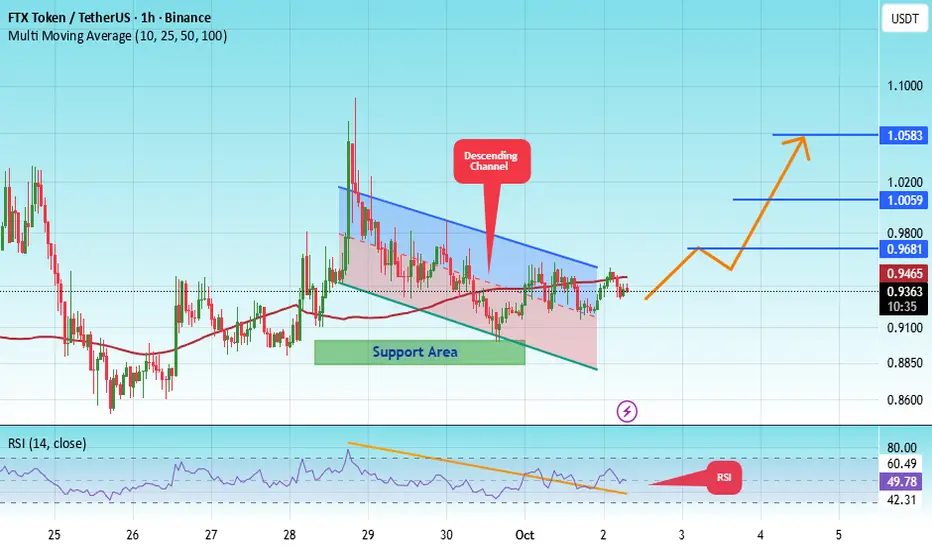
#FTT/USDT : Go to work, it's good#FTT
The price is moving within a descending channel on the 1-hour frame, adhering well to it, and is heading for a strong breakout and retest.
We have a bearish trend on the RSI indicator that is about to be broken and retested, which supports the upward breakout.
There is a major support area i
#FTX/USDT Breakout soon#FTX
The price is moving within an ascending channel on the 1-hour frame, adhering well to it, and is on track to break it strongly upwards and retest it.
We have support from the lower boundary of the ascending channel, at 0.8800.
We have a downtrend on the RSI indicator that is about to break a

See all ideas
Summarizing what the indicators are suggesting.
Oscillators
Neutral
SellBuy
Strong sellStrong buy
Strong sellSellNeutralBuyStrong buy
Oscillators
Neutral
SellBuy
Strong sellStrong buy
Strong sellSellNeutralBuyStrong buy
Summary
Neutral
SellBuy
Strong sellStrong buy
Strong sellSellNeutralBuyStrong buy
Summary
Neutral
SellBuy
Strong sellStrong buy
Strong sellSellNeutralBuyStrong buy
Summary
Neutral
SellBuy
Strong sellStrong buy
Strong sellSellNeutralBuyStrong buy
Moving Averages
Neutral
SellBuy
Strong sellStrong buy
Strong sellSellNeutralBuyStrong buy
Moving Averages
Neutral
SellBuy
Strong sellStrong buy
Strong sellSellNeutralBuyStrong buy