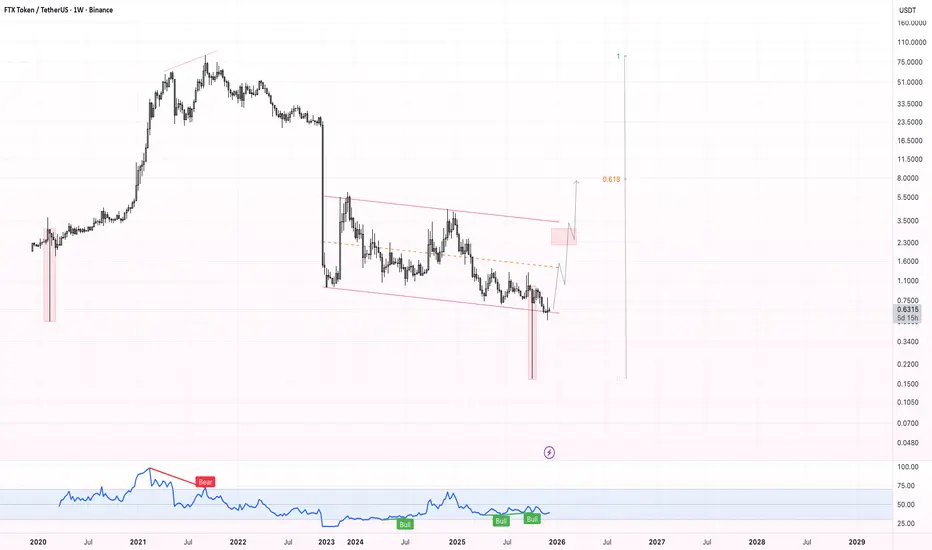
FTT – Potential Reversal Structure 2$->8$The chart shows a clear bullish divergence forming on the weekly timeframe, which aligns with the structure seen during the major 2020 shakeout. Once again, the price was pushed below the long-term descending channel, triggering an aggressive stop-hunt before quickly reclaiming the range — a classic deviation pattern.
If the asset still hasn’t been delisted despite everything that happened, it suggests that there may be underlying reasons for keeping the token alive. Markets often move ahead of headlines, so a sudden fundamental catalyst shouldn’t be ruled out. Some traders even speculate about potential legal or regulatory news related to the former FTX leadership, which could shock the market if it appears unexpectedly. Whether this materializes or not, the technical structure alone remains notable.
From a TA perspective:
Price has printed a bullish divergence on the weekly RSI.
A long-term falling channel remains intact, with price bouncing off its lower boundary.
A shakeout similar to 2020 may have cleared late sellers and leveraged shorts.
If momentum continues, the first target zone sits around $2–3, aligning with local resistance.
The main structural target is a retest of the 0.618 Fibonacci retracement of the major decline from $8 — a level that often acts as a magnet in recovery phases.
This setup remains speculative and highly volatile, but the technical picture suggests a potential medium-term relief rally if the market continues to absorb sell pressure.
Trade ideas
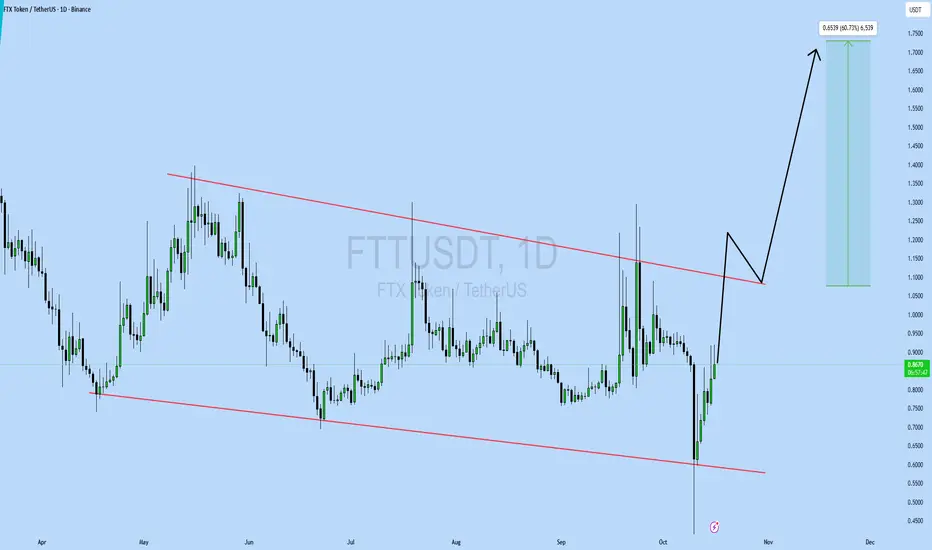
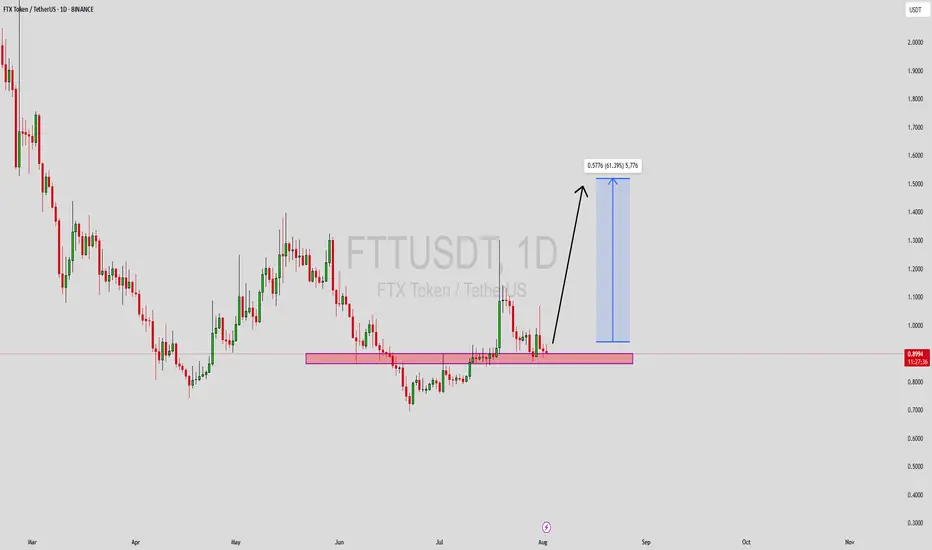
FTTUSDT 1D#FTT is moving inside a falling wedge pattern on the daily chart. It has just bounced off the wedge support. In case of a breakout above the pattern resistance, the potential targets are:
🎯 $0.9398
🎯 $1.2029
🎯 $1.4155
🎯 $1.6281
🎯 $1.9309
❌ Invalidation: a daily candle closing below the wedge.
⚠️ Always remember to use a tight stop-loss and maintain proper risk management.

FTT NEXT TARGET ?🔥 #FTT Update :
FTT is moving inside a falling wedge, and it has just tapped a very strong demand zone near the 0.786 Fibonacci level — a classic area for big reversals.
First bounce target: $0.8337
Main upside target: $0.9849
As long as FTT holds above the marked demand zone, a bullish reversal is the most likely outcome 📈🔥

FTTUSDT – new accumulation in an interesting zone🚨 This information is intended for thoughtful market participants who are willing to work in this field - not for those chasing gambling, guesswork, or getting stuck in news flow.
Price has returned to the support zone of the outer horizontal channel. Accumulation is currently taking place in this area.
📰 FTX is preparing for its third round of distributions - $1.9 billion, expected around September 30. Marked it on the chart. Whether they shift the date or not, the essence remains unchanged.
Possible scenarios:
1️⃣ A double bottom forms in the lower zone of the channel, with a pattern range of about 60%.
👇
- - - - - - - - - - - - - - - - - - - - - - - - - - - - - - - - - - - - - - - - - - - - - - - - -
2️⃣ Another option is a descending wedge, followed by a breakout on volume, a retest of the breakout zone, and further continuation.
👇
- - - - - - - - - - - - - - - - - - - - - - - - - - - - - - - - - - - - - - - - - - - - - - - - -
3️⃣ Next scenario: sideways consolidation within the current zone, with an inner range of 40% and outer range of 90%, followed by a breakout and movement toward the main targets of the larger channel.
👇
- - - - - - - - - - - - - - - - - - - - - - - - - - - - - - - - - - - - - - - - - - - - - - - - -
❗ I marked the downward (protective) zones on the chart that should be taken into account for each of the proposed scenarios — to align with your strategy. This is important. First the plan - then action.
👇
- - - - - - - - - - - - - - - - - - - - - - - - - - - - - - - - - - - - - - - - - - - - - - - - -
📌 P.S. In fact, everything is simpler than it seems.
I believe time is a key factor.
The main thing is to be ready for different scenarios before the final move.
There’s nothing to guess here.
Even if you add another pattern, it won’t change the core idea.

FTT/USDT – The Final Accumulation Zone Before a Major Move?FTT’s price is once again testing the critical support zone (0.88–0.70), which has served as the final stronghold for buyers for more than a year.
Each touch of this area has triggered a bounce, yet the strength of each rebound has weakened over time — signaling consistent selling pressure from the upper levels.
The lower-high structure formed since 2024 highlights medium-term bearish dominance. However, the most recent weekly candle closed back above the demand area after briefly dipping to 0.5130 — a strong indication of massive liquidity absorption from weak hands.
This suggests that the yellow zone is not just a technical support level, but rather a psychological battlefield between capitulating sellers and silent accumulators.
---
Technical Structure and Pattern
A Range Base Pattern has formed at the bottom, where price remains trapped between the 1.23 supply zone and the 0.88–0.70 demand area.
A False Breakdown (Spring Phase) is clearly visible — potentially marking the beginning of a re-accumulation phase.
However, as long as the price fails to break and close above 1.2378, the overall structure remains neutral with a bearish bias.
---
Bullish Scenario
If FTT successfully breaks and closes above 1.2378 on the weekly timeframe, it could signal a medium-term trend reversal.
Layered upside targets could extend toward:
1.8574 → 2.2752 → 3.7113 → 5.5686
A confirmed breakout above 1.23 would also mark the transition from a distribution phase to a bullish expansion phase, opening room for a potential recovery rally similar to the one seen in 2023–2024.
---
Bearish Scenario
However, if selling pressure intensifies and the weekly candle closes below 0.70, it would confirm a loss of structural support, opening the door to a deeper downside move.
A breakdown below 0.70 could drive price toward the extreme liquidity zone below 0.35, where new buyers might emerge for a possible long-term bottom reaccumulation.
---
Conclusion
FTT currently stands at the most critical equilibrium zone in its historical price action.
Each weekly candle in this area carries the potential for a major reaction — either as the beginning of a new recovery, or the final descent before long-term restructuring.
Momentum is building quietly.
Those who hold through this zone might witness the early stages of a major shift, while latecomers may only watch the rebound from afar.
---
#FTT #FTTUSDT #CryptoAnalysis #MarketStructure #SwingSetup #WeeklyChart #AltcoinAnalysis #AccumulationZone #BreakoutWatch #LiquiditySweep #CryptoTechnicalAnalysis

Hi, I see A very good Swing trade opportunityHi, I see A very good Swing trade opportunity
Risk Reward is very good
Some of you will say FTT is doomed, will I am a chart analyst, and there is a very good sign of accumulation in the chart.
The SL is around the corner (-15%) with almost 700% possible gain , so it worth the risk.
good luck every one

TTUSDT Forming Falling WedgeFTTUSDT is currently forming a falling wedge pattern, a bullish reversal setup that often signals a strong breakout ahead. This pattern indicates that selling pressure is fading, while buyers are gradually regaining control. The price has been consolidating within a narrowing range, and with good trading volume returning to the market, the setup looks primed for a potential breakout to the upside. If the momentum continues, a 90% to 100%+F gain could be achievable in the coming weeks.
The falling wedge formation on FTTUSDT suggests that accumulation may already be underway, with smart money positioning early before the next major move. Once the resistance trendline is broken with strong volume confirmation, the pair could experience a surge in bullish momentum. Traders are closely monitoring this zone, as the breakout could mark the start of a fresh uptrend, reversing the previous downtrend that dominated the chart.
Investor interest in FTTUSDT has been steadily growing as optimism returns to the broader crypto market. Technical indicators are showing encouraging signs, with volume expansion hinting at increased participation. If market sentiment remains positive, this setup could offer an excellent opportunity for swing and position traders aiming to capitalize on the next strong bullish leg.
✅ Show your support by hitting the like button and
✅ Leaving a comment below! (What is You opinion about this Coin)
Your feedback and engagement keep me inspired to share more insightful market analysis with you!

FTTUSDT UPDATE#FTT
UPDATE
FTT Technical Setup
Pattern: Bullish falling wedge pattern
Current Price: $0.870
Target Price: $1.523
Target % Gain: 60.73%
TSX:FTT is breaking out of a bullish falling wedge pattern on the 1D timeframe. Current price is $0.870 with a potential target near $1.523, showing around 60% upside potential. The breakout suggests growing bullish pressure and possible continuation toward higher resistance levels.
Time Frame: 1D
Risk Management Tip: Always use proper risk management.
#FTT/USDT : Go to work, it's good#FTT
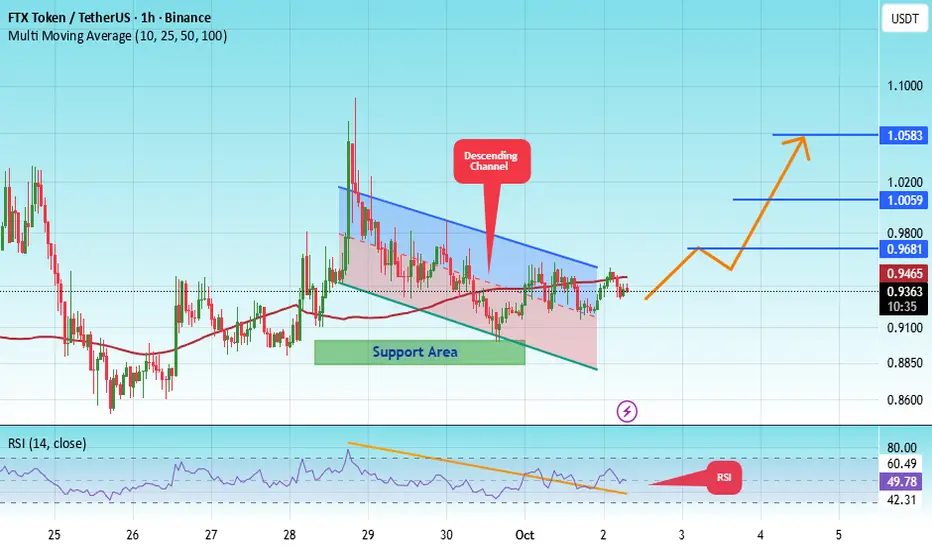
The price is moving within a descending channel on the 1-hour frame, adhering well to it, and is heading for a strong breakout and retest.
We have a bearish trend on the RSI indicator that is about to be broken and retested, which supports the upward breakout.
There is a major support area in green at 0.8890, representing a strong support point.
We are heading for consolidation above the 100 moving average.
Entry price: 0.9360
First target: 0.9681
Second target: 1.000
Third target: 1.0580
Don't forget a simple matter: capital management.
When you reach the first target, save some money and then change your stop-loss order to an entry order.
For inquiries, please leave a comment.
Thank you.
#FTX/USDT Breakout soon#FTX
The price is moving within an ascending channel on the 1-hour frame, adhering well to it, and is on track to break it strongly upwards and retest it.
We have support from the lower boundary of the ascending channel, at 0.8800.
We have a downtrend on the RSI indicator that is about to break and retest, supporting the upside.
There is a major support area in green at 0.8760, which represents a strong basis for the upside.
Don't forget a simple thing: ease and capital.
When you reach the first target, save some money and then change your stop-loss order to an entry order.
For inquiries, please leave a comment.
We have a trend to hold above the 100 Moving Average.
Entry price: 0.8932
First target: 0.9584
Second target: 1.0267
Third target: 1.105
Don't forget a simple thing: ease and capital.
When you reach your first target, save some money and then change your stop-loss order to an entry order.
For inquiries, please leave a comment.
Thank you.

FTTUSDT Forming Falling WedgeFTTUSDT is showing a falling wedge pattern, which is considered one of the strongest bullish reversal setups in technical analysis. This pattern often appears after a downtrend, where price narrows down between two converging trendlines, eventually leading to a breakout to the upside. With good trading volume supporting this structure, the technical outlook suggests that FTT could be preparing for a strong recovery rally.
The expected gain of 70% to 80%+ makes this setup particularly attractive for traders watching for momentum-driven breakouts. A confirmed breakout above the wedge resistance could trigger a sharp move higher, allowing FTTUSDT to reclaim important price levels and potentially spark renewed investor confidence in the market.
Investor interest is already building around this project, and the combination of bullish chart structure with positive sentiment adds to the probability of a breakout. If volume continues to support the move, the upward momentum could accelerate, making FTTUSDT a coin to keep on close watch.
✅ Show your support by hitting the like button and
✅ Leaving a comment below! (What is You opinion about this Coin)
Your feedback and engagement keep me inspired to share more insightful market analysis with you!

FTT BUY!!!Hello friends
According to the market cycle that has been drawn for you, from here according to the cycle we expect a return to the ceiling.
*Trade safely with us*

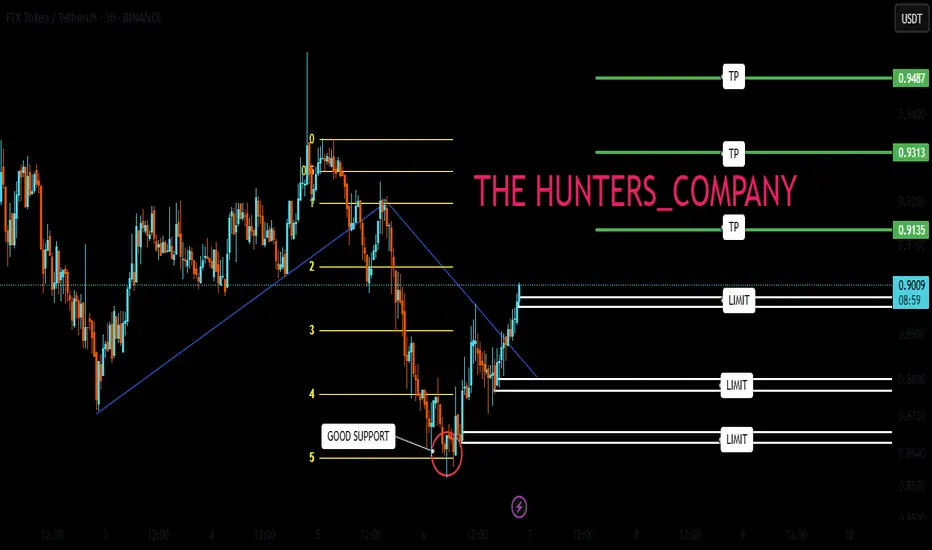
Navigating the $FTX Token Recovery: A 4-Hour Chart InsightBINANCE:FTTUSDT
Navigating the $FTX Token Recovery: A 4-Hour Chart Insight
Price Action Description
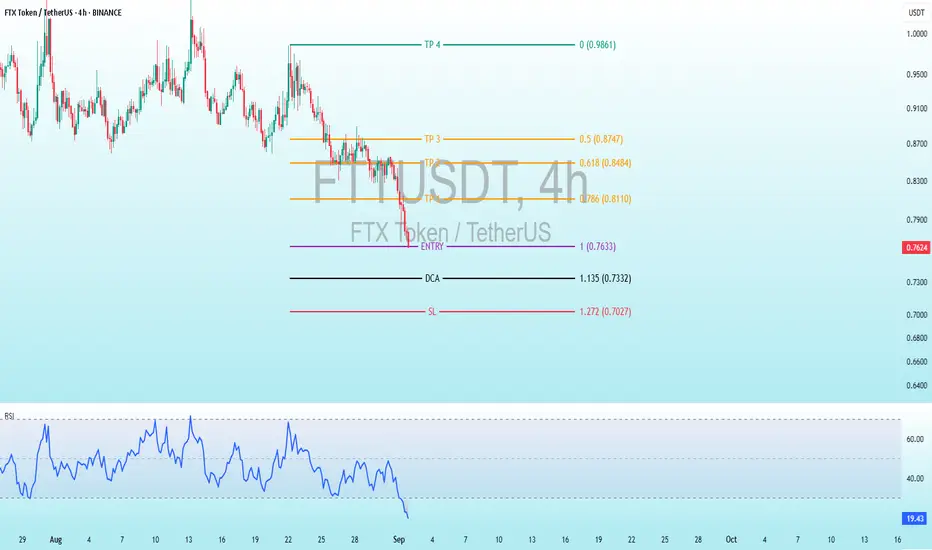
Historical Trend: The price began around 0.09-0.10 USDT in late August, with a choppy uptrend reaching near 0.11 USDT in early September. A sharp decline followed, dropping to the current level of 0.7653 USDT, indicating a significant correction.
Recent Movement: A prominent red candlestick around September 1 marks a drop from approximately 0.10-0.11 USDT to 0.7653 USDT, suggesting strong selling pressure or a market reaction. The price has stabilized near this low, with smaller candles hinting at consolidation.
Current Price: Approximately 0.7653 USDT, down about 20-30% from recent highs, suggesting potential oversold conditions.
Volatility: High, as evident from the long wicks and large candle bodies during the recent drop, though volume data is not visible.
Key Technical Levels
Entry: Set at 0.7633 USDT, the suggested point to enter a long position, very close to the current price of 0.7653 USDT, indicating an immediate buy opportunity with minimal pullback expected.
TP (Take Profit): Targets are 0.0874 USDT for the first profit take, followed by 0.8484 USDT, 0.8110 USDT, and the highest goal at 0.9810 USDT, providing a range of exit points for potential gains.
DCA: Positioned at 0.7332 USDT, a level to add to the trade if the price dips slightly, helping to average down the entry cost.
SL (Stop Loss): Placed at 0.7072 USDT, the cutoff to exit the trade if the price falls, limiting losses and protecting the position.
Fibonacci Context: These levels likely derive from a Fibonacci retracement or extension tool applied to the recent drop from 0.11 USDT to 0.7653 USDT, suggesting a potential reversal zone for a long setup.
Risk-Reward: Risk from 0.7633 to 0.7072 is 0.0561 USDT, with rewards to 0.8110 (0.0477, RR 0.85:1) and up to 0.9810 (0.2177, RR ~3.88:1), indicating a decent setup if the bounce occurs.
Indicators Analysis
RSI (Relative Strength Index): Current value is 19.94, below 30, signaling oversold conditions and a potential rebound. The line has trended downward sharply with the recent drop, showing momentum weakening, but no clear bullish divergence yet. The RSI scale (0-100) marks overbought above 70, not relevant here.
Potential Trading Implications and Risks
Bullish Case: The setup suggests a bottom-fishing opportunity post-drop, supported by oversold RSI. A rebound to take-profit levels is plausible if the broader crypto market stabilizes or if sentiment around FTX Token improves (e.g., legal or exchange-related developments).
Bearish Case: The recent sharp decline and lack of immediate recovery indicate ongoing selling pressure. Breaking below 0.7072 (SL) could lead to further declines toward 0.70 USDT or lower.
Risks: High volatility due to FTT’s history, lack of volume data (limiting liquidity insight), and subjective Fib levels. Use risk management (e.g., 1-2% account risk).
Suggestions: Confirm with bullish patterns (e.g., hammer) at 0.7633 or RSI crossing above 30.
FTTFtt usdt daily analysis
Time frame daily
Risk rewards ratio =2.5
Target 1.2
Ftt is not a good asset for hold but I think here is a good place to enter and take a good benefit in short time

FTT : Go to work, it's goodHello friends🙌
✅after the decline we had, you can see that the price was supported by buyers in the support area we identified with Fibonacci and broke its resistance.
✅Now you can buy in the support areas we have identified for you with risk and capital management and move towards the set goals.
🔥Follow us for more signals🔥
*Trade safely with us*
FTTUSDT Forming Bullish MomentumFTTUSDT is showing renewed strength with a clean breakout setup, supported by good volume and strong technical structure. The current chart reveals a clear horizontal support zone that has been tested multiple times and held firmly, indicating buyers are stepping in with confidence. After the recent consolidation, the price appears ready to move higher, potentially offering a 40% to 50% upside in the near term. This setup attracts attention from technical traders looking for confirmation through volume spikes and bullish candlestick formations.
What makes this chart setup even more compelling is the emerging bullish momentum following the reclaim of a key support area. The market has seen a steady accumulation phase, and the subsequent price action shows strength above the highlighted zone, suggesting a possible retest and continuation to the upside. With investor sentiment improving around FTX Token (FTT) and increasing market activity, the possibility of a significant rally becomes more likely, especially if price closes firmly above recent resistance levels.
Investors are taking interest in this project again despite past uncertainties, as the price action begins to signal recovery potential. The projected target from this setup points toward a measured move that aligns well with a 40%+ gain, assuming the broader market remains favorable. It's a promising opportunity for mid-term traders watching for bullish continuations backed by strong volume and sentiment.
If this breakout sustains, FTTUSDT could regain traction as a high-risk, high-reward play. Watching how the price behaves around the current support and near-term resistance will be critical for short-term traders aiming to capitalize on this potential upside.
✅ Show your support by hitting the like button and
✅ Leaving a comment below! (What is You opinion about this Coin)
Your feedback and engagement keep me inspired to share more insightful market analysis with you!
FTTUSDT at the Edge! Breakdown or Massive Breakout?📌 Overview: A Rebirth from the Dead Zone
FTT/USDT is currently in one of its most technically compelling phases in the past two years. After suffering a catastrophic 98% crash following the collapse of the FTX ecosystem in 2022, price action now shows signs of long-term accumulation at a historically strong demand zone — potentially forming a solid base for a medium to long-term recovery.
The crucial support zone between $0.70 and $0.90 has been tested multiple times since late 2022 and has consistently held against extreme sell pressure. This suggests the presence of a strong historical demand area. Now that the price is once again reacting bullishly from this zone, the door is opening for a potential technical rebound.
---
🧠 Forming Pattern: Accumulation & Bottoming Structure
1. Base Accumulation Range:
A long period of sideways movement after the major crash.
Indicates exhaustion of selling pressure and possible stealth accumulation by smart money.
2. Potential Double Bottom or Rounded Bottom:
If this rebound holds, a double bottom could be confirmed with a breakout above $1.238.
A rounded bottom formation could signal a major reversal rally if backed by volume and catalysts.
---
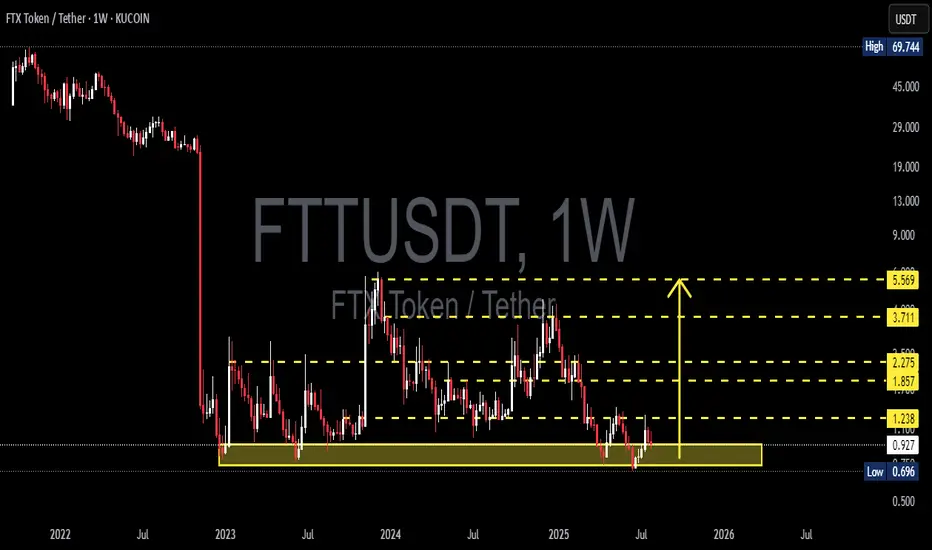
🟢 Bullish Scenario (Reversal in Progress):
If buyers hold the current support and push through resistance levels:
🔓 Break above $1.238 = key reversal confirmation.
🚀 Potential bullish targets:
$1.857 – Previous minor resistance.
$2.275 – Former breakout zone.
$3.711 – Key structural level with historical liquidity.
$5.569 – Major psychological and technical target.
Strong confirmation if the breakout is supported by volume and a full-bodied weekly candle.
---
🔴 Bearish Scenario (Further Downside):
If price fails to hold the support zone:
📉 A breakdown below $0.696 would invalidate the bullish setup and could lead to:
New price discovery below $0.50
A potential “death spiral” if sell volume increases rapidly.
This scenario is extreme and would heavily depend on broader market sentiment and the future of the FTX recovery process.
---
🧭 Key Levels & Technical Insights:
Element Details
Strong Demand Zone $0.70 – $0.90 (multi-tested since 2022)
Bullish Trigger Level Break & retest of $1.238 with volume
Reversal Targets $1.857, $2.275, $3.711, and $5.569
Bearish Breakdown Loss of $0.696 = potential for new lows
Early Momentum Current bounce suggests possible start of reversal
---
💡 Final Thoughts:
> "FTT is no longer in a panic phase — it’s in a decision phase: will it rise as a ‘Phoenix Token’ from the ashes of FTX, or fall back into obscurity?"
Given the technical setup and long-term structure, this could be one of the most pivotal moments for FTT. Traders and investors should watch this level closely — the next major move is likely to begin from this very zone.
#FTTUSDT #FTTAnalysis #CryptoReversal #AltcoinWatch #TechnicalAnalysis #SupportResistance #BullishSetup #BearishScenario #DoubleBottom
FTTUSDT 1D#FTT has formed a falling wedge pattern on the daily chart.
For a bullish scenario to play out, it must break above the resistance cluster, which includes the wedge resistance, the Ichimoku Cloud, and the daily SMA100, with strong volume.
If that happens, the potential targets are:
🎯 $1.1623
🎯 $1.4424
🎯 $1.6475
🎯 $1.9046
🎯 $2.2782
🎯 $2.6517
⚠️ As always, use a tight stop-loss and apply proper risk management.

Is FTT token about to print a 400% move?On the above 5 day chart price action has corrected over 70% throughout 2024. A number of reasons now exist to be bullish. They include:
1) Price action and RSI resistance breakouts.
2) Trend reversal. Notice the higher low?
3) The trend reversal follows strong bullish divergence, which has now confirmed.
4) Look left. Notice where the higher low is printing? On past resistance. Excellent.
5) Lastly the bull flag, it has broken out and confirmed support. The flagpole forecasts a 400% move.
Is it possible price action continues to correct? Sure.
Is it probable? No.
Ww

FTT Breakout soonWaiting for breakout this resistant line
You can buy some after breakout with a short -term target of at least 10%+.

FTTUSDT 1D AnalysisFTT ~ 1D Analysis
#FTT Buy gradually from here if you still have a Conviction on this coin with a short -term target of at least 15%+ from here.


FTT - LongThe main target is $1.89, the waiting time is 1-3 months, the asset analysis is kept secret
(Not an investment recommendation)
