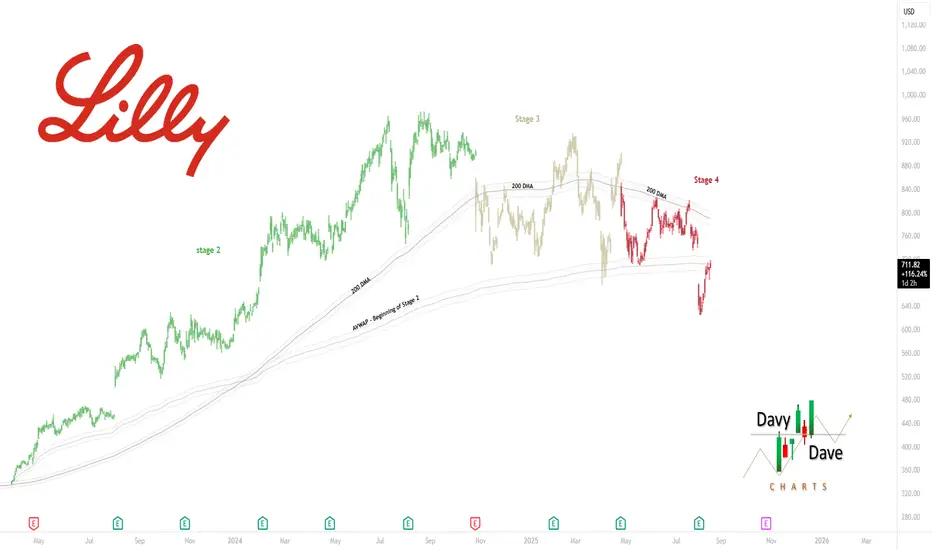
Still in Mark-Down stageBelow the 200 DMA and the VWAP anchored to the stage 2 mark-up start. I don't think we're at the accumulation stage yet. Not even close.
Next report date
—
Report period
—
EPS estimate
—
Revenue estimate
—
12.8 EUR
10.23 B EUR
43.51 B EUR
848.58 M
About Eli Lilly and Company
Sector
Industry
CEO
David A. Ricks
Website
Headquarters
Indianapolis
Founded
1876
FIGI
BBG000F48MY0
Eli Lilly & Co. engages in the discovery, development, manufacture, and sale of pharmaceutical products. The firm's products consist of diabetes, oncology, immunology, neuroscience, and other products and therapies. The company was founded by Eli Lilly in May 1876 and is headquartered in Indianapolis, IN.
Related stocks
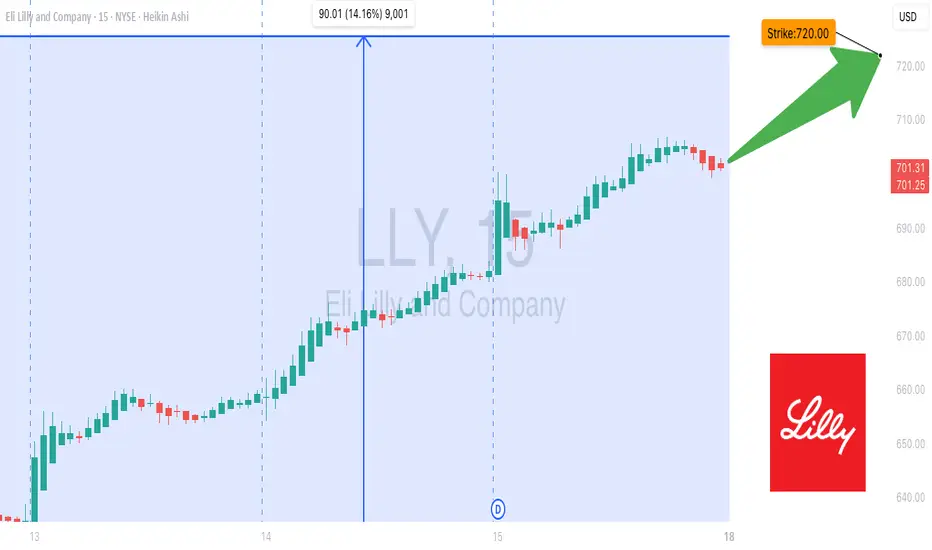
LLY $720 Call Setup: Don’t Miss Out on This Breakout Play!🚀 LLY Weekly Options Analysis (2025-08-17) 🚀
### 🔎 Comprehensive Multi-Model Insights
**Grok/xAI Report**
* 📊 RSI: Neutral (Daily & Weekly \~46)
* 📈 Flow: Call/Put = **3.87 (Bullish bias)**
* 🔊 Volume: Weak vs. previous weeks → ⚠️ no strong institutional support
* 🛑 Trade: **No entry** (weak conf
Red Pill or Blue Pill?Red Pill first - let’s stick to some harsh realities, but using technical analysis only.
Why the harsh crash?
We were rejected at the Value Area high at $972, followed by another rejection at the 0.786 Fibonacci level at $916, along with the top of the flag pattern of this giant bull flag. This wa

LLY eyes on $635.82: Major fib may hold earnings + news CRASHLLY earnings plus some GLP news tanked the stock.
But the crash came to an abrupt halt at a Genesis fib.
Look for a bounce but expect bears at the Golden's above.
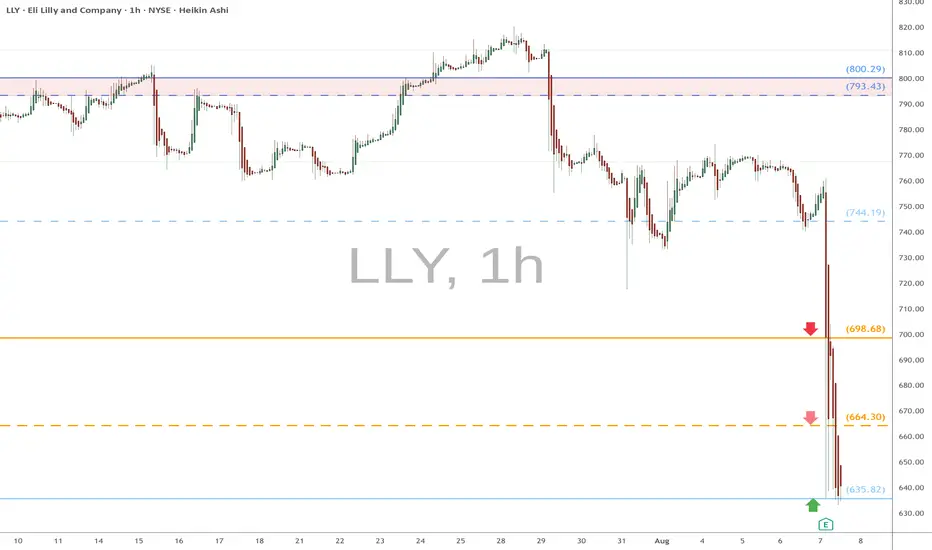
LLY AUG-2025Eli Lilly ( NYSE:LLY ) rebounded strongly from the 640 support zone after institutional absorption. Price is now targeting the gap at 740, aligning with prior distribution levels. Sustained momentum above 700 could drive continuation into 737–740. Failure to hold above 640 risks a deeper move into t

LLY - Clean LevelsBull flag patten on the LLY weekly Chart. The base of the flag/channel has been reactive so far although with low volume (See previously boxed LLY chart) off the top of the recent boxed range.
If you look at the previous chart, you will see that LLY is currently floating up through a low volume n
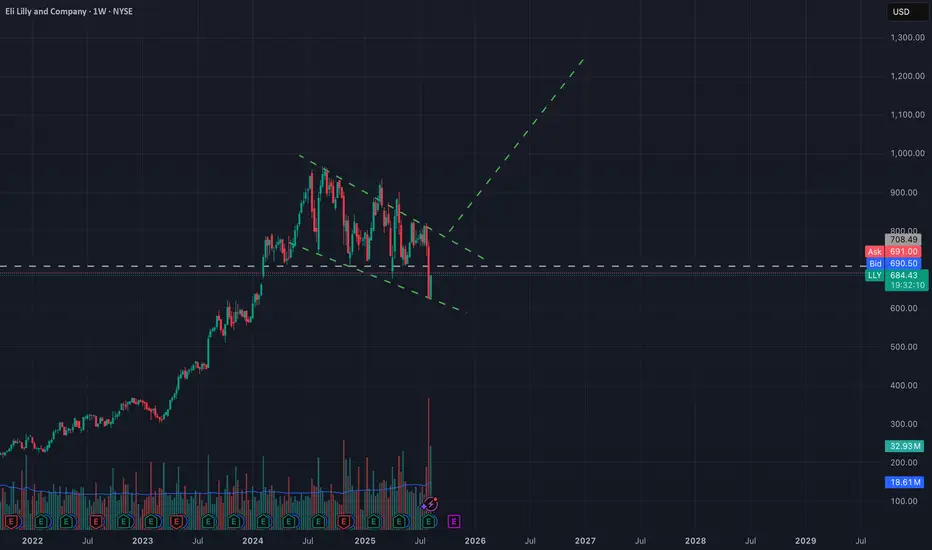
$LLY buying below $709 is grand! Hope you buy more <3 ULong-Term Bullish Analysis for Eli Lilly (LLY)
Fundamental Strength
LLY has demonstrated exceptional financial growth over the past several years:
Revenue Growth: Q2 2025 revenue increased 38% year-over-year to $15.6B, showing accelerating growth
Earnings Expansion: EPS has grown from $2.11 in Q2

LLY \$687.50 Call – One-Day High-Momentum Play🚀 LLY \$687.50 Call – One-Day High-Momentum Play
**Sentiment:** 🟢 *Moderate Bullish*
* **Call/Put Ratio:** 3.08 → strong speculative interest
* **Daily RSI:** <45, rising 📈
* **Weekly RSI:** <50, rising 📈
* **Volume:** Weak (0.9× last week) → limited institutional support
* **VIX:** <15 → favorabl

Eli Lilly (LLY) – Pharma Giant at a Key Price LevelHi,
Eli Lilly & Co. is one of the world’s largest pharmaceutical companies, founded in 1876 and headquartered in Indianapolis. It operates in over 125 countries and is best known for blockbuster treatments in diabetes, obesity, oncology, and immunology. Recent growth has been driven largely by its

Eli Lilly (LLY) Weekly Chart – Double Top Patterns & Major SuppoLLY has formed consecutive double top patterns within a broad descending channel.
Price recently tested a long-term major support zone and bounced strongly, signaling renewed buying interest. If this momentum holds, a move toward the major resistance near $973 is possible, aligning with the upper

See all ideas
Summarizing what the indicators are suggesting.
Neutral
SellBuy
Strong sellStrong buy
Strong sellSellNeutralBuyStrong buy
Neutral
SellBuy
Strong sellStrong buy
Strong sellSellNeutralBuyStrong buy
Neutral
SellBuy
Strong sellStrong buy
Strong sellSellNeutralBuyStrong buy
An aggregate view of professional's ratings.
Neutral
SellBuy
Strong sellStrong buy
Strong sellSellNeutralBuyStrong buy
Neutral
SellBuy
Strong sellStrong buy
Strong sellSellNeutralBuyStrong buy
Neutral
SellBuy
Strong sellStrong buy
Strong sellSellNeutralBuyStrong buy
Displays a symbol's price movements over previous years to identify recurring trends.
LLY4099975
Eli Lilly and Company 4.65% 15-JUN-2044Yield to maturity
—
Maturity date
Jun 15, 2044
LLY6003092
Eli Lilly and Company 5.1% 12-FEB-2035Yield to maturity
—
Maturity date
Feb 12, 2035
LLY5750405
Eli Lilly and Company 4.7% 09-FEB-2034Yield to maturity
—
Maturity date
Feb 9, 2034
LLY5547404
Eli Lilly and Company 4.875% 27-FEB-2053Yield to maturity
—
Maturity date
Feb 27, 2053
LLY6003397
Eli Lilly and Company 5.6% 12-FEB-2065Yield to maturity
—
Maturity date
Feb 12, 2065
LLY5547406
Eli Lilly and Company 5.0% 27-FEB-2026Yield to maturity
—
Maturity date
Feb 27, 2026
LLY4217068
Eli Lilly and Company 3.7% 01-MAR-2045Yield to maturity
—
Maturity date
Mar 1, 2045
LLY6153507
Eli Lilly and Company 4.25% 15-MAR-2031Yield to maturity
—
Maturity date
Mar 15, 2031
LLY6003480
Eli Lilly and Company 4.55% 12-FEB-2028Yield to maturity
—
Maturity date
Feb 12, 2028
LLY5750031
Eli Lilly and Company 5.0% 09-FEB-2054Yield to maturity
—
Maturity date
Feb 9, 2054
LLY5871803
Eli Lilly and Company 5.05% 14-AUG-2054Yield to maturity
—
Maturity date
Aug 14, 2054
See all LLY bonds
Curated watchlists where LLY is featured.


Frequently Asked Questions
The current price of LLY is 609.1 EUR — it has decreased by −1.03% in the past 24 hours. Watch ELI LILLY stock price performance more closely on the chart.
Depending on the exchange, the stock ticker may vary. For instance, on FWB exchange ELI LILLY stocks are traded under the ticker LLY.
LLY stock has risen by 2.67% compared to the previous week, the month change is a −8.00% fall, over the last year ELI LILLY has showed a −29.17% decrease.
We've gathered analysts' opinions on ELI LILLY future price: according to them, LLY price has a max estimate of 1,020.50 EUR and a min estimate of 578.85 EUR. Watch LLY chart and read a more detailed ELI LILLY stock forecast: see what analysts think of ELI LILLY and suggest that you do with its stocks.
LLY stock is 0.31% volatile and has beta coefficient of 0.67. Track ELI LILLY stock price on the chart and check out the list of the most volatile stocks — is ELI LILLY there?
Today ELI LILLY has the market capitalization of 574.98 B, it has increased by 9.27% over the last week.
Yes, you can track ELI LILLY financials in yearly and quarterly reports right on TradingView.
ELI LILLY is going to release the next earnings report on Oct 30, 2025. Keep track of upcoming events with our Earnings Calendar.
LLY earnings for the last quarter are 5.36 EUR per share, whereas the estimation was 4.75 EUR resulting in a 12.70% surprise. The estimated earnings for the next quarter are 5.39 EUR per share. See more details about ELI LILLY earnings.
ELI LILLY revenue for the last quarter amounts to 13.21 B EUR, despite the estimated figure of 12.48 B EUR. In the next quarter, revenue is expected to reach 13.62 B EUR.
LLY net income for the last quarter is 4.81 B EUR, while the quarter before that showed 2.55 B EUR of net income which accounts for 88.40% change. Track more ELI LILLY financial stats to get the full picture.
Yes, LLY dividends are paid quarterly. The last dividend per share was 1.28 EUR. As of today, Dividend Yield (TTM)% is 0.79%. Tracking ELI LILLY dividends might help you take more informed decisions.
ELI LILLY dividend yield was 0.67% in 2024, and payout ratio reached 44.39%. The year before the numbers were 0.78% and 77.91% correspondingly. See high-dividend stocks and find more opportunities for your portfolio.
As of Aug 25, 2025, the company has 47 K employees. See our rating of the largest employees — is ELI LILLY on this list?
EBITDA measures a company's operating performance, its growth signifies an improvement in the efficiency of a company. ELI LILLY EBITDA is 20.66 B EUR, and current EBITDA margin is 41.75%. See more stats in ELI LILLY financial statements.
Like other stocks, LLY shares are traded on stock exchanges, e.g. Nasdaq, Nyse, Euronext, and the easiest way to buy them is through an online stock broker. To do this, you need to open an account and follow a broker's procedures, then start trading. You can trade ELI LILLY stock right from TradingView charts — choose your broker and connect to your account.
Investing in stocks requires a comprehensive research: you should carefully study all the available data, e.g. company's financials, related news, and its technical analysis. So ELI LILLY technincal analysis shows the sell today, and its 1 week rating is sell. Since market conditions are prone to changes, it's worth looking a bit further into the future — according to the 1 month rating ELI LILLY stock shows the neutral signal. See more of ELI LILLY technicals for a more comprehensive analysis.
If you're still not sure, try looking for inspiration in our curated watchlists.
If you're still not sure, try looking for inspiration in our curated watchlists.