GBP/AUD – 1H chart pattern)...GBP/AUD – 1H chart pattern):
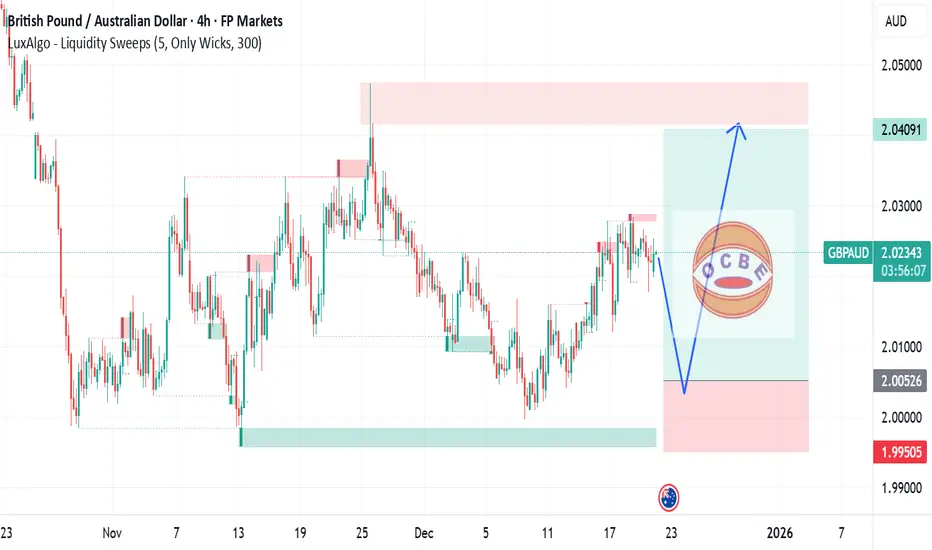
Buy zone: 2.0080 – 2.0100
Target 1: 2.0200
Target 2: 2.0340
Stop Loss: Below 2.0000
Trend shows a pullback with upside continuation toward the marked resistance levels.
If my want short-term scalping targets or a sell setup,
British Pound / Australian Dollar
No trades
Market insights


GBPAUD Trading Idea – Dreams FXDate: December 31, 2025 | Timeframe: 1-Hour
Market Overview & Bias
GBPAUD has been in a downtrend within a descending channel, forming consistent lower highs and lower lows. Price recently swept the channel lows, trapped early sellers, then retraced into the supply zone (~2.01300–2.01600) where heavy rejection is now occurring.
Current candles show strong bearish pressure pushing lower. Bias: Strongly bearish. Single trade setup (Sell) with two scaled take profits — reversal point uncertain, so we scale out inside the demand zone.
Key Technical Confluence
Supply Zone : ~2.01300–2.01600 – multiple rejections (SL at top/end of pink box).
Demand Zone : ~2.00400–2.01000 – next major support (two TPs inside this zone).
Descending Channel: Upper trendline capping upside perfectly.
Single Trade: Bearish Continuation (Sell)
Trade Type: Channel rejection continuation (Sell)
Entry: Sell on current bearish momentum or sell limit inside pink supply zone
Stop Loss: Top/end of pink box (~2.01750–2.01800)
Take Profit (Scaled):
TP1 → Mid/upper teal zone (~2.01000–2.01100) → ~1:2 RR (partial close, lock profit)
TP2 → Bottom/end of teal box (~2.00400–2.00500) → ~1:4 RR (remainder, max target before possible reversal)
Risk-Reward: Overall 1:3+ (blended after scaling).
Risk Management
Risk 0.5–1% total. Close 50% at TP1, move stop to breakeven, let rest run to TP2. Trail if downside momentum stays strong beyond TP1.
Why This Setup Has Edge
Low sweep trapped buyers early, retracement induced longs, now clear distribution and rejection at supply. We don’t know exact reversal depth, so scale TPs inside the teal demand zone — secure early gains, chase the full move. Market whispering strong downside continuation.
Note: Trading involves substantial risk. Past performance is not indicative of future results. Always use proper risk management.
Dreams FX

GBPAUD was bearishIt was bearish all day in New years day, i see that is loosing momentum to the downside in the 4 Hour and possibly reversing soon. I wait on my MacD signal and correlated with candlestick pattern for the entry on a potntial reversal and take out liquidity areas. The 4H, 1H, and 15M timeframes is key right now and once they all correlate together we will look for the bullish move.

Trading GBPAUDI was looking for the bullish move on GBPAUD . The move looked like is already happening few hours before London open. If we can get a pull back on the bullish move, then I would look at the candle patterns for entries. I would enter possibly on my long position, but if it doesn't retrace then look to short it depending on the MOMENTUM and the area of my short position/ Purple rectangle. I would enter with multiple conformations not just because it hit the zone. I would look at the candles and momentum and see how price reacts. This post is for educational purposes, and i post to get me back active on trading view.

GBPAUDWelcome to my TradingView journal.
This analysis is shared strictly for educational and informational purposes, with the objective of documenting market structure, liquidity behavior, and price efficiency from an institutional perspective. Nothing shared here should be interpreted as financial advice or a trading recommendation.
🔍 Structural Overview
Price previously delivered a bullish break of structure (BOS), confirming higher-timeframe intent and signaling strong participation during the expansion phase. However, following this impulsive move, the market transitioned into a corrective delivery, retracing back toward the origin of the displacement.
Such behavior is consistent with institutional rebalancing, where price revisits discounted areas to test unmitigated orders before determining continuation or failure.
🧠 Demand Zone Context
The highlighted demand zone represents a key area where bullish momentum was initiated. This zone is not marked as an entry or signal, but as a reference area where reaction, absorption, or rejection may offer valuable information regarding order-flow strength.
How price behaves within and around this zone is far more important than the zone itself. Acceptance below would suggest weakness, while sustained defense may indicate higher-timeframe continuation remains possible.
⚖️ Expectation Management
Markets operate on probabilities, not certainties.
At this stage, multiple outcomes remain valid:
Price may rebalance and resume higher-timeframe structure
Price may continue lower if demand fails to hold
Price may consolidate as liquidity is redistributed
All conclusions are conditional and remain subject to invalidation by price.
📌 Purpose of This Channel
This space is dedicated to:
Objective structure-based analysis
Liquidity and displacement logic
Patience, discipline, and process
Education over prediction
There will be no signals, no hype, and no promises.
Only clean charts, structured reasoning, and transparent commentary.
If you value professional market insight, rule-based frameworks, and institutional logic, feel free to follow and engage.
Let price reveal the narrative.

GBPAUD WILL GO UP|LONG|
✅GBPAUD is respecting a well-defined rising trendline, with bullish structure intact after shallow pullbacks. Recent consolidation suggests smart money absorption at discount, and sustained acceptance above trend support keeps upside continuation favored toward premium liquidity resting above recent highs. Time Frame 2H.
LONG🚀
✅Like and subscribe to never miss a new idea!✅

#047: Short Investment Opportunity on GBP/AUD
The GBP/AUD exchange rate is currently in a particularly interesting technical phase, characterized by a structure that deserves attention from those who analyze the market with a professional, non-reactive approach. The recent movement displays all the typical characteristics of a corrective rally rather than a genuine directional impulse, suggesting that the market is working more on redistributing liquidity than building a new uptrend.
From a structural perspective, the price is operating in an area definable as "premium," where institutional traders historically tend to reduce long exposures and build opposite positions. The lack of acceleration, combined with a progressive loss of momentum, reinforces the hypothesis that the current movement is incentivizing late retail entry rather than supporting a directional continuation.
Price action analysis highlights signs of absorption at the upper end of the structure. Candlesticks show progressive rejections and the price's inability to consolidate above key areas, a behavior typical of distribution phases. In these contexts, the market does not need to decline immediately: it often trades sideways or with small, controlled increases, precisely to accumulate the liquidity necessary for the next move.
From a volume perspective, the picture is also consistent. Volumes do not convincingly accompany the rise, and the areas of greatest trading are located above the current price, suggesting that the most significant participation occurred in higher areas. This type of configuration tends to favor, over time, a price reversion to underlying areas of inefficiency, where liquidity is not yet fully explored.
Retail sentiment, cross-referenced across multiple sources, appears balanced and free of extremes. This is particularly important: the absence of an unbalanced positioning eliminates the risk of sudden contrarian movements and leaves room for a dynamic driven primarily by the technical structure and liquidity management. In other words, it is not sentiment that drives the market in this phase, but rather the logic of price.
On the macro and intermarket levels, the cross reflects a period of relative uncertainty, with neither currency expressing enough dominance to justify impulsive movements. This reinforces the idea of an environment favorable to mean reversion trades and re-entries toward equilibrium areas, rather than aggressive directional extensions.
In short, GBP/AUD is in a configuration that, from an institutional perspective, is typically associated with distribution phases and potential subsequent corrective movements. As always, the key is not to anticipate the market, but to wait for the price to provide confirmation through the behavior of the candlesticks and the structure. In these contexts, patience and operational discipline make the difference between a theoretically correct analysis and a truly professionally executed trade.
The market shouldn't be chased: it should be read. And when the structure speaks clearly, the trader's job is not to predict, but to recognize.

GBPAUD-Waiting for a Fake Break at Support Price has tested a key support level multiple times, forming an almost range-like structure, while a moderate bullish trend remains in the background.
Technically, long positions can be taken from this support, but my personal preference is to wait for the support to break first and then enter during a fake breakdown.
Even if price rallies directly from this level, I won’t take the trade. Each reaction from this support has become weaker over time, and in my view, only a fake break can properly confirm momentum and provide a cleaner, lower-risk entry.

GBPAUD long movePrice is droppings towards our demand zone, any bullish reaction clouds lead to upwards movement in price.
GBPAUD: Trading Signal From Our Team
GBPAUD
- Classic bullish formation
- Our team expects growth
SUGGESTED TRADE:
Swing Trade
Buy GBPAUD
Entry Level - 2.0161
Sl - 2.0143
Tp - 2.0191
Our Risk - 1%
Start protection of your profits from lower levels
Disclosure: I am part of Trade Nation's Influencer program and receive a monthly fee for using their TradingView charts in my analysis.
❤️ Please, support our work with like & comment! ❤️

GBPAUD SELLThe trend line is breaking. After the price consolidates below the trend line, a decline is expected... Be careful only after complete consolidation and breakdown.

GBP/AUD Forecast: Strategic Divergence & Market ShiftsStrategic Outlook: The Sterling Breakout
The Pound Sterling (GBP) has established a dominant position against the Australian Dollar (AUD) as 2025 closes. This shift represents a fundamental divergence in national economic strategies, not merely market fluctuation. The Bank of England (BoE) executed a "hawkish cut" to 3.75% in December, signaling long-term stability. In contrast, the Reserve Bank of Australia (RBA) remains paralyzed at 3.60% due to persistent inflation. This analysis dissects the geopolitical, technological, and industrial forces driving this volatility.
Macroeconomics: The Central Bank Divergence
The core driver of the GBP/AUD rally lies in contrasting monetary policies. The BoE managed a delicate pivot in December. By cutting rates while warning of inflation, they maintained yield appeal. Markets interpreted this decisiveness as strength, bolstering the Pound. Conversely, the RBA faces a credibility crisis. Australian CPI remains stubbornly high at 3.8%. Yet, the RBA held rates steady, fearing a mortgage cliff. This hesitation signals weakness. The "yield advantage" now firmly favors London over Sydney.
Geopolitics & Geostrategy: Risk Aversion Protocols
Global instability disproportionately harms the Australian Dollar. As a "risk-proxy" currency, the AUD suffers when tensions rise in the Indo-Pacific or Eastern Europe. Investors flee to safe havens or deeper liquidity pools like the GBP. Furthermore, the UK-Australia Free Trade Agreement has matured. While removing tariffs, it exposed Australia’s reliance on raw commodity exports. The UK’s pivot to high-value service exports insulates it better from supply chain disruptions. This structural imbalance currently weighs heavily on the Aussie.
Industry Trends: Services vs. Commodities
The UK economy is evolving faster than its Australian counterpart. Recent data indicates UK Intellectual Property (IP) investment surged by 15%. Britain is successfully transitioning to a high-value "intangible economy." Australia remains tethered to the "rocks and crops" model. While critical minerals are vital, global demand for lithium and iron ore has softened. This cyclical downturn in commodities drags the AUD down. The UK’s service-based resilience offers a more stable platform for currency appreciation.
Technology & Cyber: The Digital Trade Surplus
A hidden driver of Sterling's strength is the UK's dominance in digital services. Britain’s tech sector is leveraging AI to boost productivity. This export of digital solutions creates a "capital account surplus" that supports the GBP. In contrast, Australia faces a "cyber-sovereignty" challenge. As it digitizes mining operations, cybersecurity costs are rising. This increases operational overheads for major Australian firms. Consequently, foreign capital flows are hesitant, preferring the mature tech ecosystem of the UK.
Patent Analysis: The Innovation Gap
Patent filings reveal the future trajectory of these economies. UK firms are filing aggressively in fintech and biotech. This signals future revenue streams protected by global law. Australian innovation remains heavily concentrated in mining technology. While valuable, it is sector-specific. The lack of economic diversity in Australian patent data suggests a rigid business model. Investors prefer the diversified innovation portfolio of the UK, adding a premium to the Pound.
Leadership & Governance: Corporate Resilience
UK corporate leadership has adapted well to the "higher-for-longer" rate environment. FTSE 100 companies have successfully deleveraged balance sheets. This financial prudence attracts institutional investors. Australian management teams face different pressures. The heavy reliance on variable-rate borrowing in Australia squeezes cash flow. Business confidence in Sydney has dipped as leaders brace for potential rate hikes in 2026. This pessimistic corporate sentiment bleeds directly into the currency valuation.
Forecast: The Path to 2026
The immediate outlook for GBP/AUD remains bullish. The pair is likely to test new highs as liquidity thins over the holiday period. Traders should watch for signals of a pause in BoE cuts and critical Q4 inflation data from the RBA. The structural advantages of the UK economy currently outweigh the commodity potential of Australia. Position for continued GBP strength into Q1 2026.

GBPAUD important resistance retest at 2.0323The GBPAUD pair is currently trading with a bearish bias, aligned with the broader downward trend. Recent price action shows a further pullback and the loss of support within the downtrend.
Key resistance is located at 2.0323, a prior consolidation zone. This level will be critical in determining the next directional move.
A bearish rejection from 2.0323 could confirm the resumption of the downtrend, targeting the next support levels at 2.0124, followed by 2.0009 and 1.9927 over a longer timeframe.
Conversely, a decisive breakout and daily close above 2.0323 would invalidate the current bearish setup, shifting sentiment to bullish and potentially triggering a move towards 2.0400, then 2.0470.
Conclusion:
The short-term outlook remains bearish unless the pair breaks and holds above 2.0323. Traders should watch for price action signals around this key level to confirm direction. A rejection favours fresh downside continuation, while a breakout signals a potential trend reversal or deeper correction.
This communication is for informational purposes only and should not be viewed as any form of recommendation as to a particular course of action or as investment advice. It is not intended as an offer or solicitation for the purchase or sale of any financial instrument or as an official confirmation of any transaction. Opinions, estimates and assumptions expressed herein are made as of the date of this communication and are subject to change without notice. This communication has been prepared based upon information, including market prices, data and other information, believed to be reliable; however, Trade Nation does not warrant its completeness or accuracy. All market prices and market data contained in or attached to this communication are indicative and subject to change without notice.

GBPAUDWelcome to my TradingView journal.
This analysis is shared strictly for educational and informational purposes, with the objective of documenting market structure, liquidity behavior, and price efficiency from an institutional perspective. Nothing shared here should be interpreted as financial advice or a trading recommendation.
🔍 Structural Overview
Price previously delivered a bullish break of structure (BOS), confirming higher-timeframe intent and signaling strong participation during the expansion phase. However, following this impulsive move, the market transitioned into a corrective delivery, retracing back toward the origin of the displacement.
Such behavior is consistent with institutional rebalancing, where price revisits discounted areas to test unmitigated orders before determining continuation or failure.
🧠 Demand Zone Context
The highlighted demand zone represents a key area where bullish momentum was initiated. This zone is not marked as an entry or signal, but as a reference area where reaction, absorption, or rejection may offer valuable information regarding order-flow strength.
How price behaves within and around this zone is far more important than the zone itself. Acceptance below would suggest weakness, while sustained defense may indicate higher-timeframe continuation remains possible.
⚖️ Expectation Management
Markets operate on probabilities, not certainties.
At this stage, multiple outcomes remain valid:
•Price may rebalance and resume higher-timeframe structure
•Price may continue lower if demand fails to hold
•Price may consolidate as liquidity is redistributed
All conclusions are conditional and remain subject to invalidation by price.
📌 Purpose of This Channel
•This space is dedicated to:
Objective structure-based analysis
•Liquidity and displacement logic
•Patience, discipline, and process
•Education over prediction
•There will be no signals, no hype, and no promises.
Only clean charts, structured reasoning, and transparent commentary.
If you value professional market insight, rule-based frameworks, and institutional logic, feel free to follow and engage.
Let price reveal the narrative.
Join my Telegram channel for Daily setups and Analysis ⚡️🏆
APEX Global Alpha Traders 💨📈

GBPAUD Welcome to my TradingView journal.
This analysis is shared strictly for educational and informational purposes, with the objective of documenting market structure, liquidity behavior, and price efficiency from an institutional perspective. Nothing shared here should be interpreted as financial advice or a trading recommendation.
🔍 Structural Overview
Price previously delivered a bullish break of structure (BOS), confirming higher-timeframe intent and signaling strong participation during the expansion phase. However, following this impulsive move, the market transitioned into a corrective delivery, retracing back toward the origin of the displacement.
Such behavior is consistent with institutional rebalancing, where price revisits discounted areas to test unmitigated orders before determining continuation or failure.
🧠 Demand Zone Context
The highlighted demand zone represents a key area where bullish momentum was initiated. This zone is not marked as an entry or signal, but as a reference area where reaction, absorption, or rejection may offer valuable information regarding order-flow strength.
How price behaves within and around this zone is far more important than the zone itself. Acceptance below would suggest weakness, while sustained defense may indicate higher-timeframe continuation remains possible.
⚖️ Expectation Management
Markets operate on probabilities, not certainties.
At this stage, multiple outcomes remain valid:
•Price may rebalance and resume higher-timeframe structure
•Price may continue lower if demand fails to hold
•Price may consolidate as liquidity is redistributed
•All conclusions are conditional and remain subject to invalidation by price.
📌 Purpose of This Channel
This space is dedicated to:
•Objective structure-based analysis
•Liquidity and displacement logic
•Patience, discipline, and process
•Education over prediction
•There will be no signals, no hype, and no promises.
Only clean charts, structured reasoning, and transparent commentary.
If you value professional market insight, rule-based frameworks, and institutional logic, feel free to follow and engage.
Let price reveal the narrative.

GBPAUDWelcome to my TradingView journal.
All content shared here is provided strictly for educational and informational purposes only. The purpose of this analysis is to document market structure, liquidity behavior, and price delivery through an institutional lens. Nothing presented constitutes financial advice, trade signals, or investment recommendations.
🔍 Market Structure Context
GBPJPY has recently delivered a clear bullish break of structure (BOS), confirming a shift in short-term directional intent. The impulsive expansion suggests strong participation rather than corrective price movement, indicating that prior sell-side liquidity has been absorbed.
Following the expansion, price has begun to stabilize above the broken structure, reflecting acceptance at higher levels rather than immediate rejection.
🧠 Demand Zone Perspective
The highlighted demand zone marks the origin of the bullish displacement. From an institutional perspective, this zone is treated as a contextual reference, not a signal. Such areas often represent locations where imbalance entered the market with conviction.
If price revisits this zone, the nature of the reaction will provide insight into whether bullish order-flow remains present or whether deeper rebalancing is required.
⚖️ Probabilistic Framework
Markets operate on probabilities, not certainty.
From current conditions:
•Continuation remains valid while demand holds
•Corrective pullbacks may occur to rebalance inefficiencies
•Consolidation is possible as liquidity redistributes
•All scenarios remain valid until price confirms or invalidates them.
📌 Channel Philosophy
This channel is built around:
•Structure over indicators
•Liquidity logic over emotion
•Process over prediction
•Education over hype
There will be no signals, no guarantees, and no performance claims — only clean charts, disciplined reasoning, and transparent analysis.
If you value institutional logic, objective market commentary, and a rule-based analytical approach, you’re welcome to follow and engage.
Let price tell the story.

GBPAUD SELLThere is a significant supply area in front of the price, and a downward movement is expected from this currency pair.

Short GBPAUD on a new 50-low signalGBPAUD has been in a daily downtrend for a long time now and the price on H4 failed to make a new higher high. So My thinking is we go lower. I sold on price crossing below the moving average
Daily chart to identify trend direction:

GBPAUD FREE SIGNAL|SHORT|
✅GBPAUD has traded into a premium supply zone after internal buy-side liquidity was engineered. Weak bullish continuation and rejection from premium suggest smart money distribution, favoring a downside expansion toward resting sell-side liquidity below.
—————————
Entry: 2.0180
Stop Loss: 2.0203
Take Profit: 2.0150
Time Frame: 2H
—————————
SHORT🔥
✅Like and subscribe to never miss a new idea!✅

GBPAUD: Price Approaching Horizontal Support.GBPAUD have been moving on a horizontal range of support and resistance. we can clearly spot how the price is respecting the zones, giving the traders opportunity of buying from the support and selling at resistance.
For the meantime, the price is heading down to the next horizontal support, as we expect a retracement or breakdown at this point.
Possible outline;
A confirmed reversal above the support, would trigger a long position to 2.0344 as partial target.
Thanks for reading.

GBPAUD Oversold bounce capped at 2.0323 resistance The GBPAUD pair is currently trading with a bearish bias, aligned with the broader downward trend. Recent price action shows a further pullback and the loss of support within the downtrend.
Key resistance is located at 2.0323, a prior consolidation zone. This level will be critical in determining the next directional move.
A bearish rejection from 2.0323 could confirm the resumption of the downtrend, targeting the next support levels at 2.0124, followed by 2.0009 and 1.9927 over a longer timeframe.
Conversely, a decisive breakout and daily close above 2.0323 would invalidate the current bearish setup, shifting sentiment to bullish and potentially triggering a move towards 2.0400, then 2.0470.
Conclusion:
The short-term outlook remains bearish unless the pair breaks and holds above 2.0323. Traders should watch for price action signals around this key level to confirm direction. A rejection favours fresh downside continuation, while a breakout signals a potential trend reversal or deeper correction.
This communication is for informational purposes only and should not be viewed as any form of recommendation as to a particular course of action or as investment advice. It is not intended as an offer or solicitation for the purchase or sale of any financial instrument or as an official confirmation of any transaction. Opinions, estimates and assumptions expressed herein are made as of the date of this communication and are subject to change without notice. This communication has been prepared based upon information, including market prices, data and other information, believed to be reliable; however, Trade Nation does not warrant its completeness or accuracy. All market prices and market data contained in or attached to this communication are indicative and subject to change without notice.

GBP-AUD Bearish Breakout! Sell!
Hello,Traders!
GBPAUD has broken below a well-defined horizontal supply area, confirming a bearish structure shift. Buy-side liquidity was taken before strong sell-side expansion, signaling smart money distribution and continuation toward lower liquidity resting beneath recent lows. Time Frame 3H.
Sell!
Comment and subscribe to help us grow!
Check out other forecasts below too!
Disclosure: I am part of Trade Nation's Influencer program and receive a monthly fee for using their TradingView charts in my analysis.
