Diamond Shift, Channel in Play!Price action recently formed a diamond pattern right at the intersection of two channels, a high-probability area for a shift in direction.
The diamond acted as a turning point, and from there, price shifted into a new phase: the creation of an ascending channel.
Within this structure, we can clearly see consistent higher highs and higher lows, confirming that momentum is now with the buyers.
The market transitioned smoothly into this new ascending channel.
What’s important here is that the channel is not random: it’s an orderly climb, respecting both the upper and lower boundaries. That shows controlled buyer pressure rather than chaotic volatility.
As long as price continues to respect the lower boundary, the bias remains bullish, with the target being the top of the channel.
So, the sequence is clear:
Diamond pattern at the intersection → transition into an ascending channel → target at the channel high.
GBPAUD trade ideas

GBPAUD – Breakout from Descending Triangle StructureOn the 2H chart, GBPAUD has broken above the descending trendline after forming a clear descending triangle near support. Multiple BOS (Break of Structure) and ChoCH movements suggest momentum shift.
📊 Key Levels:
Support Zone: 2.0400 – 2.0430
Trendline Breakout: Around 2.0500
Upside Potential: If buyers hold above 2.0500, the next move could extend toward the 2.0650 – 2.0700 area.
🔎 Outlook:
Sustained bullish pressure above the broken trendline may confirm further upside continuation.
Failure to hold above 2.0500 could see price retesting the 2.0400 support again.
This analysis is for educational purposes only and should not be considered financial advice. Always manage risk and trade responsibly

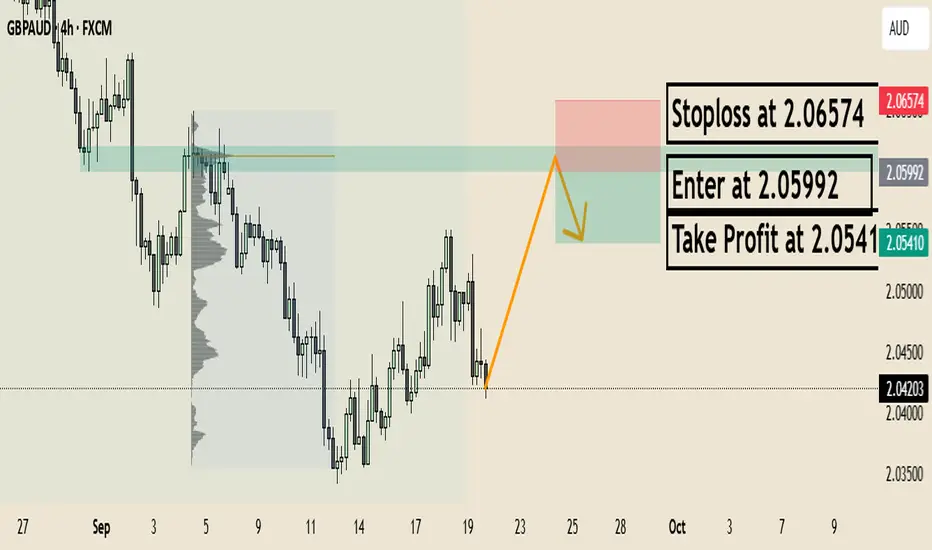
Double Bottom Reversal likely for GBPAUDPrice has been moving in a clear downtrend inside a descending channel. After this recent fall, notice how price seems to have formed a double bottom. This particular pattern often shows up after a big decline like so.
The neckline, is a key level to watch now, and price is starting to break above it. A strong breakout candle can confirm this pattern, but the safer play is to wait for price to come back and retest the neckline. If the old resistance now holds as support, that’s the ideal spot to join the move.
The projected target comes from measuring the height of the double bottom and adding it to the neckline. In this case, the upside target points towards the 2.0539. A stop loss can be placed either below the neckline after retest, or more conservatively below the second bottom.
The one-hour double bottom can be reliable too, but its reliability is more dependent on volatility, unexpected events, and overall market conditions. For now, if the neckline holds on a retest, and shows good rejection, there's a high probability price will be pushing higher.

GBPAUD → False breakdown. Return to bullish trend FX:GBPAUD is forming a false breakdown of support and returning to a bullish trend. The market has seen a breakdown of the local structure, signaling the end of the correction.
The pound sterling has consolidated above the consolidation resistance, thereby showing bullish signs, which has a positive effect on the GBPAUD currency pair.
False breakdown of the trend and support of global consolidation. The price returned to the range and closed in the long zone. Bulls may provoke continued growth after the formation of local patterns...
Resistance levels: 2.0746, 2.103
Support levels: 2.04788, 2.0301
Consolidation of the price above support and a breakout of local consolidation may trigger further growth. The trend is bullish, targets are indicated on the chart.
Best regards, R. Linda!

GBPAUD: Strong Bearish Price ActionAfter a test of a critical daily resistance cluster, two robust bearish confirmations are evident on 📈GBPAUD.
The price violated the trend line of a rising channel and the neckline of a head & shoulders pattern with a single, strong bearish candle.
Further downward movement is anticipated, potentially reaching the 2.0384 level in the near term.

GBPAUDI set and forget this trade for many reasons.
overall daily and weekly are bullish.
we made a retracement and now forming a double bottom.
while it might be a bit early, this trade has a potential of continuing the trend from the 4h supply and demand zone plus W shape


gbpaud buy signal. Don't forget about stop-loss.
Write in the comments all your questions and instruments analysis of which you want to see.
Friends, push the like button, write a comment, and share with your mates - that would be the best THANK YOU.
P.S. I personally will open entry if the price will show it according to my strategy.
Always make your analysis before a trade

GBPAUD Double BottomGBPAUD
Double Bottom
Reversal Pattern
Set up is mentioned in the chart
Trade with care.
Follow Proper Risk Management

Possible Long on GBPAUDBullish Case for GBPAUD
Liquidity Grab Already Done
Price dipped into sell-side liquidity (2.0400–2.0380) with that long green rejection candle.
That sweep flushed out sellers and triggered stop hunts, a common setup before reversal.
Demand Reaction
The rejection wick shows strong buyer absorption at the lows.
Current price is holding above 2.0410, suggesting bulls are defending.

Potential bearish continuation?GBP/AUD has rejected off the pivot and could drop to the 1st support.
Pivot: 2.0460
1st Support: 2.0304
1st Resistance: 2.0565
Disclaimer:
The above opinions given constitute general market commentary, and do not constitute the opinion or advice of IC Markets or any form of personal or investment advice.
Any opinions, news, research, analyses, prices, other information, or links to third-party sites contained on this website are provided on an "as-is" basis, are intended only to be informative, is not an advice nor a recommendation, nor research, or a record of our trading prices, or an offer of, or solicitation for a transaction in any financial instrument and thus should not be treated as such. The information provided does not involve any specific investment objectives, financial situation and needs of any specific person who may receive it. Please be aware, that past performance is not a reliable indicator of future performance and/or results. Past Performance or Forward-looking scenarios based upon the reasonable beliefs of the third-party provider are not a guarantee of future performance. Actual results may differ materially from those anticipated in forward-looking or past performance statements. IC Markets makes no representation or warranty and assumes no liability as to the accuracy or completeness of the information provided, nor any loss arising from any investment based on a recommendation, forecast or any information supplied by any third-party.

GBPAUD is Holding Below the ResistanceHello Traders
In This Chart GBPAUD HOURLY Forex Forecast By FOREX PLANET
today GBPAUD analysis 👆
🟢This Chart includes_ (GBPAUD market update)
🟢What is The Next Opportunity on GBPJPY Market
🟢how to Enter to the Valid Entry With Assurance Profit
This CHART is For Trader's that Want to Improve Their Technical Analysis Skills and Their Trading By Understanding How To Analyze The Market Using Multiple Timeframes and Understanding The Bigger Picture on the Charts

GBP/AUD (4H) – Bullish SetupPrice is holding above the support zone and showing signs of reversal. If momentum continues, I expect a push toward the resistance area around 2.0600.
Entry Zone: 2.0430 – 2.0450
Stop Loss: Below 2.0375
Targets:
TP1: 2.0550
TP2: 2.0600
This setup is based on a breakout and retest structure, supported by bullish price action.

GBPAUD Will Go Up! Long!
Please, check our technical outlook for GBPAUD.
Time Frame: 9h
Current Trend: Bullish
Sentiment: Oversold (based on 7-period RSI)
Forecast: Bullish
The market is trading around a solid horizontal structure 2.047.
The above observations make me that the market will inevitably achieve 2.062 level.
P.S
The term oversold refers to a condition where an asset has traded lower in price and has the potential for a price bounce.
Overbought refers to market scenarios where the instrument is traded considerably higher than its fair value. Overvaluation is caused by market sentiments when there is positive news.
Like and subscribe and comment my ideas if you enjoy them!

Juicy week GBPAUD possible buyHello hello traders what I wonderful week we have on our hands!!
We have a clean downtrend that is looking very weak.
Its a simple trade!! not an A setup buts its a setup.
We also have a pivot point which adds to our setup.

GBPAUD I Potential long from bottom of the channelWelcome back! Let me know your thoughts in the comments!
** GBPAUD Analysis - Listen to video!
We recommend that you keep this on your watch list and enter when the entry criteria of your strategy is met.
Please support this idea with a LIKE and COMMENT if you find it useful and Click "Follow" on our profile if you'd like these trade ideas delivered straight to your email in the future.
Thanks for your continued support!

GBPAUD Forecast – Liquidity Sweep Before Strong Upside RallyGBPAUD has been moving through an extended bearish cycle, confirmed by multiple downside breaks of structure that signaled strong sell-side control. Each leg cleared liquidity and left inefficiencies behind, reflecting a market environment dominated by distribution phases. Recently, however, the dynamics are shifting. Price action has begun to compress, with shorter bearish candles and emerging higher lows that point toward weakening seller momentum and the early signs of accumulation.
Order flow analysis suggests that institutional participants may be absorbing positions within the current range. The market appears poised to engineer a downward liquidity sweep to trigger weak longs and attract late sellers before reversing upward. This type of behavior is typical of smart money accumulation phases, where liquidity is harvested before expansion.
Volume and volatility add weight to this narrative. Downside moves are losing strength, showing seller exhaustion, while volatility has contracted, signaling the market is coiling energy for a breakout. Given the structural setup and liquidity positioning, the probability favors a bullish expansion following a brief dip.

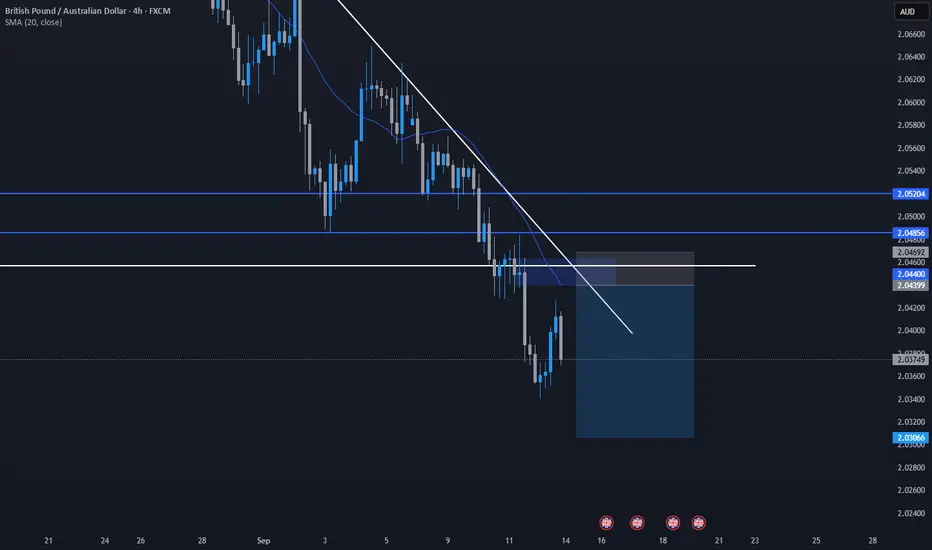
GBPAUD Bearish setup using Volume ProfileHello!
In this particulary 4H chart you can see that on the trending leg, a good volume cluster matches the previous swing point.
Also if we take the zone around the POC, you can clearly see that it was a prvious support ad then a resistance. I will wait for the price to go there and then take a quick 1:1.
Trading at your own risk!
High Probability Setup on GBPAUDSupply zone + support turned resistance + trendline makes this a high probability trade but please wait for entry confirmation
GBPAUD-122 Pip MoveThis chart illustrates a 15-minute Elliott Wave structure on GBP/AUD.
Impulse Wave Completion:
Price completed a 5-wave impulsive move to the upside, topping out around the 2.0550 region (wave 5).
The high aligns closely with the 0.886 Fibonacci retracement level (2.0539), forming a potential exhaustion point.
Sell Zone:
A defined sell zone is marked around the 2.0522 – 2.0539 area, where price reversed.
This coincides with confluence from Fibonacci retracement and wave completion, making it a strong short entry region.
Corrective Phase (ABC):
Following the wave 5 high, price entered a corrective ABC structure.
Wave (a) initiated the first sharp decline.
Wave (b) provided a corrective pullback into resistance, retesting the sell zone.
Wave (c) extended downward, confirming bearish momentum.
Current Market Context:
Price has continued lower within the shaded correction area, breaking below 2.0450 and retesting around 2.0410.
This suggests sellers are maintaining control after the impulsive 5-wave completion.
The next key level to watch is the 2.0377 low, which could act as short-term support.
✨ Summary:
GBP/AUD completed a 5-wave bullish impulse and reversed from the 0.886 Fibonacci resistance/sell zone. The subsequent ABC corrective pattern unfolded, with bearish momentum still present as price approaches lower support levels.

GBPAUD: Bullish Continuation & Long Trade
GBPAUD
- Classic bullish formation
- Our team expects pullback
SUGGESTED TRADE:
Swing Trade
Long GBPAUD
Entry - 2.0439
Sl - 2.0422
Tp - 2.0472
Our Risk - 1%
Start protection of your profits from lower levels
Disclosure: I am part of Trade Nation's Influencer program and receive a monthly fee for using their TradingView charts in my analysis.
❤️ Please, support our work with like & comment! ❤️

GBPAUD What Next? SELL!
My dear friends,
Please, find my technical outlook for GBPAUD below:
The price is coiling around a solid key level - 2.0506
Bias - Bearish
Technical Indicators: Pivot Points Low anticipates a potential price reversal.
Super trend shows a clear sell, giving a perfect indicators' convergence.
Goal - 2.0453
About Used Indicators:
The pivot point itself is simply the average of the high, low and closing prices from the previous trading day.
Disclosure: I am part of Trade Nation's Influencer program and receive a monthly fee for using their TradingView charts in my analysis.
———————————
WISH YOU ALL LUCK

GBP/AUD BEST PLACE TO SELL FROM|SHORT
GBP/AUD SIGNAL
Trade Direction: short
Entry Level: 2.043
Target Level: 2.034
Stop Loss: 2.050
RISK PROFILE
Risk level: medium
Suggested risk: 1%
Timeframe: 3h
Disclosure: I am part of Trade Nation's Influencer program and receive a monthly fee for using their TradingView charts in my analysis.
✅LIKE AND COMMENT MY IDEAS✅
