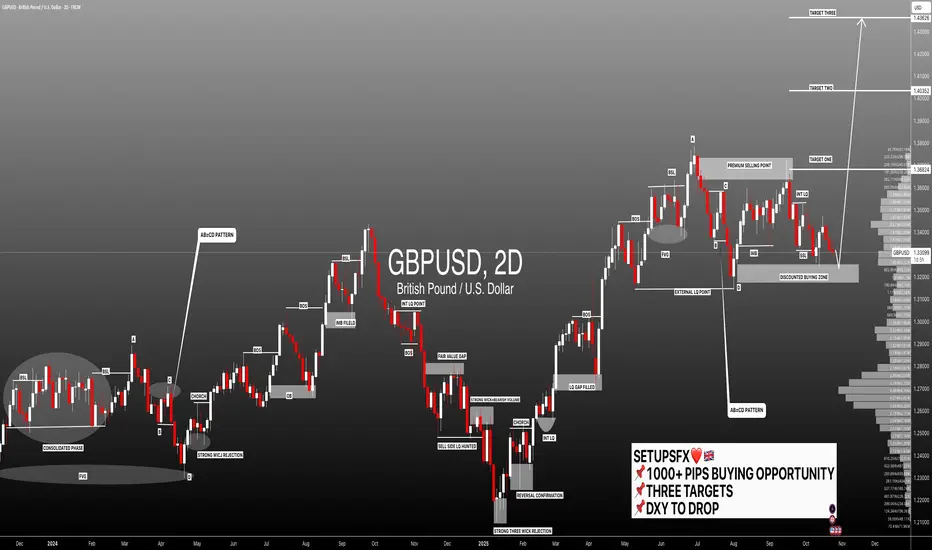
#GBPUSD:+1000 Pips Highly Probable Target! Agree with the idea? GBPUSD is currently trading at a highly probable point where we may see a strong bullish volume emerge in the market. This key level is only valid if the US dollar declines further, as a weak dollar will push our prices towards our target zones, helping us gain a higher risk-to-reward trade setup. P
About British Pound / U.S. Dollar
GBPUSD, often referred to as “The Cable”, a foreign exchange term used to describe the British pound vs the US dollar, is one of the oldest traded currency pairs. In July of 1866, after an earlier failed attempt, the first reliable exchange rate between the British pound and the US dollar was transmitted between the London and New York Exchanges. Optic fibre cables accompanied by satellites handle the Transatlantic communications today.
Related currencies
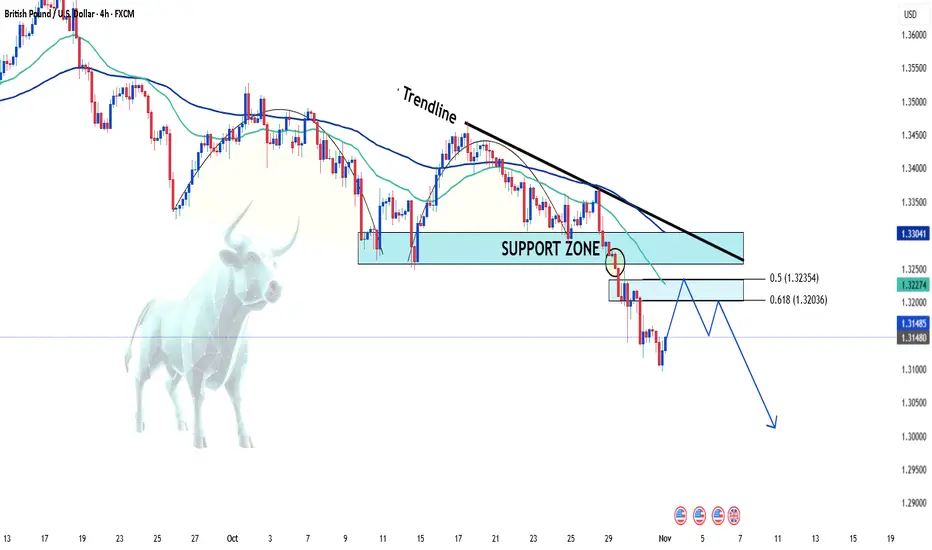
GBPUSD: Sterling Finds Its Feet After Testing Key SupportGBPUSD, Cable has been under steady pressure, but buyers are showing signs of life as the pair bounces from a well-defined support zone. With the dollar losing some steam and the pound finding relief from stabilizing UK data, the setup suggests room for a corrective leg higher into the 1.3440–1.3520

GBPUSD: Drops Sharply After Breaking Key Support👋Hello traders , what’s your view on FX:GBPUSD ?
The GBP/USD pair continues its bearish momentum in the first sessions of November, currently trading around the 1.314 zone after failing to hold the key 1.326 support — which has now turned into new resistance.
On the 4H technical chart, the desce
GBPUSD fell by almost 270 pips in just 3 days - What's Next ?GBPUSD fell by almost 270 pips in just 3 days - What's Next ?
GBPUSD fell by almost 270 pips in just 3 days. FOMC expectations on one hand and also a weakness from GBP itself created this big sell-off.
However, since the current situation is not that dramatic for such a big move, the market could

GBPUSD: Bearish Structure Points to 1.3000 NextAround two weeks ago, I mentioned that GBPUSD could fall toward the 1.32 support, and indeed, the pair reached that level on Wednesday.
Since then, GBPUSD even broke below 1.32 and is now trading around 1.3140, raising the big question — will it fall further to test 1.3000?
In my view, yes, it wil

GBPUSD Trend Reversal👋Hello everyone, what do you think about the trend of FX:GBPUSD ?
After several days of consecutive declines, GBPUSD has recently shown a gentle reversal in the short term.
Currently, the price is trading around 1.335, moving upwards after breaking out from the Diamond Pattern accumulation. If

GBPUSD the recent decline is pushing price move downsideGBP/USD moved higher following the CPI report. However, the rally quickly lost momentum once price action hit a key resistance area, which capped the move and sent the pair back lower.
Technically, the recent decline is pushing the pair below the key resistance zone between 1.3330 and 1.3350, and t

GBPUSD SHORT Market structure bearish on HTFs 3
Entry at Both Weekly and Daily AOi
Weekly Rejection at AOi
Previous Weekly Structure Point
Daily Rejection at AOi
Around Psychological Level 1.33500
Touching EMA H4
H4 Candlestick rejection
TP: WHO KNOWS!
Entry 100%
REMEMBER : Trading is a Game Of Probability

BoE Slows Down Rate Cuts – GBPUSD Gears Up for a Strong Rebound!Hello everyone,
The market’s attention this week is on the Bank of England (BoE) , and in my view, the central bank may slow its rate-cut cycle as inflation remains elevated and economic conditions are still uncertain. At the same time, the UK Manufacturing PMI edged up to 49.7, signaling a mil

GBPUSD | Anticipating Buy sideGBPUSD has recently swept daily equal lows, collecting resting liquidity and tapping into a daily bullish order block. This confluence suggests the potential for a buyside reaction if price maintains structure above intraday support.
On the 1H timeframe, I’ll maintain a bullish bias as long as we d

See all ideas
Summarizing what the indicators are suggesting.
Oscillators
Neutral
SellBuy
Strong sellStrong buy
Strong sellSellNeutralBuyStrong buy
Oscillators
Neutral
SellBuy
Strong sellStrong buy
Strong sellSellNeutralBuyStrong buy
Summary
Neutral
SellBuy
Strong sellStrong buy
Strong sellSellNeutralBuyStrong buy
Summary
Neutral
SellBuy
Strong sellStrong buy
Strong sellSellNeutralBuyStrong buy
Summary
Neutral
SellBuy
Strong sellStrong buy
Strong sellSellNeutralBuyStrong buy
Moving Averages
Neutral
SellBuy
Strong sellStrong buy
Strong sellSellNeutralBuyStrong buy
Moving Averages
Neutral
SellBuy
Strong sellStrong buy
Strong sellSellNeutralBuyStrong buy
Displays a symbol's price movements over previous years to identify recurring trends.
Frequently Asked Questions
The current rate of GBPUSD is 1.3144 USD — it has decreased by −0.08% in the past 24 hours. See more of GBPUSD rate dynamics on the detailed chart.
The value of the GBPUSD pair is quoted as 1 GBP per x USD. For example, if the pair is trading at 1.50, it means it takes 1.5 USD to buy 1 GBP.
The term volatility describes the risk related to the changes in an asset's value. GBPUSD has the volatility rating of 0.33%. Track all currencies' changes with our live Forex Heatmap and prepare for markets volatility.
The GBPUSD showed a −1.23% fall over the past week, the month change is a −2.21% fall, and over the last year it has increased by 1.95%. Track live rate changes on the GBPUSD chart.
Learn how you can make money on rate changes in numerous trading ideas created by our community.
Learn how you can make money on rate changes in numerous trading ideas created by our community.
GBPUSD is a major currency pair, i.e. a popular currency paired with USD.
Currencies are usually traded through forex brokers — choose the one that suits your needs and go ahead. You can trade GBPUSD right from TradingView charts — just log in to you broker account. Check out the list of our integrated brokers and find the best one for your needs and strategy.
When deciding to buy or sell currency one should keep in mind many factors including current geopolitical situation, interest rates, and other. But before plunging into a deep research, you can start with GBPUSD technical analysis. The technical rating for the pair is sell today, but don't forget that markets can be very unstable, so don't stop here. According to our 1 week rating the GBPUSD shows the sell signal, and 1 month rating is buy. See more of GBPUSD technicals for a more comprehensive analysis.