GLM USDT SHORT SIGNAL---
📢 Official Trade Signal – GLM/USDT
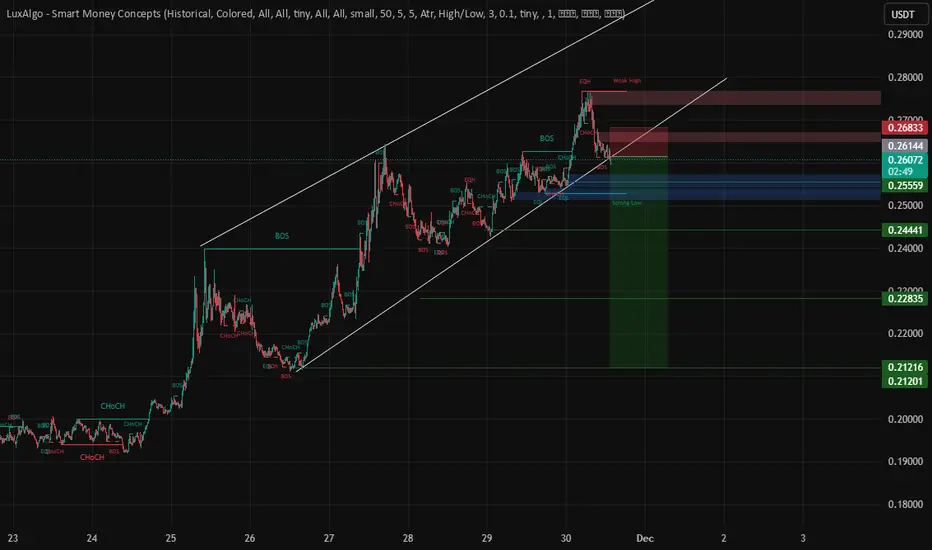
📉 Position Type: SHORT
💰 Entry Price: 0.26146
---
🎯 Take-Profit Targets (Partial Exits):
• TP1: 0.25573
• TP2: 0.24441
• TP3: 0.22835
• TP4: 0.21220
• TP5: —
• TP6: —
---
🛑 Stop-Loss: 0.26870
📊 Timeframe: 15m
⚖️ Risk/Reward Ratio: 7.15
💥 Suggested Leve
Related pairs
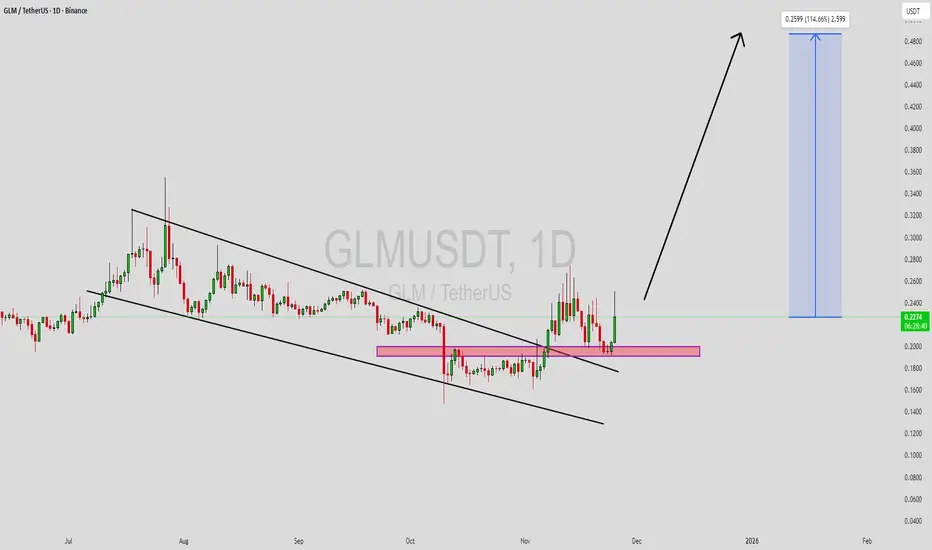
GLMUSDT Forming Falling WedgeGLMUSDT is forming a clear falling wedge pattern, a classic bullish reversal signal that often indicates an upcoming breakout. The price has been consolidating within a narrowing range, suggesting that selling pressure is weakening while buyers are beginning to regain control. With consistent volume
GLMUSDT Forming Falling WedgeGLMUSDT is forming a clear falling wedge pattern, a classic bullish reversal signal that often indicates an upcoming breakout. The price has been consolidating within a narrowing range, suggesting that selling pressure is weakening while buyers are beginning to regain control. With consistent volume
Golem goes lunaticThere is currently a sine formation visible on GOLEM. In today’s market conditions, only God knows what will happen in cryptocurrencies, but the chart seems to be signaling that it is heading toward a formation.
Additionally, I believe GOLEM has been heavily suppressed and is approaching the end of

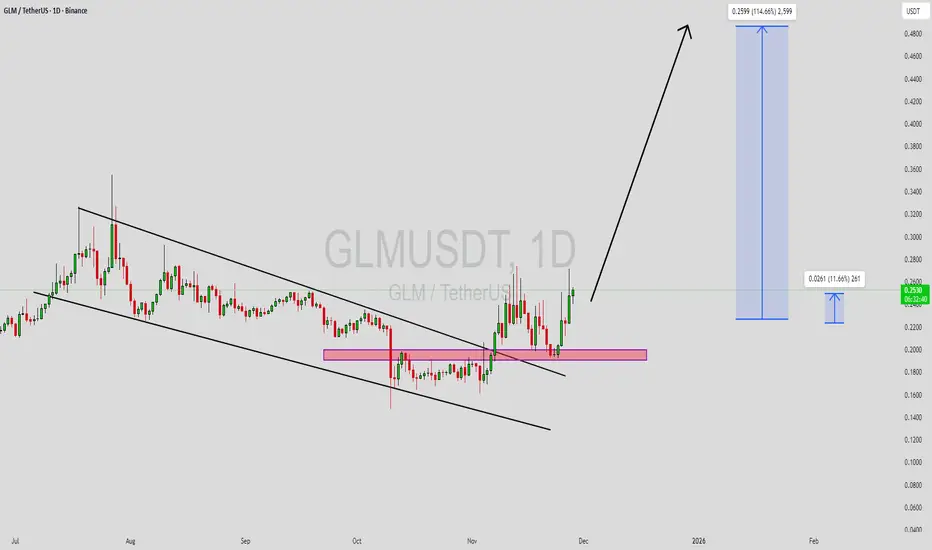
GLMUSDT 1D#GLM is moving inside a falling wedge pattern on the daily chart, with the price trading near the resistance. Consider buying a small bag here and near the support levels at:
$0.2166
$0.1968
If the price breaks out above the wedge resistance, the potential upside targets are:
🎯 $0.2790
🎯 $0.3117
🎯

GLMUSDT UPDAT#GLM
UPDATE
GLM Technical Setup
Pattern: Falling Wedge Pattern
Current Price: $0.235
Target Price: $0.400
Target % Gain: 100.02%
Technical Analysis: GLM has broken out of a falling wedge pattern on the 1D chart, signaling a potential bullish reversal. The breakout is confirmed by strong upward

GLMUSDT Forming Falling WedgeGLM/USDT is showing a compelling technical setup as it appears to be forming a clear falling wedge pattern, which historically signals a potential bullish reversal once breakout occurs. The constricting price action within the wedge, combined with increasing volume, suggests accumulation and a shift

GLM Shortwe have a short setup in GLM according to our strategy. Targets on charts.
Crypto assets especially alt-coin assets are highly volatile. We suggest you to use strict diligence in leverage.
D y O r
Check out my other successful trades. Drop a message for discussion.

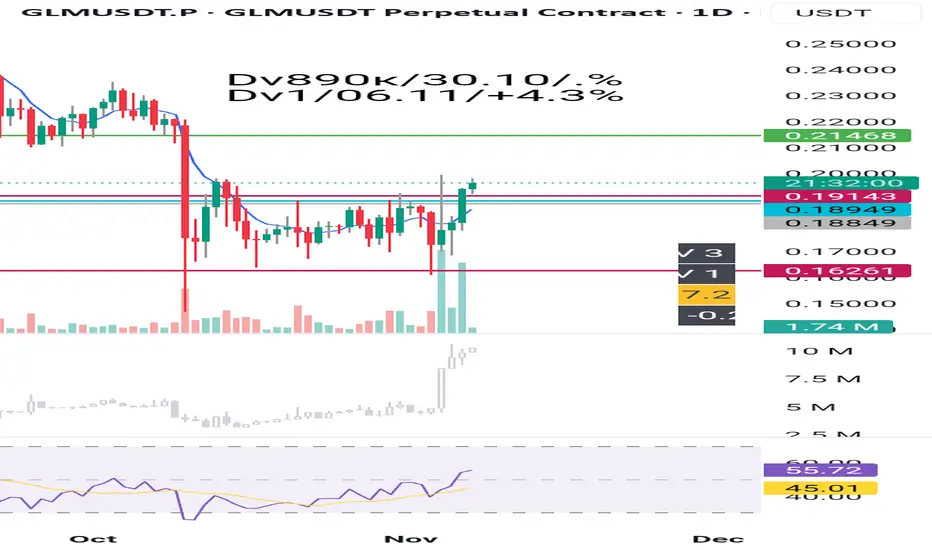
GLMThe deal was moved to breakeven
Gray line - entry point
Red line - mandatory stop loss
Green line - approximate take profit
Black text above the green line - current data at the time of publication (volume/date/intraday price movement)
GLMTake a closer look, the coin may experience rapid growth!
Gray line - entry point
Red line - mandatory stop loss
Green line - approximate take profit
Black text above the green line - current data at the time of publication (volume/date/intraday price movement)

See all ideas
Summarizing what the indicators are suggesting.
Oscillators
Neutral
SellBuy
Strong sellStrong buy
Strong sellSellNeutralBuyStrong buy
Oscillators
Neutral
SellBuy
Strong sellStrong buy
Strong sellSellNeutralBuyStrong buy
Summary
Neutral
SellBuy
Strong sellStrong buy
Strong sellSellNeutralBuyStrong buy
Summary
Neutral
SellBuy
Strong sellStrong buy
Strong sellSellNeutralBuyStrong buy
Summary
Neutral
SellBuy
Strong sellStrong buy
Strong sellSellNeutralBuyStrong buy
Moving Averages
Neutral
SellBuy
Strong sellStrong buy
Strong sellSellNeutralBuyStrong buy
Moving Averages
Neutral
SellBuy
Strong sellStrong buy
Strong sellSellNeutralBuyStrong buy
Displays a symbol's price movements over previous years to identify recurring trends.
Frequently Asked Questions
The current price of GLM / TetherUS (GLM) is 0.1987 USDT — it has risen 2.59% in the past 24 hours. Try placing this info into the context by checking out what coins are also gaining and losing at the moment and seeing GLM price chart.
GLM / TetherUS price has fallen by −7.18% over the last week, its month performance shows a −1.18% decrease, and as for the last year, GLM / TetherUS has decreased by −52.03%. See more dynamics on GLM price chart.
Keep track of coins' changes with our Crypto Coins Heatmap.
Keep track of coins' changes with our Crypto Coins Heatmap.
GLM / TetherUS (GLM) reached its highest price on Mar 3, 2024 — it amounted to 0.7750 USDT. Find more insights on the GLM price chart.
See the list of crypto gainers and choose what best fits your strategy.
See the list of crypto gainers and choose what best fits your strategy.
GLM / TetherUS (GLM) reached the lowest price of 0.1476 USDT on Oct 10, 2025. View more GLM / TetherUS dynamics on the price chart.
See the list of crypto losers to find unexpected opportunities.
See the list of crypto losers to find unexpected opportunities.
The safest choice when buying GLM is to go to a well-known crypto exchange. Some of the popular names are Binance, Coinbase, Kraken. But you'll have to find a reliable broker and create an account first. You can trade GLM right from TradingView charts — just choose a broker and connect to your account.
Crypto markets are famous for their volatility, so one should study all the available stats before adding crypto assets to their portfolio. Very often it's technical analysis that comes in handy. We prepared technical ratings for GLM / TetherUS (GLM): today its technical analysis shows the sell signal, and according to the 1 week rating GLM shows the sell signal. And you'd better dig deeper and study 1 month rating too — it's strong sell. Find inspiration in GLM / TetherUS trading ideas and keep track of what's moving crypto markets with our crypto news feed.
GLM / TetherUS (GLM) is just as reliable as any other crypto asset — this corner of the world market is highly volatile. Today, for instance, GLM / TetherUS is estimated as 6.37% volatile. The only thing it means is that you must prepare and examine all available information before making a decision. And if you're not sure about GLM / TetherUS, you can find more inspiration in our curated watchlists.
You can discuss GLM / TetherUS (GLM) with other users in our public chats, Minds or in the comments to Ideas.