Lingrid | GOLD Contraction Phase Before Trend ContinuationOANDA:XAUUSD is sliding back into the mid-range support after printing a new higher high, where price briefly tapped the upper resistance band. The current decline resembles a multi-leg corrective pullback rather than trend exhaustion, especially with the structure still respecting the rising trendline. Buyers have repeatedly reacted from this dynamic support, keeping the broader bullish sequence intact.
If the market stabilizes around 4,150, the next upward extension could aim once more toward 4,270, where liquidity remains untested above prior highs. A deeper dip into the trendline would still maintain bullish bias as long as the channel holds.
➡️ Primary scenario: accumulation above 4,150 → continuation toward 4,270.
⚠️ Risk scenario: a decisive break beneath 4,120 exposes 4,050 and delays bullish continuation.
If this idea resonates with you or you have your own opinion, traders, hit the comments. I’m excited to read your thoughts!
Trade ideas

Gold idea Gold (XAU/USD) is respecting the rising support trend line and continues to push upward. Price is holding above 4215, showing bullish momentum. A breakout toward the resistance zone targets the 4300 level, where the next major reaction is expected.

GOLD → The battle for zone 4200. Bullish trend FX:XAUUSD is forming a local trading range of 4180-4230, trying to stay above 4200 after yesterday's correction ahead of important US employment and services data.
The dollar is weakening amid expectations of a Fed rate cut on December 11. News concerning Powell, namely Fed chair candidate Kevin Hassett (a well-known “dove”), is supporting gold. Geopolitical risks (stagnation in Russia-Ukraine negotiations) are increasing demand for safe-haven assets.
• In focus today: ADP employment data and ISM Services PMI.
• Weak indicators will strengthen bets on Fed policy easing and support gold.
Gold retains its upside potential. The release of US data could either accelerate growth to $4300 or trigger a correction in the event of strong indicators.
Resistance levels: 4230, 4260
Support levels: 4185, 4175
Gold is testing 4200 for strong support. Local trading range 4180 - 4230. A false breakout of support amid a bullish trend and a weak dollar could support gold's growth.
Best regards, R. Linda!

Gold H1 – Will 4278–4280 Trigger a Drop Into 4170 Today?🟡 XAUUSD – Intraday Smart Money Plan | by Ryan_TitanTrader (01/12)
📈 Market Context
Gold continues its impressive rally as markets price in a potential rate cut by the Federal Reserve (Fed) in December. Spot gold recently surged past $4,230/oz — hitting a multi-week high — as the US Dollar Index (DXY) weakened.
The backdrop is increasingly dovish: fading USD strength, soft U.S. macro data, and dovish comments from Fed officials have fueled speculative buying in gold.
Technically, gold remains elevated, hovering inside a rising channel — similar to what’s shown on your chart. Price compression following strong displacement suggests a consolidation before the next institutional move.
🔎 Technical Framework – Smart Money Structure (H1)
Current state = Accumulation / Distribution within rising channel
Liquidity zones & key triggers
• Premium liquidity zone (sell-opportunity): ~ 4278–4280 (near upper channel resistance) — aligns with your SELL zone.
• Discount liquidity zone (buy-origin / re-entry zone): ~ 4172–4170 (near lower channel support / trendline) — aligns with your BUY zone.
• Equilibrium / chop zone: mid-channel / recent consolidation zone — avoid trading blindly here unless structure breaks.
Expected Smart Money sequence
Sweep → CHoCH/MSS → BOS → Displacement → Retest (FVG/OB) → Expansion
Given the macro tailwinds (weak USD, rate-cut odds), gold remains primed for a directional move once structure confirms.
🎯 Trade Plans for Today
🔴 SELL GOLD 4278 – 4280 | SL 4288
• Thesis: A liquidity sweep at channel top / premium zone followed by engineered bearish displacement — capturing liquidity before a reversal.
• Entry rules (must wait for confirmation):
• Price touches 4280 zone
• Bearish CHoCH / MSS + BOS down on M5–M15
• Entry ideally on FVG fill or after order-block retest post-BOS
• Targets:
1. 4245 – 4240 area (first reaction)
2. 4225 – 4215 (mid-channel retest)
3. 4175 – 4172 (lower channel + buy zone)
🟢 BUY GOLD 4172 – 4170 | SL 4162
• Thesis: Discount-origin tap near lower channel support / trendline — smart money likely to accumulate for next leg up, especially amid dovish Fed sentiment.
• Entry rules (must wait for confirmation):
• Price dips into 4170 zone
• Bullish CHoCH / MSS + BOS up on M5–M15
• Strong bullish wick + FVG fill or OB retest confirmation
• Targets:
1. 4225 – 4230 (first reaction / mid-channel)
2. 4255 – 4265 (upper mid-channel)
3. 4278 – 4280+ (premium liquidity retest)
⚠️ Risk Management & Notes
• Avoid trading inside the mid-channel chop zone without structural confirmation — no “blind” entries.
• Do not treat sweeps (top or bottom) as trend entries — these are often traps.
• Use tight SL (structure invalidation), avoid averaging in consolidation.
• Given potential volatility from macro headlines or a USD bounce, consider reducing lot size.
Summary
Gold is currently riding macro tailwinds — weak USD + Fed rate-cut odds — but from a technical perspective, it’s compressed inside a rising channel. The day’s price action may be a classic Smart Money liquidity hunt: either a sweep at 4278–4280 leading to a sharp drop toward 4170, or a retracement to 4170 that sets up a fresh bull leg.
Only trade after structural confirmation (CHoCH / BOS + retest) — avoid “trend-hop” entries.
📍 Follow @Ryan_TitanTrader for daily Smart Money updates.

XAUUSDHello Traders! 👋
What are your thoughts on GOLD?
Gold remains in a strong long-term bullish trend. After establishing a new All-Time High (ATH), the price has entered a corrective phase and is currently trading below a key resistance zone. This justifies the selling pressure in the short term.
We anticipate the correction to extend further until the price reaches the optimal support area. This zone represents a significant Confluence of two technical factors:
* The long-term ascending trendline.
* The 0.5 (50%) Fibonacci retracement level.
The marked area (Green Box) serves as the ideal pivot point for the correction to end and the next bullish Impulse Wave to begin. Upon reaching this level, we expect renewed demand to drive the price toward new record highs.
This analysis is based on the Weekly Timeframe. Therefore, the realization of this scenario requires patience and time; it is not intended for short-term intraday trading.
Don’t forget to like and share your thoughts in the comments! ❤️

Gold 30-Min — Volume Sell Reversal Triggered⚡Base : Hanzo Trading Alpha Algorithm
The algorithm calculates volatility displacement vs liquidity recovery, identifying where probability meets imbalance.
It trades only where precision, volume, and manipulation intersect —only logic.
✈️ Technical Reasons
/ Direction — SHORT / Reversal 4222 Area
☄️Bearish rejection confirmed through sharp candle body.
☄️Lower-high forming beneath resistance supply region.
☄️Volume decreasing confirms exhaustion in price rally.
☄️Sellers regained imbalance with heavy top rejection.
☄️Algorithm detects fading demand and shift to control.
⚙️ Hanzo Alpha Trading Protocol
The Alpha Candle defines the day’s real control zone — the first battle of momentum.
From this origin, the Volume Window reveals where the next precision strike begins.
⚙️ Hanzo Volume Window / Map
Window tracked from 10:30 — mapping true market behavior.
POC alignment exposes institutional bias and breakout potential zones.
⚙️ Hanzo Delta Window / Pulse
Delta window monitors real buying vs. selling power behind each move.
Tracks volume aggression to expose who controls the candle — buyers or sellers.
When Delta aligns with Volume Map, momentum becomes undeniable.

Lingrid | GOLD Pullback Trading Opportunity from Support ZoneOANDA:XAUUSD is retracing into the 4,190–4,200 support band after an extended bullish run within the upward channel. The broader structure remains firmly bullish, with higher lows and higher highs forming along the rising trendline and each dip being absorbed by buyers. Price is now testing zone below the previous-day low, creating a classic buy pullback setup inside a continuation trend.
If TVC:GOLD stabilizes above the trendline and reclaims intraday momentum, the next upside rotation could drive the metal toward the 4,290 resistance shelf, aligned with the higher boundary of the channel. Maintaining support above 4,190 keeps the bullish sequence intact and favors further acceleration.
➡️ Primary scenario: pullback holds above 4,190 → continuation toward 4,290.
⚠️ Risk scenario: a clean break below channel exposes 4,100 and delays bullish continuation.
If this idea resonates with you or you have your own opinion, traders, hit the comments. I’m excited to read your thoughts!

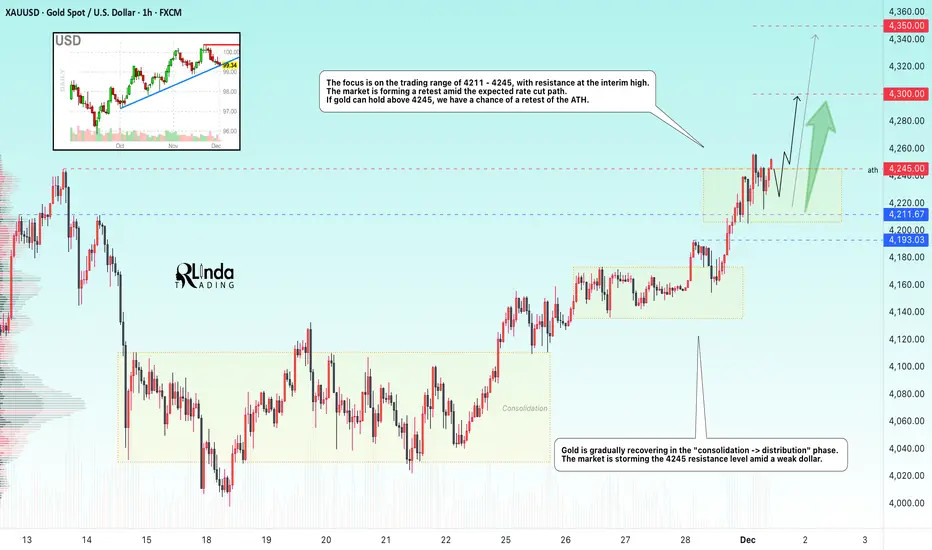
GOLD → Correction to support amid a bullish trend FX:XAUUSD retreated from the $4,245 level reached on Monday. A countertrend correction is forming ahead of the news. But buyers are not sleeping...
Weak US economic data has heightened expectations of an imminent Fed rate cut. The PMI index in the US manufacturing sector continued to contract. The market estimates the probability of the Fed easing policy next week at 87%.
However, rising US Treasury yields and fears that the Fed may send cautious signals after its December decision are limiting gold's growth.
Market attention is shifting to ADP employment data and the US services business activity index (ISM Services PMI), which will be released on Wednesday. They will provide new signals about the health of the US economy.
The correction in gold appears to be under control amid continuing macroeconomic uncertainty. The 4200, 4193-4173 level remains an important area of struggle between bulls and bears.
Resistance levels: 4211, 4245
Support levels: 4193, 4173
A false breakdown and the bulls holding the market above the above support zone could trigger growth within the trend.
Best regards, R. Linda!

XAU/USD | Another Bullish Leg Possible! (READ THE CAPTION)By analyzing the #Gold chart on the 4 hour timeframe, we can see that price made a strong bullish jump today, pushing all the way up to $4264 before showing signs of exhaustion and pulling back. This reaction is typical after such an aggressive move, especially when price taps into short-term liquidity pockets and meets intraday supply zones.
Right now, TVC:GOLD is trading around $4228, which keeps the overall bullish structure intact. The key level to watch remains $4187, as long as price holds above this zone and doesn’t break it with a strong 4H candle close, the bullish scenario stays valid. This level is acting as both structural support and a demand area from the last impulsive move, so buyers will likely attempt to defend it.
As long as we stay above that support, we can expect the market to build another wave of bullish momentum. The next upside targets remain the same, with potential reaction zones at:
• $4240
• $4250
• $4260
• $4272
Each of these levels represents short-term liquidity pockets and minor supply areas where price may pause, react, or give another continuation setup. If bullish pressure stays strong, TVC:GOLD can attempt another push into the upper range after clearing intraday resistance levels.
Overall, the trend is still bullish as long as $4187 holds, and higher targets remain in play unless we see a deeper breakdown or a sharp shift in momentum.
Please support me with your likes and comments to motivate me to share more analysis with you and share your opinion about the possible trend of this chart with me !
Best Regards , Arman Shaban

Lingrid | GOLD Weekly Analysis: Breakout Confirmed, What’s Next?OANDA:XAUUSD concluded a week by breaking above the key levels and reclaiming the $4,200, signaling a continuation of bullish momentum after a period of compression. This breakout from the consolidation pattern suggests that buyers have regained control and are pushing price toward the November high. The 4H chart shows a clear higher low formation, which is a classic sign of underlying strength in an uptrend. However, this victory is not yet complete; it is now entering a critical phase where it must prove its strength by holding above the broken levels and overcoming the formidable resistance area above.
TVC:GOLD has broken out of a triangle pattern, which is trend continuation pattern. Historically, such patterns lead to a measured move upward, targeting the height of the triangle’s base added to the breakout point. While this offers a bullish target near $4,330, a potential pullback from point C might occur before the final leg higher. This pullback scenario is common and should be viewed as a buying opportunity rather than a reversal signal. The monthly chart confirms the broader bullish bias, with price trading well above the monthly low and approaching the October high, a key psychological and technical hurdle that will require strong conviction to overcome.
Looking ahead, the path forward is not guaranteed. The immediate support is now around $4,160, which must hold firm to validate the breakout. A failure to hold this level could lead to a retest of the $4,100 range, potentially triggering a deeper correction. Additionally, next week’s high-impact economic data such Non-Farm Employment Change, Core PCE, and Unemployment Claims—will be pivotal. Strong US data could pressure gold by strengthening the dollar, while weaker-than-expected numbers could fuel the rally. For now, the bias is bullish, but caution is warranted as the market approaches next major test.
If this idea resonates with you or you have your own opinion, traders, hit the comments. I’m excited to read your thoughts!

GOLD → Retest of consolidation support on uptrend FX:XAUUSD is trading in a sideways range around $4,200, awaiting new labor market data to determine the Fed's policy trajectory after December's rate cut.
Weak US data (a 32K decline in ADP employment and a slight increase in ISM services to 52.6) did not change market expectations. The probability of a 25 bp Fed rate cut on December 11 is around 90%. Attention has shifted to the trajectory of policy easing in early 2026. Key factors will be data on unemployment claims and sentiment on Wall Street.
The fundamental background is relatively positive, and the dollar has entered a correction phase due to expectations of lower rates, which may support the gold price...
Resistance levels: 4238, 4262
Support levels: 4185, 4175
Gold is testing the support levels of the key trading range. If the bulls keep the price above 4185 and form a bullish reversal pattern, then in the short and medium term, we can expect growth to intermediate highs.
Best regards, R. Linda!

XAU/USD | Gold Update : Watching 4192 and 4240 Closely!By analyzing the #Gold chart on the 4 hour timeframe, we can see that price followed the previous analysis perfectly and hit the first target at $4240, even pushing slightly higher to $4242. After that move, gold pulled back and corrected all the way down to $4175. Right now gold is trading around $4192, which is basically a neutral zone with no clear direction yet.
We need to see whether price can climb back above $4240 again or not. One important point: if gold fails to hold above $4192 within the next hour, we might see another heavier drop. Keep an eye on the reaction to these key levels. I will update this analysis again soon.
Please support me with your likes and comments to motivate me to share more analysis with you and share your opinion about the possible trend of this chart with me !
Best Regards , Arman Shaban

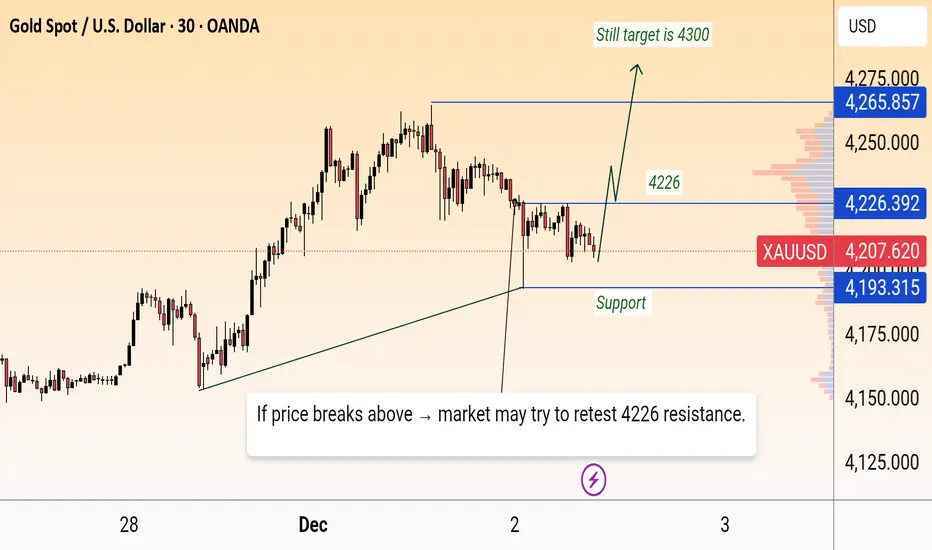
Gold updateGold is holding above the rising support trendline, showing early signs of strength after tapping the 4193 support zone. If buyers sustain momentum and break above 4226, price can move toward the higher resistance at 4265, with an extended upside target near 4300. However, staying below 4226 keeps the market in a choppy consolidation phase.
Gold Trade ideaGold (XAUUSD) is holding above the rising trendline support. A pullback toward the support zone is expected before a bullish continuation. A breakout above 4245 resistance could open the way toward the 4275–4299 levels.

XAUUSD – The Golden Wave Awaits the Next U.S. TriggerIf there is one asset being favored by the current macro environment , it is undoubtedly gold. The U.S. dollar is weakening due to expectations that the Fed will soon shift toward policy easing, while global investors await key U.S. data such as ADP, ISM, and the Fed meeting next week. This “waiting mode,” combined with the dollar dropping to its lowest level since mid-November , is creating a highly supportive backdrop for XAUUSD to continue its bullish momentum.
Looking at the chart, gold continues to move smoothly within its ascending channel . Price repeatedly rebounds from the lower boundary, rides along the Ichimoku cloud, and forms higher lows — all signatures of a healthy bullish market with real buying pressure . Every small pullback is absorbed almost immediately, showing that buyers remain firmly in control.
My preferred scenario: XAUUSD may fluctuate slightly around 4,180–4,200 to collect liquidity, then continue climbing toward 4,280 — an area aligning with the upper channel boundary and a level where the market has reacted strongly in the past. If ADP and ISM come out weaker than expected , a clean breakout above 4,280 becomes highly likely.
Overall, gold currently has macro momentum, technical alignment, and market sentiment all on its side . As long as you avoid FOMO and wait for minor pullbacks, you’ll find it much easier to ride along with the major flow of capital as the market prepares for the next wave of volatility.

GOLD: Breakout Structure Points to New High TargetsGOLD: Breakout Structure Points to New High Targets
Gold continues to push higher after breaking out of the consolidation triangle. Price retested the breakout zone and is now trading above 4230, holding firmly above the key structure.
The chances are higher that gold may continue to rise further. The bullish movement began on Thursday without any notable news, and I do not expect anything significant to further drive it up.
For now gold remains only bullish. A possible correction may happen before it moves more.
Key Levels:
• 4150
• 4230
• 4290
• 4360
As long as price holds above 42.., buyers remain in control. A pullback into the support zone could provide continuation toward 4290, and a stronger breakout opens the path to 4360.
You may find more details in the chart!
Thank you and Good Luck!
❤️PS: Please support with a like or comment if you find this analysis useful for your trading day❤️
Previous analysis:
Previous analysis:

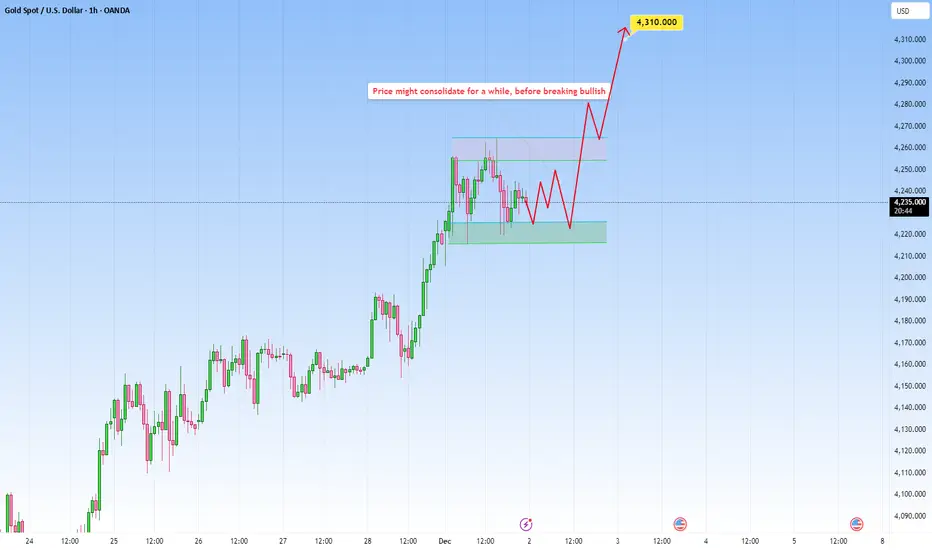
XAUUSD: Waiting for directionPrice recently pushed to the upside, but now the market is slowing down, moving sideways.
This is classic reaction after an impulsive move. Buyers are still in control overall, but taking a breather.
A clean break above the upper range would confirm that buyers are ready to continue the trend and push for new highs.
That’s the scenario I’m watching, a bit of back-and-forth, then a breakout to the upside once the market is done consolidating.
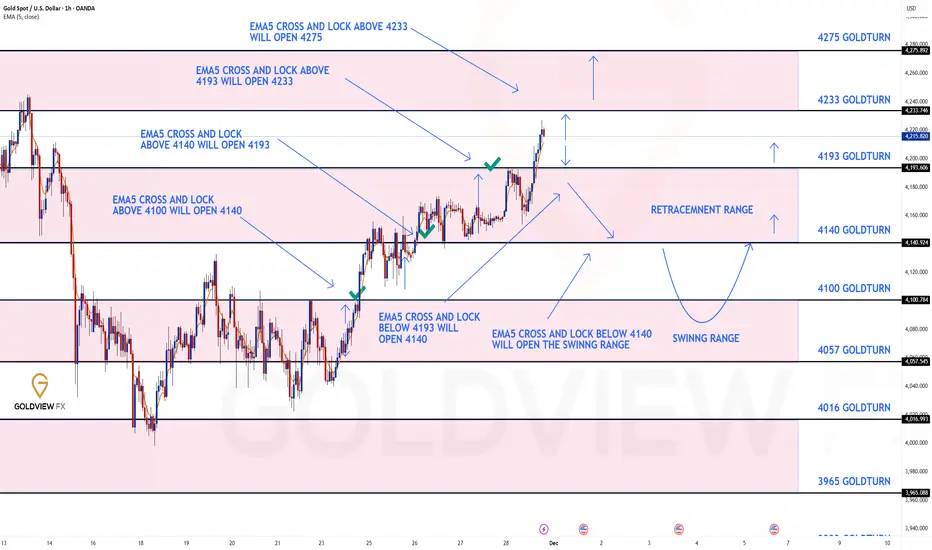
GOLD 1H CHART ROUTE MAP UPDATE & TRADING PLAN FOR THE WEEKHey Everyone,
Please see our 1h chart levels and targets for the coming week, which is still active and in play.
We are seeing price play between two weighted levels with a gap above at 4233 which is locked and a gap below at 4193 as support. We will need to see ema5 cross and lock on either weighted level to determine the next range.
We will see levels tested side by side until one of the weighted levels break and lock to confirm direction for the next range.
We will keep the above in mind when taking buys from dips. Our updated levels and weighted levels will allow us to track the movement down and then catch bounces up.
We will continue to buy dips using our support levels taking 20 to 40 pips. As stated before each of our level structures give 20 to 40 pip bounces, which is enough for a nice entry and exit. If you back test the levels we shared every week for the past 24 months, you can see how effectively they were used to trade with or against short/mid term swings and trends.
The swing range give bigger bounces then our weighted levels that's the difference between weighted levels and swing ranges.
BULLISH TARGET
4233
EMA5 CROSS AND LOCK ABOVE 4233 WILL OPEN THE FOLLOWING BULLISH TARGETS
4275
BEARISH TARGETS
4193
EMA5 CROSS AND LOCK BELOW 4193 WILL OPEN THE FOLLOWING BEARISH TARGET
4140
EMA5 CROSS AND LOCK BELOW 4140 WILL OPEN THE SWING RANGE
4100
4057
As always, we will keep you all updated with regular updates throughout the week and how we manage the active ideas and setups. Thank you all for your likes, comments and follows, we really appreciate it!
Mr Gold
GoldViewFX
Gold Bulls Hold Control — Targeting $4,320 ResistanceHello traders! Here’s my technical outlook on XAU/USD (Gold) based on the current market structure shown on the chart. After a strong bullish impulse earlier in the period, Gold formed a distribution Range below the main Resistance Level, where multiple upside attempts were rejected and the price eventually turned around from the upper range boundary. This rejection initiated a corrective decline that respected the descending Resistance Line, while buyers gradually began to defend the Support Line, leading to a compression structure that later transitioned into a reversal phase. Following this consolidation, Gold successfully broke above both the internal range and the descending resistance, confirming a shift in market structure. Price then entered a well-defined ascending channel, forming higher highs and higher lows along the rising Support Line. Several clean breakouts inside the channel confirm sustained bullish momentum, with buyers clearly in control as long as the channel structure remains intact. Currently, price is consolidating just above the $4,160–$4,140 support zone, holding above former breakout levels and respecting the lower boundary of the ascending channel. This behavior suggests a healthy bullish pullback rather than trend exhaustion. As long as Gold remains above this support area and holds inside the channel, the bullish scenario remains valid. My expectation is for a continuation move toward the upper boundary of the channel, with the main upside target at TP1 around $4,320, where the previous resistance and projected channel resistance converge. A clean breakout above this level would open the door for further bullish expansion. However, a sustained break below the $4,140 support or a drop out of the channel would weaken the bullish structure and could trigger a deeper corrective move. Please share this idea with your friends and click Boost 🚀

XAUUSDHello Traders! 👋
What are your thoughts on GOLD?
Gold continues to trade within a short-term ascending channel and is now approaching the upper boundary of this structure. This region also aligns with a major resistance zone formed by the previous swing high, creating a strong confluence area.
As price enters this resistance cluster, we expect selling pressure and a potential rejection. Based on the current momentum, it does not appear likely that gold will easily break above this zone in the short term.
Therefore, the more probable scenario is:
1-A pullback toward the lower boundary of the ascending channel
2- If the channel breaks to the downside, an extended decline toward the next key support level becomes likely
Don’t forget to like and share your thoughts in the comments! ❤️

THE KOG REPORTTHE KOG REPORT:
In last week’s KOG Report we said we would be looking either price to push up into our red box and give us a short, or, price to attempt that 4040 level and bounce, giving us the opportunity to go long. We got in on that long, and then just carried it for most of the week, resulting in not many updates apart from the continued path and a successful week to close.
It was a bit nervy with the ranging, but our hot spots worked well, gave us added confidence and of course the algo performed exceptionally.
A fantastic week in Camelot, not only on Gold but the numerous other pairs we trade and analyse.
So, what can we expect in the week ahead?
Key levels here for the open are 4228 resistance and 4210 support. These are the levels that need to be monitored on the 15min red boxes for the break. A break above and we should see that high on the chart completed and potential for bears to come in and attempt the correction. While that flip is still active, above 4210 there is more upside to be had but the level sticking out to us this week is the 4260-70 region. This is the level that needs to break open and hold for us to go higher.
The issue I have at the moment is our liquidity indicators are suggesting a higher high but once that is made, there is a chance we get a sharp reversal and a clean rejection from one of these resistance levels can lead to a very aggressive decline all the way back down into the low 4000’s again. It’s a new day of a new month so caution is needed, the market may open with gaps, if that’s the case, best not to chase them, let it settle and then look for the set up.
RED BOXES:
Break above 4230 for 4237, 4247, 4250 and 4260 in extension of the move
Break below 4210 for 4199, 4195 and 4165 in extension of the move
Please do support us by hitting the like button, leaving a comment, and giving us a follow. We’ve been doing this for a long time now providing traders with in-depth free analysis on Gold, so your likes and comments are very much appreciated.
As always, trade safe.
KOG

GOLD → The bullish trend continues. Retest of 4250FX:XAUUSD is trading at six-week highs near $4,250, supported by a weaker dollar and expectations of a Fed rate cut. The market is storming key resistance...
The probability of a December rate cut is 87%. The dollar is posting its worst week in four months after failing to consolidate above 100.0. A break in local trend support could trigger a decline in the index, which would support gold.
Today's focus is on the ISM Manufacturing PMI (forecast: 48.6). Weakness in the data could increase pressure on the dollar and support gold.
Gold maintains its upward trend, supported by loose monetary policy. Key data this week could boost momentum ahead of the Fed meeting.
Resistance levels: 4245, 4300
Support levels: 4211, 4193
A retest of 4245 could end with a pullback within the current consolidation at 4211 - 4245. Two scenarios: If the bulls hold the price above 4245, a rally to 4300 is expected. Otherwise, the market could retest 4215 - 4211 with the aim of a long squeeze before rallying. The trend is bullish, and the fundamental background is relatively positive.
Sincerely, R. Linda!
Gold Slows at Channel Top — Market Targets 4,150 Before Move UpHello traders! Here’s my technical outlook on XAU/USD based on the current market structure. After breaking out of the broader consolidation phase, gold continued to move within a rising channel, forming consistent higher highs and higher lows along the Support Line. Buyers maintained strong momentum as the price pushed toward the Resistance Line, which aligns with the major Resistance Level near 4,240. However, after reaching this upper boundary, the market showed clear signs of exhaustion, indicating that buyers are struggling to push further into the resistance zone. This reaction suggests that the price may soon initiate a corrective move. At the moment, XAU/USD is trading inside a narrowing rising structure, with the Support and Resistance Lines converging, creating compression. As long as the price holds above the local Support Level around 4,150, the bullish structure remains intact. A pullback from the Resistance Line toward this area is the most likely short-term scenario before buyers attempt another push. This zone aligns with the first target TP1, which also acts as a key reaction zone from previous price behavior. A successful rebound from support could allow bulls to regain strength and attempt another test of the 4,240 resistance. If a breakout occurs, it would open the door for further bullish continuation. However, if the price fails to hold the Support Line or breaks back below the 4,150 zone, the structure may shift to a deeper correction, exposing gold to lower support areas. Please share this idea with your friends and click Boost 🚀
