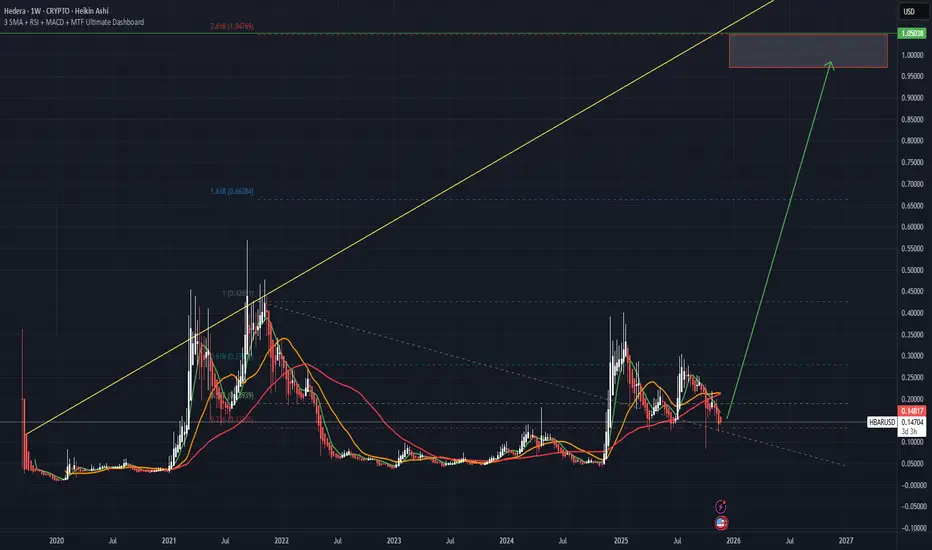
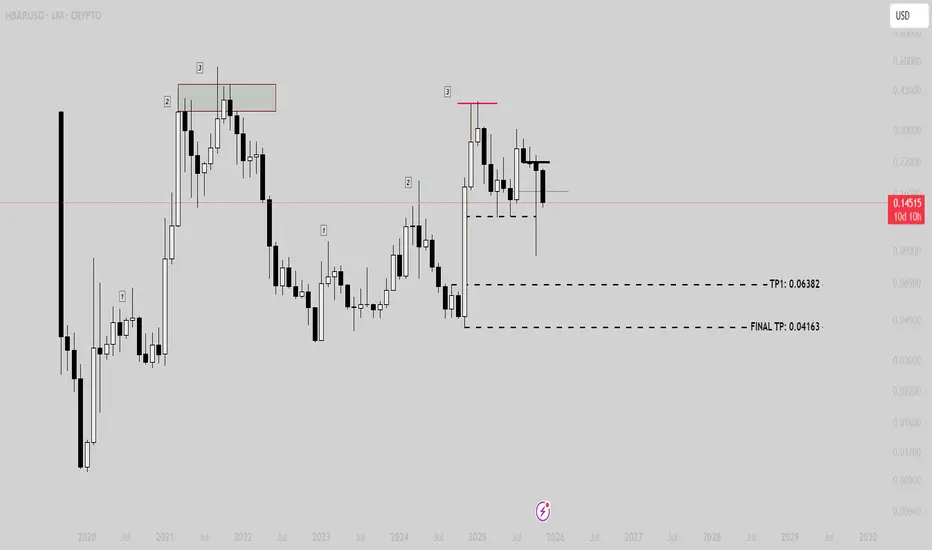
HBARUSD lost its 1W MA200 also. Collapse imminent.Hedera (HBARUSD) is about to close its 1W candle below the 1W MA200 (orange trend-line) for the first time since November 11 2024. This is a huge development as this has been its long-term Support, which even though it broke on 3 separate occasions in 2025, it ever closed a week below it and always recovered with a strong rally.
If this time it fails, then the Bear Cycle will be confirmed 100% (pretty much is) and will move on into its 2nd Phase, in a similar way as the 2021/22 Bear Cycle did. As you can see, both Cycles are almost identical, with virtually indistinguishable 1W RSI Falling Wedge patterns (both starting after a 88.50 Resistance rejection).
They are both parts of a multi-year Triangle pattern, which in 2022 bottomed on its Higher Lows trend-line on the 0.9 Fibonacci retracement level (also just above the 2.0 Fib extension measured from the second High). This time both Fibs are almost on the same level, which gives us a minimum Target for this Bear Cycle at 0.0530.
---
** Please LIKE 👍, FOLLOW ✅, SHARE 🙌 and COMMENT ✍ if you enjoy this idea! Also share your ideas and charts in the comments section below! This is best way to keep it relevant, support us, keep the content here free and allow the idea to reach as many people as possible. **
---
💸💸💸💸💸💸
👇 👇 👇 👇 👇 👇
Market insights

HBAR Price Stalls at Major Support After Sharp SelloffCOINBASE:HBARUSD price has paused after a sharp selloff, down around 17% over the past seven days and nearly 24% month over month. The decline has now slowed near the $0.113 zone, a level that has started acting as short-term support.
Momentum remains weak. The Chaikin Money Flow (CMF), which tracks large capital movement, is still deeply negative near −0.32. This shows that bigger players are not stepping back in yet, even as price stabilizes. Recent exchange flow data also confirms fading demand, with brief outflows quickly flipping back into mild inflows.
As long as COINBASE:HBARUSD holds above $0.113, a short consolidation or minor bounce is possible. However, a clean break below $0.107 would expose the next downside zone near $0.095, roughly 16% lower. On the upside, any recovery remains limited unless HBAR reclaims $0.155 on a daily close.
For now, price is resting on support, but buyers have yet to prove conviction.

HBAR continues to eek towards its next major decision. This is going to resolve very soon.
You can see an obvious monthly triangle pattern heading towards it's decision point.
If it dips to that 6 cent range, it'll be a major buying opportunity.
Lets make sure the body of the monthly candle confirms first.

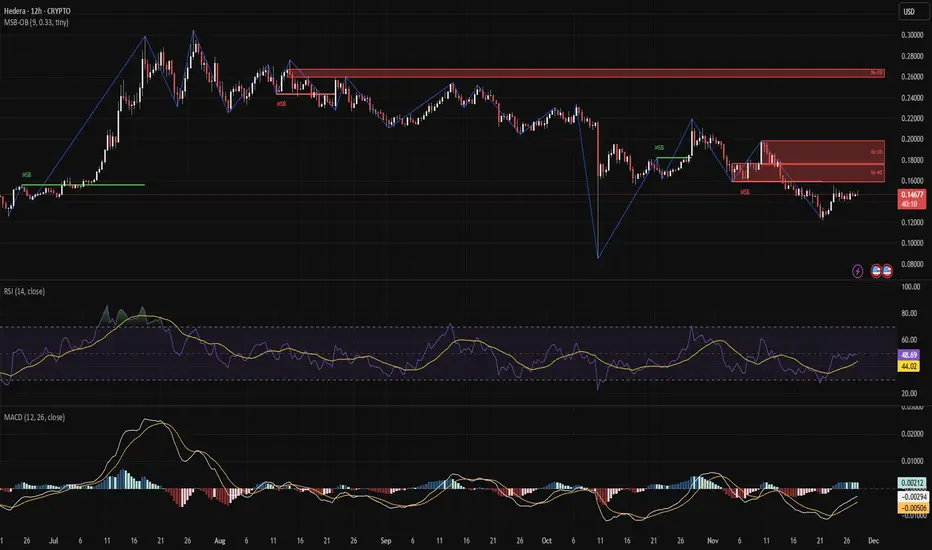
HBAR Still Stuck Under Key Resistance – No Bullish Break YetHBAR continues to range just under the 0.16–0.20 resistance, rejecting the supply zone and showing no bullish market structure break.
MACD and RSI are weak, hovering near neutral. Buyers need to break 0.18 cleanly to shift this trend. Until then, structure remains heavy.
Price is consolidating — but not showing strength yet.
Bias: Bearish
Pair: HBAR/USDT
Timeframe: 12H
This is not financial advice, only data analysis. Please consult a qualified financial professional for personalized guidance.
HBARUSD - HEDERA entering bull seasonHi,
I do like US coins lately because there are institutions involved and a lot of capital.
Hedera already working with giants as BlackRock and Fidelity.
This is not a trading advice.
Thanks
Gex
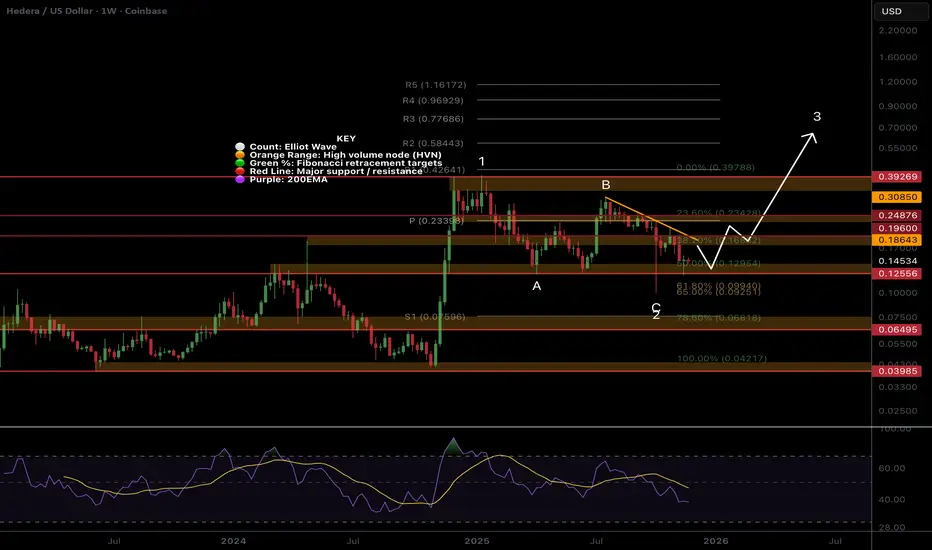
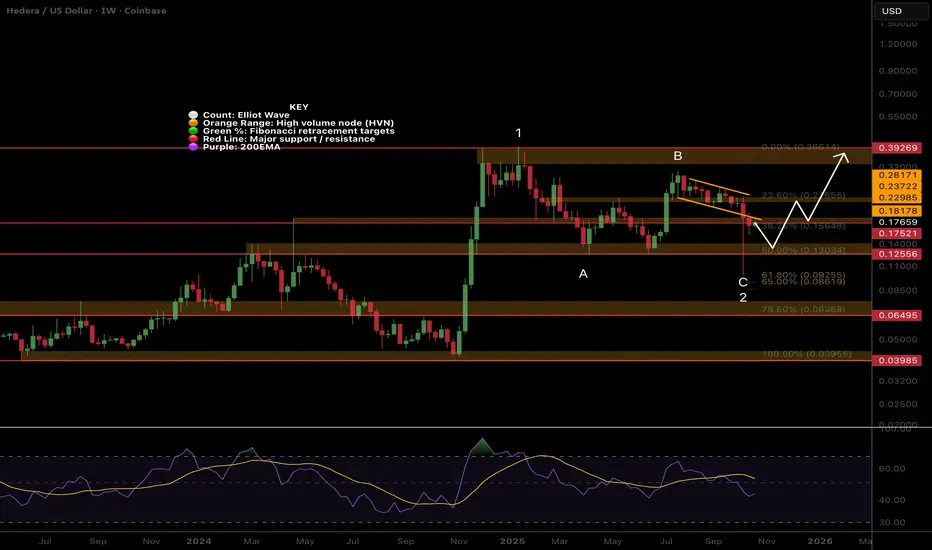
HBAR still holding strongCRYPTOCAP:HBAR Price has printed a textbook ABC for wave 2, but as long as we are below the descending trend-line, the probability is lower still. The wick has now been revisited, which is expected behaviour.
Price is below the weekly pivot. The next downside target is the S1 pivot at $0.075, which is also the alt-coin golden pocket, 0.786 Fibonacci retracement and High Volume Node support.
🎯 Terminal target for the business cycle could see prices as high as $0.8
📈 Weekly RSI is bearish with no divergence
👉 Analysis is invalidated if we close below wave 2, keeping wave 2 alive.
Safe trading
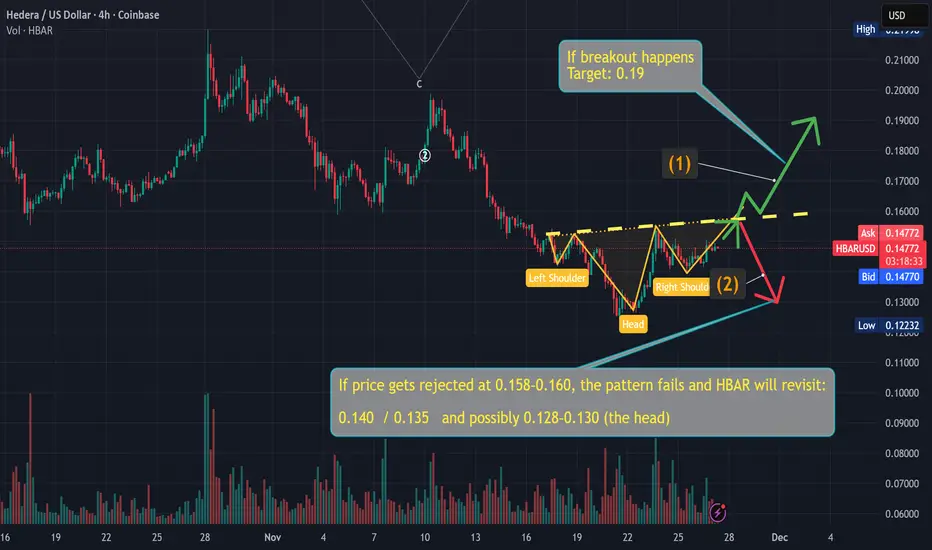
HBAR: Inverse Head & Shoulders Forming — Breakout or Breakdown ?HBAR – Inverse Head & Shoulders Forming? Key Breakout Level Ahead (0.158–0.160)
HBAR is potentially forming a bullish Inverse Head & Shoulders on the 4H timeframe, but the pattern is not confirmed yet. The neckline sits right at the 0.158–0.160 zone, which is the critical inflection point for the next major move.
✅ Bullish Scenario (1)
If HBAR breaks above 0.158–0.160 with a strong 4H close and increased volume, the Inverse H&S becomes valid.
Measured-move target → 0.19
Short-term resistance levels: 0.165 → 0.172 → 0.185 → 0.190
This would signal the first strong bullish structure shift in several weeks.
❗ Bearish Scenario (2)
If price gets rejected at 0.158–0.160, the pattern fails and HBAR is likely to revisit lower support levels:
0.140
0.135
0.128–0.130 (the Head, and final support)
A rejection here would signal continuation of the broader downtrend.
📌 Key Levels to Watch
Neckline resistance: 0.158–0.160 (decision zone)
Bullish invalidation: Breakout with strong candle & volume
Bearish invalidation: Failure/rejection at neckline
📈 Summary
HBAR is approaching a major decision point. A breakout could trigger a 25–30% rally, while rejection could continue the downtrend back into the 0.13 region. Watch the neckline carefully—this is where the next big move will be decided.
💬 Your Feedback Matters
If you found this analysis useful, please let me know by leaving a comment and a like.
Your support helps me create more high-quality analysis like this. 🙏 BINANCE:HBARUSD COINBASE:HBARUSDC BYBIT:HBARUSDT CRYPTOCAP:HBAR
Hedera ( $HBARUSD)Targets Breakout as Adoption AcceleratesHedera trades near $0.143 after bouncing from the recent $0.129 support. The market now focuses on the push toward $0.160, a level that capped multiple rallies. This move happens inside a structure defined by a long-term descending trendline formed after the July 2025 peak at $0.30. Traders want to see whether new adoption triggers enough momentum to break that structure and create a fresh trend.
Global Partnership Program Strengthens Fundamentals
The Hedera Council launched a new global partnership program focused on attracting enterprise, institutional, and regulatory players. The initiative aims to expand Hedera’s real-world footprint and deepen network activity across financial and industrial sectors. More than 10,000 developers already show interest in building on Hedera, and the program includes over $1 million in ecosystem grants for teams working on tokenization, CBDCs, payment systems, and compliance-driven solutions.
This foundation supports Hedera’s long-term growth narrative. Early collaboration with banks and government entities suggests rising confidence in the network. Enterprise partners want stable, regulation-friendly technology, and the Council believes these partnerships position Hedera for a bigger cycle.
Institutional Momentum: ETFs, Futures, and Policy Pilots
Institutional demand continues to rise. Coinbase Derivatives will launch 24/7 HBAR futures on December 5, boosting volume and visibility. Fourteen ETF filings are already in progress, and new IRS rules now allow staking inside ETFs, giving HBAR-focused funds a yield advantage. Canary Capital holds over 421 million HBAR, about 0.84% of total supply, signaling long-term conviction. Hedera’s involvement in Australia’s CBDC pilot and Wyoming’s state-backed stablecoin further strengthens fundamentals.
Technical Outlook: Battle at $0.160
HBAR faces resistance at $0.160, with support at $0.129 and $0.081. A clean break above $0.160 opens the path toward $0.21. Rejection risks a slide back toward $0.129. A breakout above the descending trendline may target $0.30 again.

HBAR still in the channel!Price is back in the descending range after dropping below during the flash crash, which can be viewed as an anomaly.
Wave 2 appears complete at the golden pocket Fibonacci retracement. Price was rejected at the daily 200EMA and channel upper boundary and has lost the daily pivot and High Volume Node, suggesting further downside is to come.
📈 Daily RSI bounced from oversold alongside price with no divergence.
👉 Continued downside has a target of $0.07 at the next High Volume Node support and alt-coin golden pocket 0.786
Safe trading

$HBARThese are my targets for HBAR. Currently, I don't see any bullish signs, so this is my primary analysis for HBAR right now.
HBAR back in the channel!CRYPTOCAP:HBAR Price is back in the descending range after dropping below during the flash crash, which can be viewed as an anomaly.
Wave 2 appears complete at the golden pocket Fibonacci retracement. Price was rejected at the daily 200EMA and channel upper boundary and has lost the daily pivot and High Volume Node, suggesting further downside is to come.
📈 Daily RSI reached oversold and has printed hidden bullish divergence, which is bullish
👉 Continued downside has a target of the $0.13 High Volume Node
Safe trading

$HBARUSD Potential UpsideGood morning,
Looks like the shakeout is over for now. Something I noticed was the force-out of leveraged players. We won't see the prices the institutions were able to scoop up, because all of those "sellers" were forced out of the market, and shares immediately bought up.
I have invested in several strong utility cryptos, and I could see COINBASE:HBARUSD being in that conversation in the near future.
As always, first target is the 0.888 Fibonacci.
888 = abundance
Alex

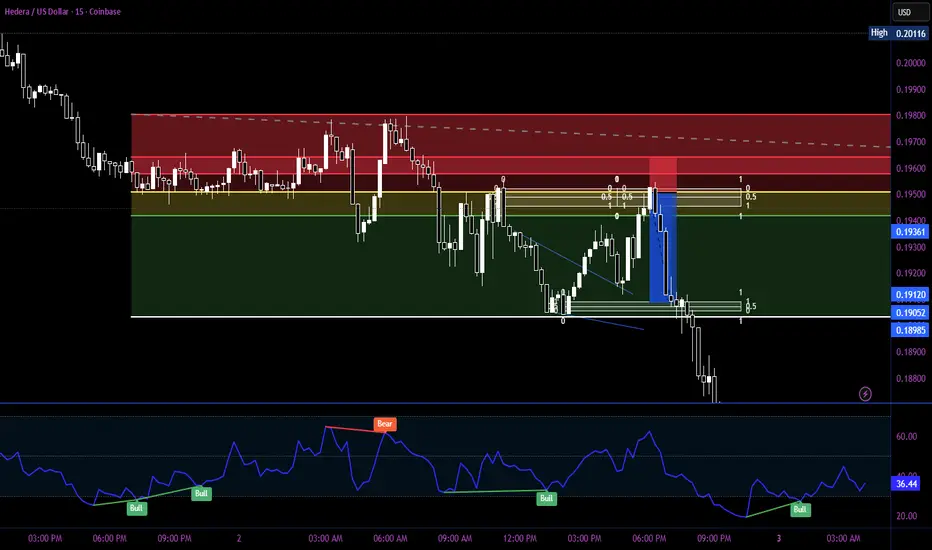
fair value gap and fibonaccifibo 1,0.79,0.705,0.618,0.05,0
fair value gaps on the one minute chart, price to react off 618 to previous day high or low
HBAR Price Movement + Liquidation + Whale Map + Trade Plan HBAR has completed a clean impulsive breakout structure from the $0.18 base and is now consolidating above the key support band at $0.203–$0.207, which is acting as the first institutional accumulation layer following the smart-money CHoCH and BOS sequence on the 4H. Price continues to print higher-lows on intraday frames, and volume data shows clear spot bid absorption on every dip into VWAP and the 0.382–0.5 retracement pockets.
The next immediate move is expected to be a grind-up continuation toward the short-term liquidity cluster at $0.214, where a sweep of short positions and stop-loss liquidations could trigger a fast expansion to $0.223–$0.228, followed by a bullish extension zone targeting $0.235–$0.255 in the medium term. On the downside, liquidation pressure remains stacked below $0.203 and especially at $0.198 and $0.187, meaning if the market wicks aggressively lower, it is likely a liquidity hunt rather than a structural reversal — as long as price reclaims the zone quickly.
Whale footprint is firmly bullish: accumulation has been consistent inside $0.182–$0.20 and demand has followed price upward, while distribution levels show passive profit-taking expected near $0.217–$0.223 and heavier sell walls layered into the $0.245–$0.26 range, meaning any breakout into these levels can trigger short-term volatility but should not be interpreted as a cycle top.
Accordingly, the optimal execution plan remains buying dips into $0.203–$0.207 with risk defined below $0.198, targeting $0.214 → $0.223 → $0.245+ and scaling profits progressively while keeping a core long position for a potential cycle expansion toward $0.43 and beyond.
This setup remains valid as long as HBAR does not close a daily candle below $0.198, and a panic invalidation trigger only activates on a structural failure beneath $0.182, which would temporarily shift structure into a corrective ABC pullback rather than a trend continuation. Until then, market structure, liquidity behavior, momentum indicators, and institutional flow remain aligned to the upside.

HBAR Heavy resistance aheadCRYPTOCAP:HBAR is about to hit resistance - daily 200EMA and S1 pivot, but has re-entered the channel after a deep swing below with daily RSI hitting oversold.
I am expecting price to climb the wall of worry generated by all the fear from the Friday flash crash + macro-economic environment and 'cycle top' narrative that is all driving market FEAR
WaveC of 2 completed at the golden pocket Fibonacci retracement.
Safe trading

HBAR/USD – Trying to Reclaim the Trendline📈 Bias: NEUTRAL-to-LONG (recovering momentum)
Hedera holds near $0.173, attempting to reclaim the SMA200 ($0.1735). RSI remains steady at ~57, suggesting improving momentum after the $0.168 low.
A successful hold above $0.1745 may drive continuation toward $0.1780–$0.1800, while losing $0.1700 returns bias to neutral-bearish.
📊 Key Levels:
Resistance: $0.1745 / $0.1780 / $0.1800
Support: $0.1700 / $0.1680

HBAR Price Tests $0.16 Support — One Move Could Trap the BearsCOINBASE:HBARUSD (HBAR) is consolidating near $0.16, down about 8% this week but showing signs of stabilization. The token remains inside a broadening wedge, with volatility building between $0.16 and $0.19 — the key resistance zone that could trigger a short squeeze.
If COINBASE:HBARUSD closes above $0.19, it would invalidate much of the bearish pressure, as over 76% of leveraged traders are short. A move beyond that could accelerate toward $0.23, $0.25, and $0.30 as liquidations kick in.
On the downside, losing $0.16 would weaken the current setup, while a breakdown below $0.15 could drag prices toward $0.12.
The RSI is forming a bullish divergence — higher lows against lower price lows — indicating fading selling pressure. As long as COINBASE:HBARUSD stays above $0.16, the bias leans toward a reversal rather than a breakdown.

HBAR Wave 2 complete, but more downside firstCRYPTOCAP:HBAR wave 2 looks complete at the golden pocket and High Volume Node support after printing an ABC down. A deeper visit into the wick left behind is likely before we continue up in wave 3. Testing the 0.5 Fib and High Volume Node is where I am looking for a long.
Weekly RSI has bullish divergence, a good sign, but plenty of room to fall until oversold. Price is currently at major resistance of the channel lower boundary and High Volume Node.
A strong upside move has a target of the all time High Volume Node. Targets of $1+ are still on the cards.
Safe trading
HBAR Correction may be complete!CRYPTOCAP:HBAR huge sell off during the black swan event tapped the .618 Fibonacci golden pocket, tyhe target i was sharing for a while on my macro charts! This should mark the bottom of a wave 2 pull back with no opportunity for anyone to enter at those prices.
Price sits above High Volume Node support and 0.382 Fibonacci retracement. A break above the descending trend line would mark a bullish market structure and take the fearful by surprise!
RSI hit oversold but with no bullish divergence. Losing support bring up the 0.5 Fib and High Volume Node at $0.135 as the next target.
Safe trading

HBAR/USD – Rally Stalling Near $0.19🟢 Holding gains above SMA200 ($0.176)
Hedera trades at $0.1899, approaching strong resistance after solid rally. RSI 69, near overbought. Support at $0.183.
📖 Keywords: #HBARUSD #Hedera #AltcoinMomentum #CryptoWatch

HBAR, hit the Golden pocket target ive discussed!What a mess Friday turned out to be with a recording breaking liquidation event with the numbers still growing - bigger than FTX!
SUNK COST FALLACY: THE DAMAGE IS DONE, DO NOT PANIC IN AND OUT OF POSITIONS.
So many alt-coins proved there is nothing but thin air holding them up - no real demand whatsoever! I'll take a look at some charts today. Now these wicks can be classed as 'anomalies' in technical analysis but in this case i think we've revealed some of the strong tokens now with real backing.
It is expected that with such large wicks we at least test the centre of the wick on one more terrifying shake-out that isnt actually as bad as the one we just has but feels it because traders and investors are been kicked while their down in a state of panic.
-------------
The WXY wave 2 complex correction has seemingly completed just above the golden pocket mentioned in previous analysis as target for any deep pullback.
But we are now in a bearish structure and we should be cautious. Just ahead lies the quadruple resistance, S1 pivot, 200EMA, major High Volume Node and channel boundary bottom.
Its typical for price to pullback into the wick to smash the fear into weak hands before flying up in a wave 3 to new al time highs. The S3 pivot is the target $0.15 adn I will look out for longs here.
RSI does not have bullish divergence but did bounce from oversold.
Safe trading

HBAR Reversal time?My long-term golden pocket target has finally been reached leaving a long lower wick behind as demand soaked up the drop. Price is likely to retrace into the middle of the wick and find its final support if the move was truly the wave 2 bottom!
If we go lower the ‘alt-coin golden pocket’, 0.786, sits at the major High Volume Node support and would be a great buy as well as a good spot to look out for longs.
Weekly RSI has room to fall but bullish divergence is forming!
Wave 3 has a minimum expected target of $0.65 aligning with targets from the standard deviation bands above. Wave 5 has a minimum target of $0.75
Safe trading

HBAR Bearish Momentum Confirmed by Elder-Ray IndexReadings from HBAR’s Elder-Ray Index strengthen the bearish outlook against its price. At the time of writing, the indicator stands at -0.01132, signaling that sellers currently have control.
The Elder-Ray Index evaluates the balance between bullish and bearish forces by comparing Bull Power (buying pressure) and Bear Power (selling pressure).
A positive reading typically indicates stronger buying momentum and the potential for an uptrend. Conversely, the negative value now seen in HBAR suggests that bearish sentiment dominates, reinforcing the likelihood of continued downward pressure in the short term.
