HBAR simple chart for 2026Check out this long-term BINANCE:HBARUSDT chart. Idea is pretty simple! I track this chart since 2021 and if we cut all noise we can find the best zone for spot accumulation (marked box zone)
Key supports at 0.10 current level or even better retest 0.08 again!
Levels for fixation step by step Yearly open 2025.
Fibonacci extensions levels and 1.618 by mid-2026 around 0.65 cents would be enough for this cycle! But i understand majority waiting over 1$ price! But most likely it will not happen! What's your HBAR target? DYOR!
Market insights

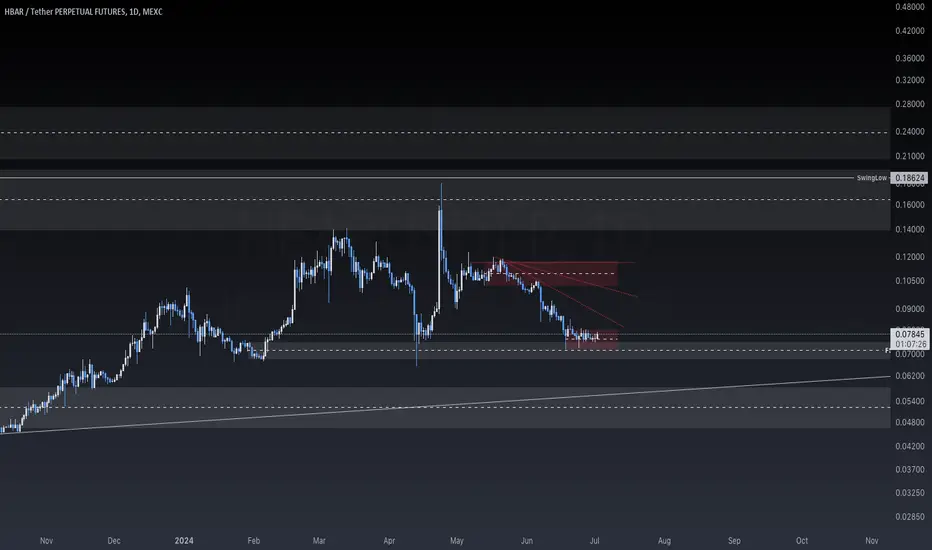
Hedera (HBAR): Perfect Setup For Long | Wait For Breakout!HBAR has been under solid pressure from sellers recently, but we’re starting to see early signs that a reversal might be forming near this support area.
The game plan is clear here. We wait for a proper market structure break to form, which would push price back toward the local resistance zone (old support). Once buyers manage to reclaim that zone, it would line up with a break from the EMAs as well, giving us a clean confirmation.
If that setup plays out, it could lead to a similar explosive move like the last time we had a breakout from the EMAs.
Swallow Academy

HBARUSDT I think it will drop to the 0.1065 area and then we will have a rise to that area. the next move will be towards 0.15


Hedera (HBAR): Looking For Strong Bullish Movement | Waiting...HBAR is still sitting in the lower range and the key thing now is that orange zone above price. Buyers need to reclaim that area first and hold it, because right now price is still capped near the zone of liquidity.
If we get a clean reclaim of the zone, then we will be looking for an entry for a long (odds are pretty good once we get that momentum). Until that reclaim happens, it’s more of a “wait for confirmation” spot than a full send.
Swallow Academy

HBAR soon more gain 30% gain toward 0.1929$Hi the support and resistances on the chart are based on the previous data and weekly candlesticks if BINANCE:HBARUSDT holds this last support the potential of 30% gain is logical toward 0.1929$

HBAR Preparing for a Larger MoveHBAR continues to move within a descending channel on the higher time frame, with price now reacting near the lower third of the structure. The current positioning suggests that the next directional move will likely be decided within this zone.
Key points from the chart
Descending Channel Structure
• Price has respected both channel boundaries since early October.
• Each touch of the lower boundary has produced a short term rebound.
• Recent candles show slowing bearish momentum near the same zone.
Local Support Zone
• HBAR is testing a demand area that previously acted as a launch point.
• Reaction from this zone determines whether the market forms a new higher low.
Potential Bullish Scenario
• If HBAR maintains support, price may begin moving toward the middle band of the descending channel.
• A confirmed break above the internal trendline could open the path toward the next resistance levels near 0.152 and 0.204.
Potential Bearish Scenario
• A breakdown from the support region exposes the lower channel boundary.
• Failure to hold this structure may extend the decline toward deeper levels around 0.110 and possibly 0.079.
What to watch
• Strength or weakness around the current support zone.
• Reaction to the internal trendline.
• Volume confirmation on any breakout attempts.
Market stance
Neutral until the channel boundary or the resistance line is decisively broken.

TradeCityPro | HBAR at Critical Support, Bears in Control👋 Welcome to TradeCityPro!
In this analysis, I want to review HBAR, one of the RWA-focused projects, currently ranked 21st on CoinMarketCap with a market cap of $5.71 billion.
🗓 Daily Timeframe
On the daily timeframe, this coin is sitting on a very important support zone.
✔️ There is also a curved descending trendline visible on HBAR, which started forming from the 0.2915 top.
🎲 Every time the price has touched this trendline, bearish momentum has increased.
🎯 Right now, the price is inside this support area, and considering the strong selling pressure in the market, the probability of this zone breaking is high.
💥 The RSI oscillator has also taken a bearish direction after the rejection from 0.2915, spending most of the time below the 50 level, which indicates bearish momentum dominating the market.
💧 If RSI enters the oversold zone, this bearish momentum will intensify even further, increasing the likelihood of a breakdown of support.A break of 0.13055 would be a very strong short trigger.
📊 For long positions, after the descending trendline breaks, we can enter using the 0.15111 trigger.
⚡️ Signs like increasing volume and RSI stabilizing above 50 will act as strong confirmations for a bullish reversal.
📝 Final Thoughts
Stay calm, trade wisely, and let's capture the market's best opportunities!
This analysis reflects our opinions and is not financial advice.
Share your thoughts in the comments, and don’t forget to share this analysis with your friends! ❤️

Hedera (HBAR): Good Buy Zone Forming Up | BullishHBAR reacted well from the same support zone that held multiple times in the past, showing that buyers are still defending this area. After the liquidity sweep, momentum slowly shifted and we’re now seeing early signs of a bullish push.
As long as buyers keep holding above this zone, the upside play stays valid. A steady recovery toward the EMAs makes sense, and if momentum continues, we could see a clean extension toward the higher targets.
Swallow Academy

Is #HBAR Finally Ready to See a Massive Rebound or Not? Yello, Paradisers! Is this breakout from the falling wedge the beginning of a real trend reversal on #HBARUSDT, or not? Let’s break down #Hedera setup:
💎#HBAR is currently trading around $0.145, and after weeks of downtrend within a clearly defined falling wedge, we finally saw a breakout above descending resistance. This is the first bullish signal, but it’s not yet confirmed.
💎For real confirmation, we need to see the 50EMA hold as support in the coming candles. If that happens, the probability of a sustained bullish move increases dramatically.
💎On the upside, the immediate target is the Moderate Resistance at $0.177. A break above that zone, ideally on strong volume, would open the path for a larger move toward the Strong Resistance level at $0.209, and that’s where bulls will likely take significant profits.
💎However, if #HBARUSD fails to hold above the support zone near $0.134, and especially if price dips back into the wedge structure, we’ll likely revisit the Strong Demand Zone at $0.110. Below that, the entire bullish setup gets invalidated, and we’ll expect a retest of the recent lows, with increased downside pressure from short setups forming below.
Strive for consistency, wait for clear confirmations, and remember that discipline always beats chasing quick profits.
MyCryptoParadise
iFeel the success🌴

HBAR - Daily HBAR- sitting just above key weekly support. This is a very strong area of support with a potential 25% upside into the descending triangle.
A further analysis would be made once price reaches that area. A break of that would give further upside.
What are your thoughts on this?
Good luck!

HBAR Price Update — Bull Flag Signals Trend ShiftHBAR is showing the early signs of a potential reversal after a strong bounce from the major high-time-frame support at $0.12. The reaction came with rising volume, suggesting renewed strength entering the market.
Price is now consolidating inside a developing bull flag, forming shortly after a key structural high was established. This type of formation often precedes continuation moves, especially when paired with improving volume dynamics.
Key Points
- Price is holding firmly above the $0.12 demand zone
- Rising volume indicates increasing market interest
- Bull flag consolidation could fuel a larger breakout move
What to Expect
If HBAR breaks the bull flag to the upside with strong volume, a rotation toward the point of control and eventually the high-time-frame resistance at $0.24 becomes increasingly likely. If $0.12 fails, momentum weakens.

HBAR - weekly levels and a few daily dabblingsSaw someone post on X about HBAR and remembered I should check on it and see the long term outlook of things.
Daily timeframe with a weekly / monthly outlook so come back to this one at the end of the year lol.
Hbar potential of explosion 20% toward 0.2150$Hi the support and resistances on the chart are based on the previous data and weekly candlesticks if BINANCE:HBARUSDT holds this last support the potential of 20% gain is logical toward 0.2150$

HBAR Rebounds Strong from Key SupportHBAR is showing a strong reaction from the support zone around 0.13, a level that has held multiple times in the past. If price continues to stay above this area, we could see a steady move toward higher resistance levels and a potential rise toward 0.25 in the coming weeks. Market structure looks positive and buyers are stepping in again.

HBAR | Retraced into Key Support Zone – Long Spot SetupHBAR has pulled back into a major support zone at $0.13–$0.14, which has historically acted as a strong demand area. This presents a potential long spot opportunity for traders watching for a bounce or trend continuation.
🟢 Trade Idea
Entry Zone: $0.13 – $0.14
Take Profit 1: $0.19 – $0.21
Take Profit 2: $0.25 – $0.29
Stop Loss: $0.12
🔁 The plan is to ladder in through the support zone and scale out at the outlined targets, aligning with previous resistance levels. A clean break below $0.12 would invalidate the setup and suggest reevaluating the trend.
📌 Watching price action and volume closely in this zone. Always use proper risk management and size positions accordingly.

HBAR Sell/Short Signal (1H)The price seems to have reached a strong level that contains a lot of orders and has also shifted to a bearish structure.
Our last valid order block is the red zone | if the price reaches it, it will be a sell/short opportunity.
We have two targets marked on the chart, offering a 1:2 risk-to-reward ratio.
Let’s wait and see what happens next.
For risk management, please don't forget stop loss and capital management
When we reach the first target, save some profit and then change the stop to entry
Comment if you have any questions
Thank You

HBAR Price Sits on Support as Buyers Step BackBYBIT:HBARUSDT trades near $0.146 after dropping almost 19% this week and nearly 39% over the past three months. The daily chart shows the Hedera token sitting right above the lower boundary of its falling channel, with $0.141 as the final support that keeps the structure from breaking.
Money Flow Index, which tracks whether dip buying is strong or weak, has slipped back under its trend line again. It had been making higher lows even as the price made lower lows, but that strength has now faded. If MFI drops under 36, it confirms that dip buyers have stepped back.
On-Balance Volume tells the same story. OBV remains weak and continues to lean downward, showing sellers still control most of the recent trading activity.
If $0.141 holds, BYBIT:HBARUSDT can attempt a move toward $0.154 and then $0.1808. A daily close below $0.141 exposes $0.134 and keeps the downtrend in full control.
Hidden bearish divergence on the 12-hour chart only reinforces the risk.

HBAR Price Tumbles 25% — Indecisive Traders Could Extend Drop
HBAR has fallen 25% over the last week and trades at $0.144, hovering near the $0.145 level. The steep decline has pushed the token into a vulnerable position where bearish sentiment continues to overshadow attempts at stabilization.
Based on current indicators, HBAR could slip below its $0.139 support level. A drop to $0.133 or even $0.120 is possible if selling accelerates and market conditions worsen. Such a move may trigger panic among investors and deepen the correction.
If HBAR manages to hold the $0.145 support and bounce, the price could attempt a recovery toward $0.154. A breakout above that level may open the path to $0.162 or even $0.175. This scenario would invalidate the bearish outlook and signal renewed buyer interest.

$HBAR Bearish Pressure Tests Crucial Support – Dip or Bounce ?BINANCE:HBARUSDT CRYPTOCAP:HBAR Bearish Pressure Tests Crucial Support – Dip or Bounce Ahead?
HBAR's 1H chart screams bearish vibes 📉, down ~6% in 24h to ~0.155 USDT, hugging major support at 0.155.
It might hold for a quick bounce to 0.16-0.17 target if RSI stays oversold, but watch for deeper dip risk to 0.14 on break—no breakout above 0.18 resistance soon.
Tracking 50 EMA crossover & volume spikes.
Stay cautious! 🔴⚠️
#HBAR #CryptoTrends #AltcoinAnalysis

$HBAR Trendline Breach – Support Panic Test?BINANCE:HBARUSDT CRYPTOCAP:HBAR Trendline Breach – Support Panic Test?
Current trend: HBAR's broken below the descending trendline from 0.23 peaks, now slamming the 0.166 support amid BTC flush—aggressive sells, but hammer wicks hint at exhaustion 🛡️.
Hold support? 50/50 call; volume spike on dip could flush further, or buyers defend for V-reversal if RSI bounces.
Breakout above resistance? Remote without 0.20 reclaim—needs macro lift for any upside flip 🚀.
Dip risk? High to 0.15 on crack, liquidation fuel adding speed.
Target: Downside 0.16 test; rebound cap 0.18 if holds.
Indicators tracking: RSI (22, ultra-oversold), Trendline violation, and MACD death cross 📉.
#HBARTrading #CryptoDip #AltcoinPioneers

$HBAR Hedera's Downtrend Test – Support Savior?BINANCE:HBARUSDT CRYPTOCAP:HBAR Hedera's Downtrend Test – Support Savior?
Current trend: HBAR's tracing a bearish channel, probing the 0.155 support after rejection at 0.23 ceiling—downtrend line intact, but volume easing on sells hints at potential pause 🛡️.
Hold support? Decent odds yes; confluence with prior lows and EMA stack could spark defense if buyers pile in.
Breakout above resistance? Unlikely short-term without BTC lift—needs 0.23 close for bullish flip and 5-7% rally 🚀.
Dip risk? Elevated to 0.15 on channel break, especially if dominance rises.
Target: Bounce to 0.18 on hold; downside 0.14 if fails.
Indicators tracking: RSI (28, deep oversold), Trendline integrity, and MACD histogram contraction 📉.
#HBARTrading #CryptoSupport #FiboTrendCrypto

$HBAR Support Bounce, Hashgraph Hustle?BINANCE:HBARUSDT CRYPTOCAP:HBAR Support Bounce, Hashgraph Hustle? 📊🔗
HBAR's 1H trend bullish, gripping key support ~0.166 with volume pickup—network bulls stepping in!
Expect firm hold, breakout above 0.19 resistance targeting 0.205.
Deeper dip risk low (watch 0.16), but secure stops.
RSI ~53 (neutral climb), 50 EMA test, MACD histogram positive.
Hedera heating up! 🚀
#HBAR #CryptoTrading #AltcoinBull
