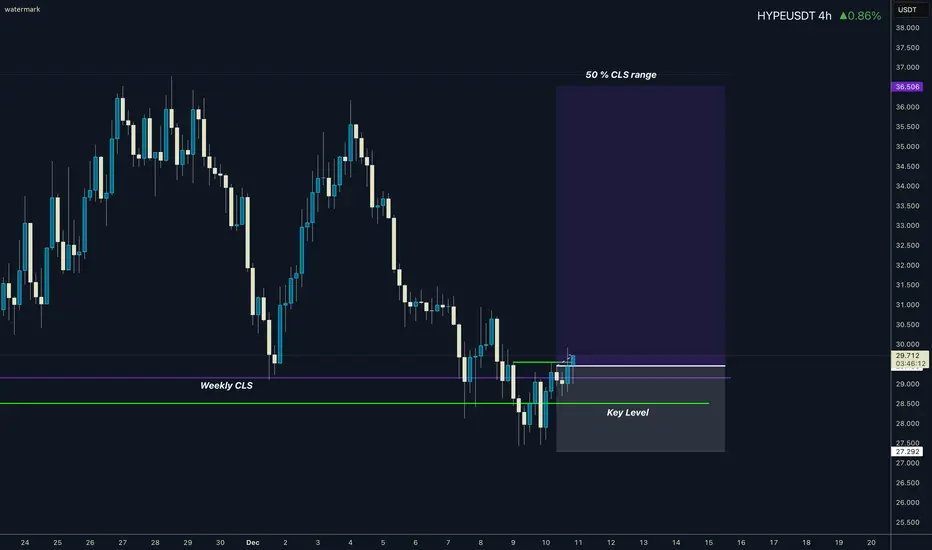
HYPE I Weekly CLS Range I Model 1Hi friends, new range created. As always we are looking for the manipulation in to the key level around the range. Don't forget confirmation switch from manipulation phase to the distribution phase to make the setup valid. Stay patient and enter only after change in order flow. If price reaches Its
HYPE price analysis#HYPE Third attempt to form a bottom — will it hold above $36?
The price of OKX:HYPEUSDT is again testing the same demand zone where two previous rebounds were formed.
At the moment, the key factor remains unchanged:
Key Levels
$36 — critical level that must be reclaimed and held
$49–50 —

HYPE/USDT Long
— Support level retest, strong higher-timeframe convergence, falling wedge (reversal pattern), bullish signals across altcoins
— Entry: $29.20 (market buy)
— Stop-loss: $26.85 — 8.5% price movement from entry to stop (NOT account loss)
— Target: $37
— Risk per trade: 0.5% of total equity (actual l

HYPE ready for more gain 14% gain toward 33$Hi the support and resistances on the chart are based on the previous data and weekly candlesticks if KUCOIN:HYPEUSDT holds this last support the potential of 14% gain is logical toward 33$

$HYPE - Swing Point RetestThere’s been a lot of noise around Hyperliquid lately as it slowly gives up market share, and the price action is starting to show that pressure. The real issue here looks structural rather than just sentiment-driven. New competition from platforms like Lighter and Variational is absorbing retail fl

$HYPE 4H CHART UPDATE 📌A Triple Bottom pattern is visible on the HYPE 4H CHART ✅
📌 It is currently consolidating at a strong support zone ✅
📌 If this support zone continues to hold and a bullish reversal occurs, we can expect the price to rise 🔥💣

HYPE Approaching Key Reversal ZoneHYPE is approaching a critical decision zone after a long corrective move inside a descending channel. Price has returned to the mid-range supply zone, where previous reactions created strong turning points. This area now acts as the major pivot for the next directional leg.
After the recent liqui

Lingrid | HYPEUSDT Consolidation Phase After Prolonged DropKUCOIN:HYPEUSDT perfectly played out my previous trading idea . Price is pressing into the 38 region where the descending trendline and horizontal resistance intersect, creating a heavy confluence that has capped every rally since November. The recent bounce off the double-bottom shows relief flow

HYPE/USDT Chart Analysis 5-Dec-25Stop Loss: 29.336
Buy Stop: 49.881
Take Profit 1: 59.795
Take Profit 2: 70.290
Symmetrical Triangle has formed in a day chart pattern.So i expect that it can be bullish and hit the tips divergence has been found in (RSI) chart pattern.So let see and hope for the best.
⚠️ Always remember to prote

Hyperliquid (HYPER) Update, Lower Comming? Hyperliquid continues to weaken as price trades around the $29 support zone with fading bullish volume.
The market structure remains bearish with clear lower highs and lower lows forming across multiple time frames.
A failure to hold $29 would likely trigger a deeper expansion toward the next hig

See all ideas
Summarizing what the indicators are suggesting.
Oscillators
Neutral
SellBuy
Strong sellStrong buy
Strong sellSellNeutralBuyStrong buy
Oscillators
Neutral
SellBuy
Strong sellStrong buy
Strong sellSellNeutralBuyStrong buy
Summary
Neutral
SellBuy
Strong sellStrong buy
Strong sellSellNeutralBuyStrong buy
Summary
Neutral
SellBuy
Strong sellStrong buy
Strong sellSellNeutralBuyStrong buy
Summary
Neutral
SellBuy
Strong sellStrong buy
Strong sellSellNeutralBuyStrong buy
Moving Averages
Neutral
SellBuy
Strong sellStrong buy
Strong sellSellNeutralBuyStrong buy
Moving Averages
Neutral
SellBuy
Strong sellStrong buy
Strong sellSellNeutralBuyStrong buy
Displays a symbol's price movements over previous years to identify recurring trends.