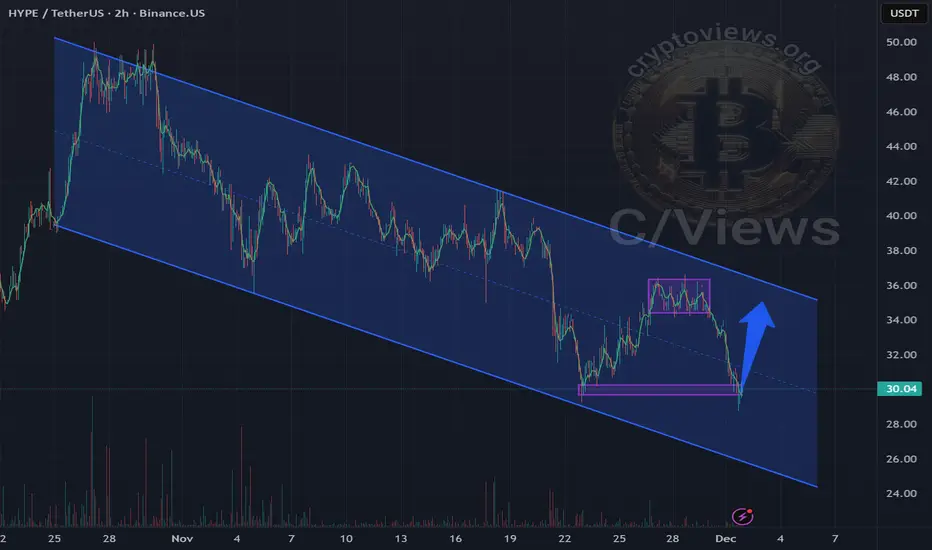
HYPE price analysis#HYPE Third attempt to form a bottom — will it hold above $36?
The price of OKX:HYPEUSDT is again testing the same demand zone where two previous rebounds were formed.
At the moment, the key factor remains unchanged:
Key Levels
$36 — critical level that must be reclaimed and held
$49–50 — realistic short-term target if momentum flips
Breakdown below current support would open room for a deeper retrace
A successful breakout above $36 would confirm buyer strength and could trigger a short-term rally into the New Year period.
Question: Do you expect #HYPE to reclaim $36 and move toward $50, or is another sweep of the lows more likely?
______________
◆ Follow us ❤️ for daily crypto insights & updates!
🚀 Don’t miss out on important market moves
🧠 DYOR | This is not financial advice, just thinking out loud
Market insights

HYPE/USDT Long
— Support level retest, strong higher-timeframe convergence, falling wedge (reversal pattern), bullish signals across altcoins
— Entry: $29.20 (market buy)
— Stop-loss: $26.85 — 8.5% price movement from entry to stop (NOT account loss)
— Target: $37
— Risk per trade: 0.5% of total equity (actual loss if stop is hit)
— Position size: 5% of total equity, 10x leverage
— Risk/Reward: 1:3

Hyperliquid (HYPE) Daily | Smart Money Context
Looking at HYPE without bias, the structure is already clear. After a strong expansion phase, price entered distribution and failed to hold previous value areas. The recent sell-off is not impulsive panic it’s controlled and systematic, which is typical for smart money exits rather than retail fear.
Key observations:
Market structure is bearish: lower highs and lower lows are intact
Previous demand zones did not hold and flipped into resistance
Current price is trading below major distribution areas, with no strong buyer response yet
The highlighted red zones above represent areas where supply previously dominated. As long as price stays below them, any bounce should be treated as a corrective move, not a trend reversal.
Below current price, liquidity is clearly resting in the 21–18 range, with a deeper magnet around the lower demand cluster. This is where a real reaction could appear but only if we see slowing momentum, absorption, and compression.
This is not a market to anticipate bottoms.
This is a market to wait for confirmation.
Smart money does not chase.
Smart money waits for price to prove intent.
For now, HYPE is not about aggressive longs.
It’s about patience, context, and reaction not prediction.

HYPE ready for more gain 14% gain toward 33$Hi the support and resistances on the chart are based on the previous data and weekly candlesticks if KUCOIN:HYPEUSDT holds this last support the potential of 14% gain is logical toward 33$

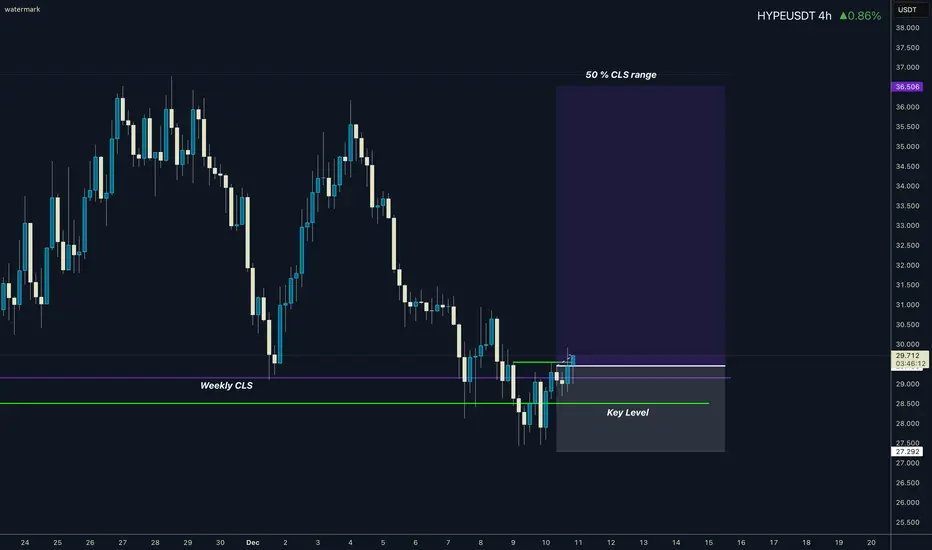
HYPE I Weekly CLS Range I Model 1Hi friends, new range created. As always we are looking for the manipulation in to the key level around the range. Don't forget confirmation switch from manipulation phase to the distribution phase to make the setup valid. Stay patient and enter only after change in order flow. If price reaches Its model 2 we are targeting full range.
🧩 Complete process and Strategy explained 👇 Click Below
I promised myself I’d become the person I once needed the most as a beginner. Below are links to a powerful lessons I shared on Tradingview. Hope it can help you avoid years of trial and error I went thru.
📊 Sharpen your trading Strategy
⚙️ 100% Mechanical System - Complete Strategy
🔁 Daily Bias – Continuation
🔄 Daily Bias – Reversal
🧱 Key Level – Order Block
📉 How to Buy Lows and Sell Highs
🎯 Dealing Range – Enter on pullbacks
💧 Liquidity – Basics to understand
🕒 Timeframe Alignments
🚫 Market Narratives – Avoid traps
🐢 Turtle Soup Master – High reward method
🧘 How to stop overcomplicating trading
🕰️ Day Trading Cheat Code – Sessions
🇬🇧 London Session Trading
🔍 SMT Divergence – Secret Smart Money signal
📐 Standard Deviations – Predict future targets
🎣 Stop Hunt Trading
🧠 Level Up your Mindset
🛕 Monk Mode – Transition from 9–5 to full-time trading
⚠️ Trading Enemies – Habits that destroy success
🔄 Trader’s Routine – Build discipline daily
💪 Get Funded - $20 000 Monthly Plan
🛡️ Risk Management
🏦 Risk Management for Prop Trading
📏 Risk in % or Fixed Position Size
🔐 Risk Per Trade – Keep consistency
Hyperliquid Technical Analysis - Lower Comming? Hyperliquid price has reacted at the 0.618 Fibonacci golden pocket, but the quality of the bounce remains weak. The move higher has occurred on low volume, suggesting limited buyer conviction rather than a confirmed trend reversal.
The $27 level is now a critical area to monitor. As long as price remains above this support, short-term stabilization is possible. However, acceptance below $27 would open the probability of a cascading, capitulation-style move toward the $19 support region, where deeper liquidity is located.
Key Levels & Structure:
- Golden Pocket (0.618 Fibonacci): Current reaction zone
- Key Support: $27
- Downside Target: $19
What to Expect:
Without strong volume confirmation or a reclaim of key resistance levels, the bounce is likely corrective. A breakdown below $27 would increase downside risk.

Hyperliquid still on a downtrend until its not. HYPE is still moving within a clear descending channel, but the structure is starting to tighten.
Price has bounced from the lower end of the channel and is now consolidating beneath mid-range resistance. This kind of compression usually precedes a larger move.
Momentum is improving. Indicators are holding higher lows while price moves sideways, showing that downside pressure is fading. Selling into this area continues to get absorbed rather than accelerated.
From a structure standpoint, holding the lower channel keeps the range-reclaim scenario intact. A push back through the middle of the range would shift the bias toward the upper end, while losing support would put the downtrend back in control.
This is a key area where patience matters. Direction should become clearer on the next expansion.
What’s your take on HYPE from here?

$HYPE - Swing Point RetestThere’s been a lot of noise around Hyperliquid lately as it slowly gives up market share, and the price action is starting to show that pressure. The real issue here looks structural rather than just sentiment-driven. New competition from platforms like Lighter and Variational is absorbing retail flow, and fewer traders seem willing to tolerate higher fees. That shift has led to a sharp drop in Hyperliquid’s volumes and fee generation — both crucial components of its valuation.
TECHNICAL OUTLOOK:
KUCOIN:HYPEUSDT just hit its lowest level since May 21, with several large leveraged positions sitting in the $20–$30 zone. With so much open interest vulnerable below price, it makes sense that buyers are cautious. Polymarket is currently pricing a 56% chance of HYPE trading below $24, which lines up with the prevailing downtrend.
On the 1-hour timeframe, price is capped around $29.5. If it can’t reclaim that level soon, a move back toward $28.4–$28 looks likely. In the short term, a clean swing-point retest at $28 — or even a dip toward $27.5 — could offer a decent long setup.

$HYPE 4H CHART UPDATE 📌A Triple Bottom pattern is visible on the HYPE 4H CHART ✅
📌 It is currently consolidating at a strong support zone ✅
📌 If this support zone continues to hold and a bullish reversal occurs, we can expect the price to rise 🔥💣

HYPE Mirrors ORDI’s Bearish Top — Lower Targets AheadThe structure on HYPE looks very similar to what we previously saw on ORDI. Both assets formed a clear bearish reversal structure at their local highs, followed by a breakdown from a rising wedge.
Based on this price action, I wouldn’t consider buying HYPE here — the chart suggests that it’s only a matter of time before the price continues moving lower.
My primary downside targets are:
$13–12
$6.6–5
Until the market shows a confirmed shift in structure, the trend remains bearish.

HYPE/USDT Long Set-up— Test of a strong support zone, strong oversold conditions, a wedge pattern confirmed by higher-timeframe convergence
— Entry: $26.40 — Market buy
— Stop: $24.80 — 5.7% (this is the price movement from entry to stop, NOT the percentage loss)
— Target: $35.50
Risk per trade: 1% of the total deposit (this is the actual loss risk)
Position size: 17% of the total deposit, 10x leverage
RR: 1:6

HYPEUSDT - Probably Gone by the Time You Read This Alright traders, this is one of those setups.
Quick scalp…
or quick dump…
and honestly, it will probably be gone by the time I finish writing this analysis. 😅
But hey — let’s try it anyway.
Macro just came out mixed,
which usually means range mode activated.
And when the market ranges,
HYPE loves to do its little chaotic moves inside the box.
So yeah:
• fast idea
• fast execution
• zero attachment
I don’t even have much time to explain this one properly,
because it’s probably already moving as we speak. 😂
Quick analysis, quick decision, quick outcome.
Enjoy — and good luck traders! 🚀📉😄

$HYPE LONG IDEA Even though many people on Twitter are very hype I can see a path for this to go through to possibly 40 or $50
I haven't seen a better daily bullish divergence like this, I would like to see it reclaim $30 .6 first and then I would start scaling in slowly into LONGS

HYPE Update📊 HYPE Update
HYPE tried to push through the red resistance zone 🔴 but couldn’t break out.
Price has been rejected at this level, showing it remains a strong barrier ⚠️📉.

HYPEUSDTSo far, the price has retraced about 50%, and on the weekly chart, a bearish pin bar has slightly increased fear. If the weekly candle closes as a strong bearish pin bar at the end of the week, many who haven’t sold yet may start selling, and the price could drop toward the lower levels shown in the chart.
However, if the price completes its triple bottom pattern on the daily timeframe, as you can see, and demand appears from here, the pessimistic scenario may not happen.
Personally, I remain a long-term buyer, and I will continue accumulating this coin with every dip.

HYPEGETTEX:HYPE is trading below 30 within a descending channel. Structure suggests compression ahead of expansion. A confirmed breakout from this range opens the door for roughly 95 percent upside from current levels if momentum follows through.

FireHoseReel | HYPE on 0.618 Fibonacci Decision Zone🔥 Welcome To FireHoseReel !
Let’s jump into HyperLiquid (HYPE) market analysis.
👀 HYPE 1H Overview
HYPE is currently trading near a key support zone and is forming a lower low compared to the previous bottom. This area also aligns with the 0.618 Fibonacci retracement, making it a critical reaction zone.
📊 Volume Analysis
HYPE volume has dropped significantly. The first strong increase in volume is likely to define the next major move. Volume is the most reliable confirmation here.
✍️ HYPE Trading Scenarios
🟢 Long Scenario:
A breakout above $35.945, either through a short squeeze or strong buy volume, can activate a bullish move to the upside.
🔴 Short Scenario:
A breakdown below the current support near $33.179 with rising sell volume can trigger a solid short setup.
🧠 Protect your capital first. No setup is worth blowing your account. If risk isn’t controlled, profit means nothing. Trade with rules, not emotions.

HYPE/USDT Chart Analysis 5-Dec-25Stop Loss: 29.336
Buy Stop: 49.881
Take Profit 1: 59.795
Take Profit 2: 70.290
Symmetrical Triangle has formed in a day chart pattern.So i expect that it can be bullish and hit the tips divergence has been found in (RSI) chart pattern.So let see and hope for the best.
⚠️ Always remember to protect your capital with a proper stop-loss and disciplined risk management.

Lingrid | HYPEUSDT Consolidation Phase After Prolonged DropKUCOIN:HYPEUSDT perfectly played out my previous trading idea . Price is pressing into the 38 region where the descending trendline and horizontal resistance intersect, creating a heavy confluence that has capped every rally since November. The recent bounce off the double-bottom shows relief flow, but structure remains bearish as long as price trades beneath the broader channel. Momentum into resistance is fading, and the consolidation suggests exhaustion rather than a breakout attempt.
If sellers reclaim control at the upper boundary again, it may slide back toward 30, where the support floor and demand pocket converge. This remains the key magnet for downside continuation before any larger reaction can develop.
➡️ Primary scenario: rejection from 38 → continuation toward 30.
⚠️ Risk scenario: a decisive close above 38 shifts momentum and exposes the path toward 43–45.
If this idea resonates with you or you have your own opinion, traders, hit the comments. I’m excited to read your thoughts!

HYPE Approaching Key Reversal ZoneHYPE is approaching a critical decision zone after a long corrective move inside a descending channel. Price has returned to the mid-range supply zone, where previous reactions created strong turning points. This area now acts as the major pivot for the next directional leg.
After the recent liquidity sweep, the market is showing early signs of stabilization. The reaction inside the demand pocket indicates that buyers are slowly stepping in, although the overall structure is still corrective until the mid-range is reclaimed.
The next movement will likely be defined by how price behaves around the highlighted zone.
Key Technical Points
• Price has reached a major mid-range supply block
• Reaction from the lower channel boundary confirms buyer interest
• A break above the supply zone unlocks momentum toward the upper channel
• Failure to reclaim the zone risks a deeper sweep toward lower liquidity levels
• Volatility is expected as price compresses inside the range
Bullish Scenario
If price reclaims the shaded zone with sustained strength, HYPE may initiate a trend reversal. This can open the door for a move toward the channel top and ultimately toward the 50-52 region.
Bearish Scenario
If rejection occurs from this zone, price may rotate back toward the lower boundary of the channel. A deeper sweep of liquidity can occur before any strong reversal attempt.
Simple View
HYPE is sitting at a decisive supply zone. Reclaiming it leads to upside continuation. Rejecting it leads to another leg down. This is a pivotal moment.

Hyperliquid (HYPER) Update, Lower Comming? Hyperliquid continues to weaken as price trades around the $29 support zone with fading bullish volume.
The market structure remains bearish with clear lower highs and lower lows forming across multiple time frames.
A failure to hold $29 would likely trigger a deeper expansion toward the next high-time-frame support near $19.
Key Points:
- Price trading at value area low ($29)
- Weak bullish volume and no accumulation
- Next major support sits at $19
What to Expect:
A breakdown below $29 increases the probability of a fast move toward $19. Bulls must reclaim structure with stronger volume to shift momentum.

HYPE/USDT LONGlooking for hype to go up to $33 then get rejected, slight fall back and continue to the upside to $34-$36.

HYPE forming a bullish flag with consolidationHYPE continues to move within a global bull flag pattern
Currently, the price is declining to the liquidation zone (lower purple area)
The price is consolidating at this level
A liquidity zone has formed above, which is more likely to be taken
The movement will likely continue to its upper boundaries
Current price: $28.86