#DXY #F.US.SFX Action Areas For The Trading Week AheadIn this update we review the recent price action in the Dollar Index and identify some high probability action areas for the trading week ahead
*Past performance is not indicative of future results
SDX1! trade ideas

20 Reasons For Sell DXY 🔆MULTI-TIME FRAME TOP-DOWN ANALYSIS OVERVIEW☀️
1:✨Eagle eye: The 12-month timeframe shows a clear bearish structure with the formation of a 3rd higher low (HL), indicating a continuation of the bearish move. The overall big picture is not favorable for the dollar. Last year, there was a large wick candle with a tap of the ultimate high order block.
2:📆Monthly: Currently, there is a clear bullish trend, but there is a visible consolidation (choch) on the monthly timeframe. A high volume candle at the top is followed by an inside doji and a fall in price. The price has been consolidating for the past 5 months, but there is potential for further downside towards the recent order block around 98.00, which can be a profit booking area.
3:📅Weekly: The price has confirmed a valid high and formed an internal consolidation (choch), but the low is yet to be confirmed. Based on the bigger picture, we anticipate further downside moves until the 100 area. We should hold our sell positions until the price taps the order block area at 100. A corrective move is expected once it reaches that level.
4:🕛Daily: The daily timeframe shows a bearish structure with potential for further lows. The last low is still protected, but given the bearish trend, there is a high chance that bears can push the price towards the 100 level during the current impulsive move.
😇7 Dimension analysis
🟢 analysis time frame: Daily
5: 1 Price Structure: Bearish
6: 2 Pattern Candle Chart: A window (gap) is present, which can act as a Continuation In Pattern (CIP). Additionally, a descending triangle is putting downward pressure on the price.
7: 3 Volume: Volume increases during bearish moves, indicating more selling pressure. Until the market gives a clear signal, it is not advisable to consider buying at any level.
8: 4 Momentum UNCONVENTIONAL Rsi: The market has lost momentum, but it is not yet strongly in favor of the bears. A strong rejection at the window area or resistance at the 60 level is needed for price confirmation.
9: 5 Volatility measure Bollinger bands: After a big volatile move, the price needs to calm down and may enter a period of consolidation or make a minor correction towards the 20-day moving average before continuing its downside move towards the target.
10: 6 Strength ADX: The ADX indicates a sideways trend at this point.
11: 7 Sentiment ROC: There is no strength in the sentiment ROC.
✔️ Entry Time Frame: H1
12: Entry TF Structure: After a strong bearish trend, there is a consolidation (choch) pattern forming. Upon closer observation, the daily window, extreme order block, and structure high coincide at the same point, making it a strong supply area or rejection point. We will place a sell order when a strong signal is formed.
13: Entry Move: The entry move must be impulsive.
14: Support Resistance Base: Daily window, extreme order block, structure high.
15: FIB: Trigger event done based on H1 timeframe.
☑️ Final comments: Open sell entries at the market opening, and if the price goes further up near the window, consider a second sell entry. A third sell entry can be placed if the market creates an internal Breakout-Sell (BOS) signal.
16: 💡Decision: Sell
17: 🚀Entry: Sell between 102.885 and 102.2
18: ✋Stop Loss: 103.175
19: 🎯Take Profit: 1st target at 100.5, 2nd target at 99.5
20: 😊Risk to Reward Ratio: 1:4
🕛 Expected Duration: 10 days

#DXY #F.US.SFX H1 Fading The 103.20/30 For 102.30/20In this update we review the recent price action in the Dollar Index and identify the next high probability trading opportunity and price objectives to target
*Past performance is not indicative of future results

#DXY #F.US.SFX H4 Trading A Potential Wave 5In this update we review the recent price action in the Dollar Index and identify the next high probability trading opportunity and price objectives to target

USD bullish to consolidation range resistanceJust a quick note that as Biden signed the raise of the US debt ceiling, the USD is going to be bullish for a bit, and then meet the upper range resistance, and then lose it to get back to range support.
Projection Targets marked.

#DXY #F.US.SFX H1 100pips Lower From Resistance, What Next?In this update we review the recent price action in the Dollar Index and identify the next high probability trading opportunity and price objectives to target

USD Dollar possible longbullish order blocked formed on 4h time frame on 23rh may, 2023. price until hold 102.80 suspect bearish, if breach then may suspect more down. demand zone 103, sl 102.70, target: 104.30

DX1 DOLLAR💥1H-TIMEFRAME ANALYSISDX1 DOLLAR💥1H-TIMEFRAME ANALYSIS
💗Hello ladies and gentlemen
This is my new idea for 💥Dollar Index
I hope my idea is clear
Support me by like and share thank you
Stay Safe💯💲💲💲
Good luck💰😍

💥 DX1 DOLLAR 1D-TIMEFRAME ANALYSISDX1 DOLLAR💥1D-TIMEFRAME ANALYSIS
💗Hello ladies and gentlemen
This is my new idea for 💥Dollar Index
I hope my idea is clear
Support me by like and share thank you
Stay Safe💯💲💲💲
Good luck💰😍

Ready to geto to 105 After bouncing off the support at 101, the DXY is perfectly following the predicted trajectory, despite all the USD bearishness in the market. I am expecting a brief retest of 103.6 and then a push to 105 area. NFA

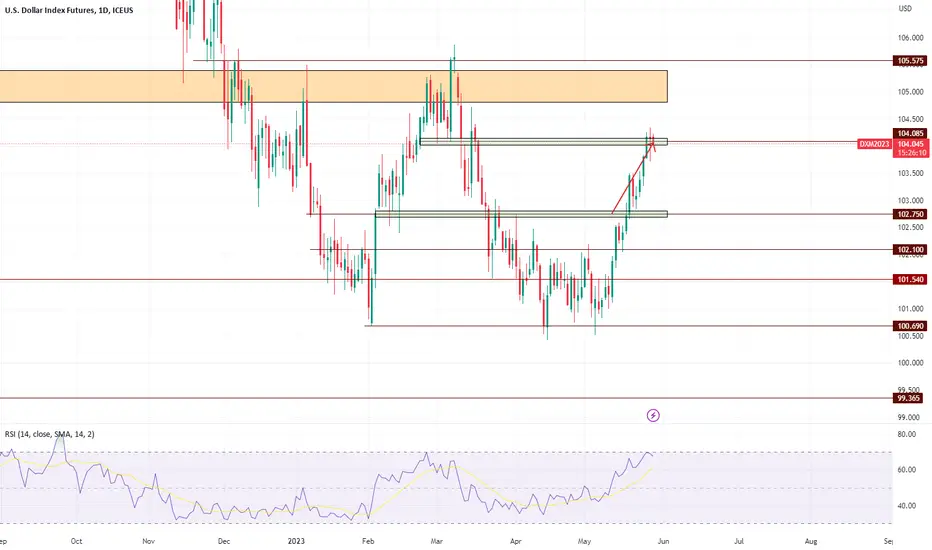
Dollar extendedThe breakout of the 102.75 resistance level has met the initial target at 104.085.
If momentum persist, the United States Dollar Index can push towards they key resistance zone at 105.0 region.
The current upside momentum is extended with RSI approaching 70 and if price is to reach the 105.0 with the current momentum, it will be considered at overextended and potentially sell opportunities can be looked into.
DXY index - long idea A stronger dollar may impact various sectors, including international trade, exports, and foreign investment. It could also influence the relative performance of other currencies and potentially reshape global financial markets.
The DXY index, is poised to close the gap at the significant level of 105. This development has garnered attention from market observers and traders, as it represents a potential shift in the currency's strength.
So I'm watching
Waiting for 105 , and after that will we look to some crypto positions
Thanks for attention

While everyone is bearish, the USD could surprize to the upside Everyone in bearish on the USD, but with the upcoing FED meeting and the price that found support at 101 level, we could see a breakout and a visti of the 200 SMA (ca. 102.9), with an extension to 103.6. This wouldn't suprize me, be prepared out there! NFA

#DXY #F.US.SFX H1 To Fade Towards 104.50'sIn this update we review the recent price action in the DXY and identify the next high probability trading opportunity and price objectives to target

DXY long - we need to close gap Gm people
Today we will look TVC:DXY chart
in 105 we have gap
so I think we will close this gap soon , i hope
but it's nfa
Have a nice day

Dollar break outThe United States Dollar Index overextends past the 102.75 resistance region last week.
As price is now extended, the Dollar potentially may retrace towards back to the 102.75, now support region or even the 102.100 support region before heading higher depending on the structure. A retest confirmation may push the Dollar towards the 104.085 resistance region.

DXY W1 Bullish Reversal, What Next?In this update we review the recent price action in the #DXY and identify the next high probability trading opportunity and price objectives to target

Dollar climb towards resistance levelThe United States Dollar Index broke out towards the upside, invalidating both the descending trend line and the daily 50 exponential moving average (EMA).
Price is met with resistance level at 102.75 which can push price back towards 101.54. However, if the resistance is broken through, we may see the Dollar push towards the 104.085 region.

LONG USD IN MAY- Based on Next Forward Contract
- Bullish on Dollar in coming weeks
- S&D: Previous Imbalance is current Demand Zone
- Wyckoff: accumulation pattern unfolding
- Pivots: Monthly M2 to Monthly M4 = Previous Year Open = Target
- Looking for downwards pressure on Majors in coming weeks

DXY H1 Looking To Fade Into 101.80'sIn this update we review the recent price action in the #DXY and identify the next high probability trading opportunity and price objectives ot target

Dollar remains weakThe United States Dollar Index attempts to push above the descending trend line but failed miserably as price reverses back below it.
If price were to break below the 100.69 region, price can potentially descending towards the 99.365 region.

USD to drop a bit more, and create ripplesThe week ended a little confused, post NFP and other announcements.
The only slight clarity here is that over the next week (or few weeks), we should see the USD dropping a bit more, breaking down both support lines, for a few days. IF "lucky", the USD futures should reach target at 99, even for a day or two.
Now, this comes with a bit of a stretch with volatility in the other parts of the market too, affecting commodities, indexes, forex etc.
Later analysis posts, is based on the background scenario in an increased likelihood of a USD decline.

USD looks to break last low and support... The USD Futures Daily chart is already pointing that way... Once it breaks the yellow support line, it will look for 99.
MACD slowing its ascent, while VolDiv is crossing down itself and below zero line.
TD Setup is bearish for the USD.
Bearish outlook overall.
