Dollar Index (DXY) Bearish Sequence Targets 97.7The Dollar Index (DXY) has broken decisively below the December 4 low at 98.76, establishing a clear bearish sequence from the November 21 peak. This structural decline favors continued downside momentum. The immediate target is the 100% Fibonacci extension measured from the November 21 peak, which
Related futures
US Dollar Seasonality Patterns for DecemberI delve into excel to assess seasonal patterns within the month of December for the US dollar index, EUR/USD, AUD/USD and USD/CHF.
Matt Simpson, Market Analyst at City Index.

DXY EXTREME BEARISH DIVERGENCE > ABOUT TO COME STRAIGHT DOWN!DXY Has been on a tear but I think thats about to end and I think it will end very quickly. There is multiple very strong bearish divergences on the weekly, across multiple indicators showing that a major move down is coming. I think we have reached the top for the DXY for a while and its about to

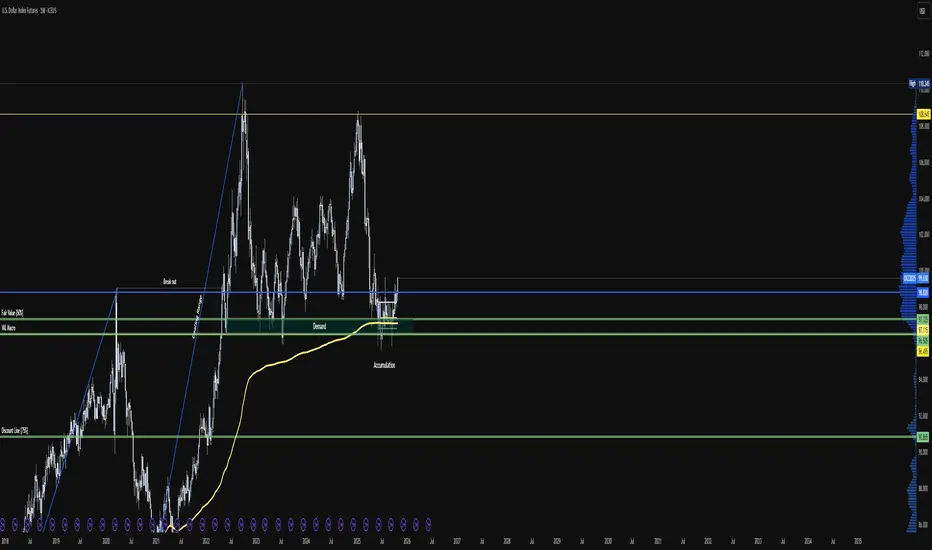
Dollar at a Turning Point: Base Building for a Breakout We believe a longer-term base is developing for the US dollar. At present, the market has reached a key level of resistance — the same level we saw at the end of 2023. While near-term consolidation is possible, the broader picture suggests strength.
Key points:
- The 200-day moving average has been

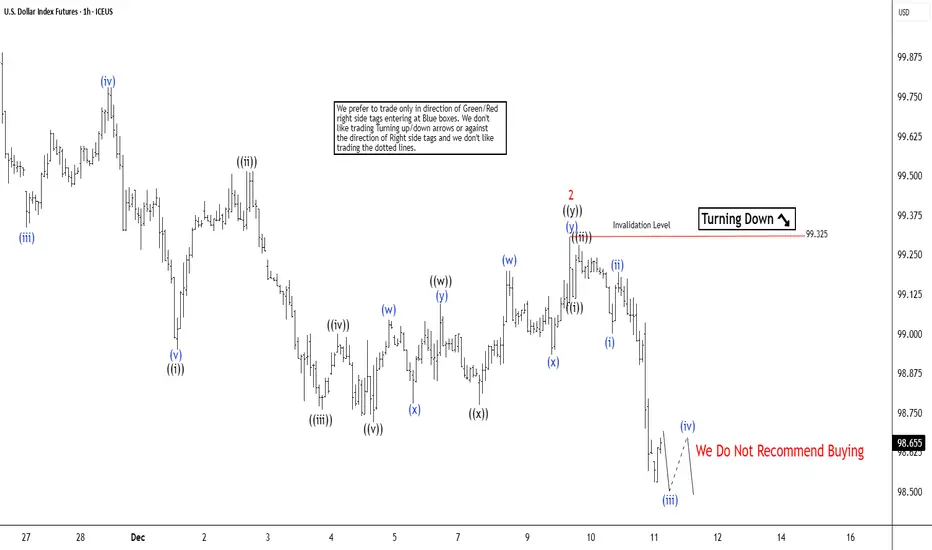
USD Index, AUD/USD Hint at Near Term ReversalsAs outlined in last week’s video, I suspect the US dollar may have the potential to break higher as part of its wave C before momentum realigns with its dominant bearish trend. However, Monday’s shooting star candle just below 100, coupled with an overbought RSI (2), warns of a potential pullback ah

U.S. Dollar Index – Structural OutlookAfter eight months of sustained weakness in the USD, we now observe a clear phase of accumulation within a macro demand zone, precisely aligned with both the Fair Value (50%) retracement of the previous major dealing range and the macro VAL (Value Area Low).
This confluence is reinforced by the anc
USD Bullish Reversal Into Resistance - Next Week Is Pivotal The Fed have pushed back on committing to another 25bp cut in December, maintaining a data-dependent stance. Traders will keep a close watch on next week’s ADP employment and ISM reports to gauge the likelihood of a Christmas cut from the Fed. I update my longer-term outlook for the US dollar index

DXY. Long-term goals for long 1W time frameThe price has entered the long-term optimal trade entry zone. testing the points. And withdrawing liquidity. The upward trend has persisted. On the daily chart, we already have a change in character. And an upward trend. to understand what this DXY chart is. Read it on Wikipedia. Because It is quite

Shall DXY keep Bearish?Waiting for break key level of DXY if it occurs DXY will hit which level next?
Let's See!

US DOLLAR DOUBLE BOTTOM JUST CONFIRMED!Hey Traders so looking at US Dollar the charts just confirmed imo a strong double bottom formation!
Markets are crazy just last week I said it looked like the dollar had bottomed but then with Gold Rally and Euro Rally I got confused but yet the charts don't lie look even as Gold rally continued Th

See all ideas
A representation of what an asset is worth today and what the market thinks it will be worth in the future.
Displays a symbol's price movements over previous years to identify recurring trends.