IDID is in a clear and strong bearish trend — the price has been falling for more than a year.
No higher lows have formed, which means buyers are showing no strength.
The candles are small and red → low volume + selling pressure dominance.
Additionally, large upward “spike” wicks are visible, which

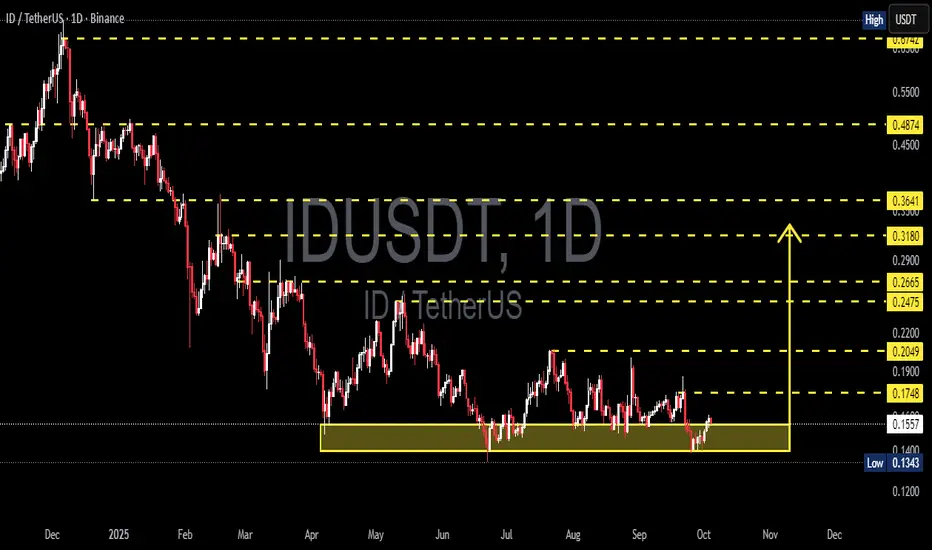
IDUSDT — Consolidation at Key Support, Breakout or Breakdown?🔎 Technical Overview
IDUSDT is currently consolidating within a major support zone at 0.1343 – 0.1554 (highlighted yellow box on the chart). This level has been tested multiple times since May 2025, proving that buyers are still defending it.
The price action forms a rectangle accumulation zone, b
IDUSDT UPDATE#ID
UPDATE
ID Technical Setup
Pattern: Bullish Falling Wedge Pattern
Current Price: $0.1779
Target Price: $0.298
Target % Gain: 65.80%
BME:ID is breaking out of a falling wedge pattern on the 1D timeframe. Current price is $0.1779 with a target near $0.298, showing about 66% potential upside.

IDUSDT 1D#ID is moving inside a symmetrical triangle on the daily timeframe. In case of a breakout above the triangle resistance and the daily SMA200, the potential targets are:
🎯 $0.2203
🎯 $0.2468
🎯 $0.2734
🎯 $0.3112
🎯 $0.3593
⚠️ Always remember to use a tight stop-loss and follow proper risk management.

ID/USDT — Long Consolidation for Reversal or Breakdown Ahead?📌 Overview
The ID/USDT pair has been moving in a prolonged consolidation phase since May 2025, trapped within a tight accumulation box between 0.1343–0.1674.
This zone has acted as a critical demand area, tested multiple times but still holding strong, showing significant buyer defense.
However, t

IDBINANCE:IDUSDT
#ID/ USDT
Entry range (0.1500- 0.1650)
SL 4H close below 0.1460
T1 0.18
T2 0.26
T3 0.30
Extra Target is optional 0.45
_______________________________________________________
Golden Advices.
********************
* collect the coin slowly in the entry range.
* Please calculate

IDUSDT 1D#ID is on the verge of breaking above the symmetrical triangle and the daily SMA100. Keep an eye on it — a confirmed breakout could trigger the following targets:
🎯 $0.2125
🎯 $0.2608
🎯 $0.2999
🎯 $0.3390
🎯 $0.3946
⚠️ As always, use a tight stop-loss and apply proper risk management.

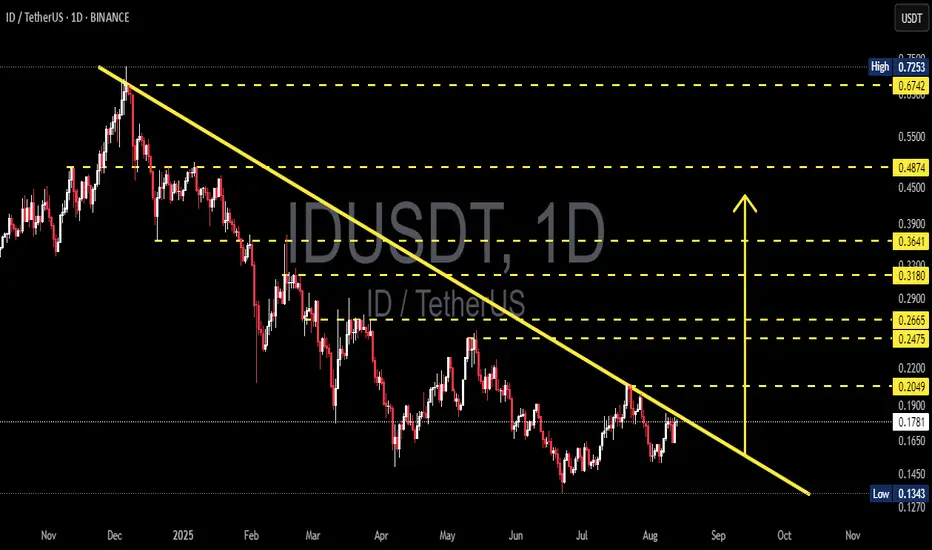
ID/USDT — Final Battle at the Multi-Month Downtrend Line!📌 Market Structure Overview
Since peaking in late 2024, ID/USDT has been trapped under a relentless multi-month downtrend line lasting almost 10 months. Every rally attempt has been shut down at this descending wall.
Now, the market is at a critical inflection point — price is pressing right agains
ID/USDT – Parabolic Reversal LoadingPrice action is coiling for a parabolic move, signaling the early stages of a major reversal trend. Accumulation structure is forming as buyers step in to absorb supply, creating the foundation for a powerful breakout. A confirmed push above key resistance could ignite the next impulsive leg, shifti

$IDUSDT 1D chart The BINANCE:IDUSDT 1D chart shows a potential breakout from its long downtrend.
Price recently bounced off a strong demand zone at $0.1785 and is now testing above the descending trendline.
If momentum holds, a move toward the $0.4004 target +131% is possible.
Watch for strong volume confirma

See all ideas
Summarizing what the indicators are suggesting.
Oscillators
Neutral
SellBuy
Strong sellStrong buy
Strong sellSellNeutralBuyStrong buy
Oscillators
Neutral
SellBuy
Strong sellStrong buy
Strong sellSellNeutralBuyStrong buy
Summary
Neutral
SellBuy
Strong sellStrong buy
Strong sellSellNeutralBuyStrong buy
Summary
Neutral
SellBuy
Strong sellStrong buy
Strong sellSellNeutralBuyStrong buy
Summary
Neutral
SellBuy
Strong sellStrong buy
Strong sellSellNeutralBuyStrong buy
Moving Averages
Neutral
SellBuy
Strong sellStrong buy
Strong sellSellNeutralBuyStrong buy
Moving Averages
Neutral
SellBuy
Strong sellStrong buy
Strong sellSellNeutralBuyStrong buy
Displays a symbol's price movements over previous years to identify recurring trends.