IDID is in a clear and strong bearish trend — the price has been falling for more than a year.
No higher lows have formed, which means buyers are showing no strength.
The candles are small and red → low volume + selling pressure dominance.
Additionally, large upward “spike” wicks are visible, which usually indicate:
👉 a liquidity grab → followed by a drop.
Market insights

IDUSDT — Consolidation at Key Support, Breakout or Breakdown?🔎 Technical Overview
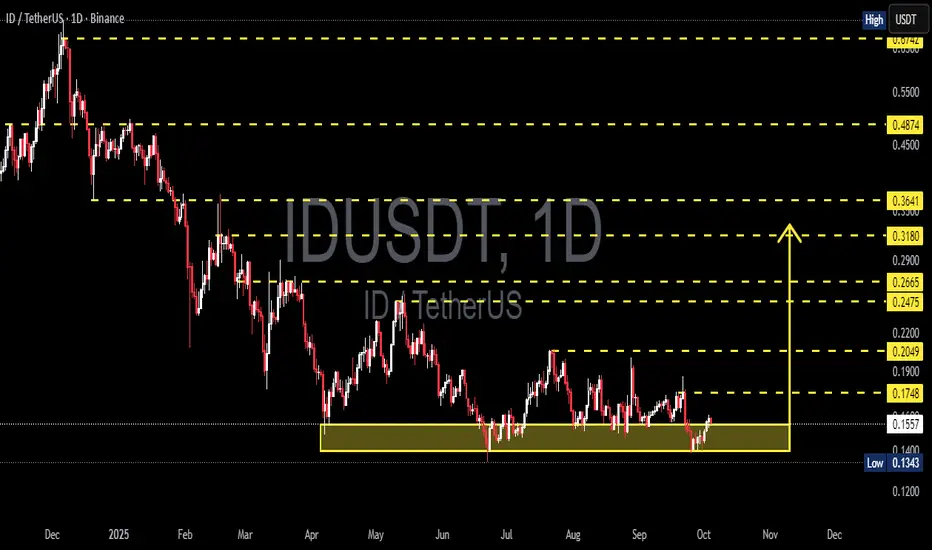
IDUSDT is currently consolidating within a major support zone at 0.1343 – 0.1554 (highlighted yellow box on the chart). This level has been tested multiple times since May 2025, proving that buyers are still defending it.
The price action forms a rectangle accumulation zone, but also resembles a descending triangle as lower highs continue to appear. This means the next move will depend on whether we see a confirmed breakout or a breakdown.
---
🟢 Bullish Scenario
If the price manages to hold above support and break key resistance levels:
First trigger: daily close above 0.1748
Strong confirmation: daily close above 0.2049
Upside targets:
🎯 0.2475 – 0.2665
🎯 0.3180
🎯 0.3641
Each higher resistance break increases the probability of a trend reversal.
---
🔴 Bearish Scenario
If selling pressure dominates and the support fails:
Main trigger: daily close below 0.1343
Implication: breakdown from the accumulation zone → continuation of the downtrend.
Downside target: psychological area below 0.120 (check lower TF for minor supports).
A breakdown here could extend the bearish trend significantly.
---
📌 Visible Patterns
Rectangle Accumulation: price consolidating in a horizontal range, awaiting direction.
Descending Triangle: sellers still pressuring with lower highs.
Demand Zone: 0.1343 – 0.1554 is the key battleground between bulls and bears.
---
⚖️ Conclusion
IDUSDT is at a critical decision point.
Bullish case: breakout above 0.1748 – 0.2049 with strong volume, targeting higher resistance zones.
Bearish case: breakdown below 0.1343, opening downside potential toward 0.120 and lower.
Traders should wait for a confirmed breakout/breakdown before entering positions, while maintaining strict risk management (stop loss at invalidation levels).
---
📌 Key Levels for IDUSDT
Support: 0.1343 – 0.1554
Resistance: 0.1748 – 0.2049
Bullish Targets: 0.2475 – 0.2665 → 0.3180 → 0.3641
Bearish Target: below 0.1343 (towards 0.12 zone)
---
#IDUSDT #CryptoAnalysis #Altcoin #Breakout #SupportResistance #TechnicalAnalysis #BullishScenario #BearishScenario
IDUSDT UPDATE#ID
UPDATE
ID Technical Setup
Pattern: Bullish Falling Wedge Pattern
Current Price: $0.1779
Target Price: $0.298
Target % Gain: 65.80%
BME:ID is breaking out of a falling wedge pattern on the 1D timeframe. Current price is $0.1779 with a target near $0.298, showing about 66% potential upside. The breakout confirms bullish momentum with structure favoring continuation. Always use proper risk management.
Time Frame: 1D
Risk Management Tip: Always use proper risk management.

IDUSDT 1D#ID is moving inside a symmetrical triangle on the daily timeframe. In case of a breakout above the triangle resistance and the daily SMA200, the potential targets are:
🎯 $0.2203
🎯 $0.2468
🎯 $0.2734
🎯 $0.3112
🎯 $0.3593
⚠️ Always remember to use a tight stop-loss and follow proper risk management.

ID/USDT — Long Consolidation for Reversal or Breakdown Ahead?📌 Overview
The ID/USDT pair has been moving in a prolonged consolidation phase since May 2025, trapped within a tight accumulation box between 0.1343–0.1674.
This zone has acted as a critical demand area, tested multiple times but still holding strong, showing significant buyer defense.
However, the broader structure remains bearish (lower highs & lower lows since December 2024), meaning this consolidation is a make-or-break stage:
Is it a genuine accumulation before a bullish reversal?
Or just distribution before another breakdown?
---
🔎 Pattern & Structure
Main pattern: Horizontal range / accumulation box.
Characteristics: Sideways movement, low volatility, frequent false breakouts with long wicks → signaling a strong tug-of-war between bulls and bears.
Key technical levels:
Support: 0.1343 (range low)
Resistance: 0.1674 (range high)
Immediate upside levels: 0.2049 – 0.2475 – 0.3180
Major supply zones: 0.3641 – 0.4874 – 0.6742
---
🟢 Bullish Scenario
If price manages to break above 0.1674 and especially confirm above 0.2049 with strong volume:
1. Signals the start of a new bullish momentum after months of accumulation.
2. Potential upside targets:
TP1: 0.2475 (intermediate resistance)
TP2: 0.3180 (strong resistance zone)
TP3: 0.3641 (major supply zone)
3. Confirmation: Daily close above 0.205, supported by a retest holding as new support + volume expansion.
4. Bullish invalidation: A failed breakout where price falls back into the box (false breakout).
---
🔴 Bearish Scenario
If price breaks down below 0.1343 (range low):
1. Indicates buyers lost control of the demand zone.
2. Downside targets:
Psychological support: 0.120 – 0.110
Measured move of the range box: points toward ~0.100
3. Bearish continuation is confirmed if breakdown comes with high volume.
4. Bearish invalidation: A quick rebound back inside the box (false breakdown).
---
🎯 Trading Implications
For swing traders: This 0.134–0.167 range offers a prime opportunity to trade the box (buy support, sell resistance) until a breakout occurs.
For trend followers: Wait for a confirmed breakout/breakdown with volume before entering, to reduce false signal risk.
Risk management: Place stops just outside the box (below 0.134 for longs, above 0.167 for shorts). Risk no more than 1–2% per trade.
---
📌 Conclusion
ID/USDT is currently in a “calm before the storm” phase. This long consolidation will soon dictate the next major trend:
A confirmed breakout could trigger a strong reversal after the prolonged downtrend.
A breakdown would likely extend the bearish cycle toward deeper lows.
Traders should stay patient and wait for daily close confirmation with volume to validate the next direction.
---
#IDUSDT #CryptoAnalysis #TechnicalAnalysis #SupportResistance #Breakout #Bearish #Bullish #Altcoins #SwingTrading #Accumulation

IDBINANCE:IDUSDT
#ID/ USDT
Entry range (0.1500- 0.1650)
SL 4H close below 0.1460
T1 0.18
T2 0.26
T3 0.30
Extra Target is optional 0.45
_______________________________________________________
Golden Advices.
********************
* collect the coin slowly in the entry range.
* Please calculate your losses before the entry.
* Do not enter any trade you find it not suitable for you.
* No FOMO - No Rush , it is a long journey.

IDUSDT 1D#ID is on the verge of breaking above the symmetrical triangle and the daily SMA100. Keep an eye on it — a confirmed breakout could trigger the following targets:
🎯 $0.2125
🎯 $0.2608
🎯 $0.2999
🎯 $0.3390
🎯 $0.3946
⚠️ As always, use a tight stop-loss and apply proper risk management.

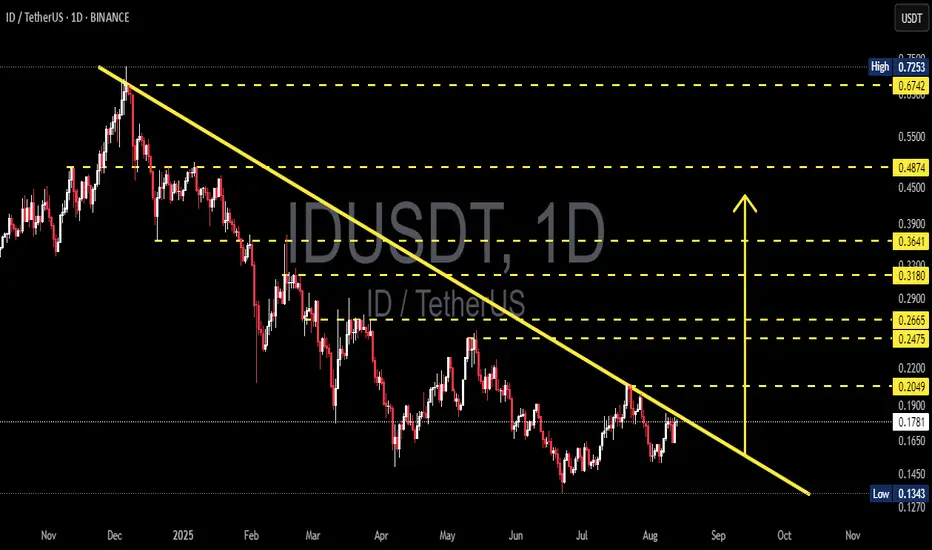
ID/USDT — Final Battle at the Multi-Month Downtrend Line!📌 Market Structure Overview
Since peaking in late 2024, ID/USDT has been trapped under a relentless multi-month downtrend line lasting almost 10 months. Every rally attempt has been shut down at this descending wall.
Now, the market is at a critical inflection point — price is pressing right against the trendline and sitting in the decision zone between 0.190–0.205.
A breakout here would not only be a technical victory for the bulls but could also trigger a shift in market psychology from seller dominance to buyer control.
---
📊 Key Levels to Watch
Major Resistances: 0.2049 → 0.2475 → 0.2665 → 0.3180 → 0.3641 → 0.4874 → 0.6742
Supports: 0.177–0.180 → 0.165 → 0.134–0.145 (major demand zone)
---
📐 Pattern & Sentiment Analysis
The dominant structure is a classic Descending Trendline Resistance, showing consistent lower highs under seller pressure.
However, there’s an early sign of sentiment shift — a higher low compared to the July bottom, suggesting that buyers are stepping in earlier and absorbing supply.
If price can close a daily candle above the trendline and 0.2049, we could see the start of a trend reversal rally toward higher resistance levels.
---
🚀 Bullish Scenario
1. Trigger: Daily close above the trendline + 0.2049.
2. Confirmation: Retest of 0.19–0.205 holds as new support.
3. Upside Targets:
Initial: 0.2475
Mid-term: 0.2665 → 0.3180
Extended: 0.3641 (psychological zone)
4. Invalidation: Closing back below 0.190 or losing 0.177–0.180.
---
📉 Bearish Scenario
1. Trigger: Sharp rejection from the trendline/0.19–0.205 zone.
2. Downside Targets:
First: 0.177–0.180
Next: 0.165
Extreme: 0.134–0.145 (historical low)
3. Invalidation: Sustained breakout above 0.205 with strong volume.
---
⚖️ Perspective & Risk Management
This is a “make or break” moment for ID/USDT.
Don’t rely solely on intraday spikes — wait for a confirmed daily close to avoid fakeouts.
Use the above S/R levels as tiered take-profit zones and for placing protective stops.
#IDUSDT #ID #Crypto #PriceAction #TechnicalAnalysis #DowntrendBreak #Breakout #SupportResistance #CryptoTrading
ID/USDT – Parabolic Reversal LoadingPrice action is coiling for a parabolic move, signaling the early stages of a major reversal trend. Accumulation structure is forming as buyers step in to absorb supply, creating the foundation for a powerful breakout. A confirmed push above key resistance could ignite the next impulsive leg, shifting the market into a sustained bullish phase.

$IDUSDT 1D chart The BINANCE:IDUSDT 1D chart shows a potential breakout from its long downtrend.
Price recently bounced off a strong demand zone at $0.1785 and is now testing above the descending trendline.
If momentum holds, a move toward the $0.4004 target +131% is possible.
Watch for strong volume confirmation to validate the breakout.
DYRO, NFA

IDUSDT Analysis ID ~ 4D Analysis
#ID Buy on retesting this buy zone or buy on successful breakout of the resistance line of this pattern. With a short term target of at least 10%+.

ID/USDTKey Level Zone: 0.20300 - 0.20500
HMT v8.1 detected. The setup looks promising, supported by a previous upward/downward trend with increasing volume and momentum, presenting an excellent reward-to-risk opportunity.
HMT (High Momentum Trending):
HMT is based on trend, momentum, volume, and market structure across multiple timeframes. It highlights setups with strong potential for upward movement and higher rewards.
Whenever I spot a signal for my own trading, I’ll share it. Please note that conducting a comprehensive analysis on a single timeframe chart can be quite challenging and sometimes confusing. I appreciate your understanding of the effort involved.
Important Note :
Role of Key Levels:
- These zones are critical for analyzing price trends. If the key level zone holds, the price may continue trending in the expected direction. However, momentum may increase or decrease based on subsequent patterns.
- Breakouts: If the key level zone breaks, it signals a stop-out. For reversal traders, this presents an opportunity to consider switching direction, as the price often retests these zones, which may act as strong support-turned-resistance (or vice versa).
My Trading Rules
Risk Management
- Maximum risk per trade: 2.5%.
- Leverage: 5x.
Exit Strategy
Profit-Taking:
- Sell at least 70% on the 3rd wave up (LTF Wave 5).
- Typically, sell 50% during a high-volume spike.
- Adjust stop-loss to breakeven once the trade achieves a 1.5:1 reward-to-risk ratio.
- If the market shows signs of losing momentum or divergence, ill will exit at breakeven.
The market is highly dynamic and constantly changing. HMT signals and target profit (TP) levels are based on the current price and movement, but market conditions can shift instantly, so it is crucial to remain adaptable and follow the market's movement.
If you find this signal/analysis meaningful, kindly like and share it.
Thank you for your support~
Sharing this with love!
HMT v2.0:
- Major update to the Momentum indicator
- Reduced false signals from inaccurate momentum detection
- New screener with improved accuracy and fewer signals
HMT v3.0:
- Added liquidity factor to enhance trend continuation
- Improved potential for momentum-based plays
- Increased winning probability by reducing entries during peaks
HMT v3.1:
- Enhanced entry confirmation for improved reward-to-risk ratios
HMT v4.0:
- Incorporated buying and selling pressure in lower timeframes to enhance the probability of trending moves while optimizing entry timing and scaling
HMT v4.1:
- Enhanced take-profit (TP) target by incorporating market structure analysis
HMT v5 :
Date: 23/01/2025
- Refined wave analysis for trending conditions
- Incorporated lower timeframe (LTF) momentum to strengthen trend reliability
- Re-aligned and re-balanced entry conditions for improved accuracy
HMT v6 :
Date : 15/02/2025
- Integrated strong accumulation activity into in-depth wave analysis
HMT v7 :
Date : 20/03/2025
- Refined wave analysis along with accumulation and market sentiment
HMT v8 :
Date : 16/04/2025
- Fully restructured strategy logic
HMT v8.1 :
Date : 18/04/2025
- Refined Take Profit (TP) logic to be more conservative for improved win consistency

ID is bearish for the mid-term (2D)Before anything, pay attention to the timeframe—it's a 2-day timeframe, so it will take time.
Given that a large-degree bearish triangle has completed, this coin may remain bearish in the mid-term. The red zone is where the next major bearish wave could start.
A daily candle closing above the invalidation level will invalidate this analysis.
For risk management, please don't forget stop loss and capital management
Comment if you have any questions
Thank You

#ID/USDT#ID
The price is moving in a descending channel on the 1-hour frame and is expected to continue upwards
We have a trend to stabilize above the moving average 100 again
We have a descending trend on the RSI indicator that supports the rise by breaking it upwards
We have a support area at the lower limit of the channel at a price of 0.2516
Entry price 0.2720
First target 0.2810
Second target 0.2895
Third target 0.3068

IDUSDT 5DID ~ 5D Analysis
#ID Buy gradually from here with a minimum target of 20%+
The reason, this is the lowest support for now.

#ID/USDT#ID
The price is moving in a descending channel on the 1-hour frame and is adhering to it well and is heading to break it upwards strongly and retest it
We have a bounce from the lower limit of the descending channel, this support is at a price of 0.3000
We have a downtrend on the RSI indicator that is about to break and retest, which supports the rise
We have a trend to stabilize above the moving average 100
Entry price 0.3322
First target 0.3156
Second target 0.3237
Third target 0.3322

IDUSDT 12H#ID is moving inside a falling wedge pattern on the 12H chart. It recently broke above the 12H MA50 and the pattern resistance with high volume but faced rejection at the top of the Ichimoku cloud. It remains very bullish—buy and hold. Targets are:
🎯 $0.4079
🎯 $0.4608
🎯 $0.5136
🎯 $0.5890
🎯 $0.6849

IDUSDT 120%-140% Gains – Bullish Momentum Confirmed!IDUSDT has successfully broken out of a Falling Wedge Pattern, signaling the potential for a substantial upward move. The Falling Wedge is a bullish continuation pattern, often seen during downtrends, where the price consolidates within converging trendlines before breaking out. With the breakout now confirmed, the market is showing strong signs of a bullish reversal. The volume accompanying this breakout is good, indicating solid investor participation and confirming that there’s significant buying pressure behind this move. Traders are now anticipating potential gains of 120% to 140%+ as the price targets higher levels.
The breakout from the Falling Wedge Pattern marks a key turning point for IDUSDT, as it signals that the price is likely to accelerate after breaking through the upper trendline. The good volume further validates the strength of this move, as higher volume during a breakout is often a precursor to continued upward momentum. With the market clearly showing signs of bullish sentiment, the next major resistance levels will be critical in determining how far IDUSDT can go in the coming days or weeks. If the price continues to maintain its bullish trajectory, the expected gains of 120% to 140%+ could be reached quickly.
Investor interest in IDUSDT is increasing, as more traders recognize the potential of this pattern and the breakout that has already taken place. The Falling Wedge often leads to explosive moves once the price clears key resistance levels, and IDUSDT is well-positioned to make such a move. The combination of a well-formed technical setup, strong volume, and growing investor interest is making IDUSDT an exciting project to watch. As the price gains momentum, it could quickly rise, offering significant profits for those who have entered at the right time.
Traders should continue to monitor support and resistance levels closely, as these will be key indicators of whether the breakout can hold and sustain its bullish momentum. The overall crypto market sentiment will also play a role in IDUSDT’s movements, but given the strong technical setup and volume, this pair looks poised for impressive gains. As always, careful timing and strategic entry points will be crucial to maximizing profits from this promising setup.

IDUSDT 3DID ~ 3D Analysis
#ID In the 3D time frame, this is a very good support for now, Buy from here if you still have a Conviction on this coin with a minimum target of 20%+

#ID 1D GREAT FOR LONG TIMEPotential upside in the next 2-3 months is possible, guess what, good luck

Can #ID Bulls Really Continue this Bullish Momentum? Key LevelsYello, Paradisers! Will #IDUSDT rally to new highs or face a sharp rejection? Let’s dive into the current setup of #SpaceID:
💎#ID recently broke out of a well-defined descending channel—a structure often signaling a shift in trend. Currently, the price is consolidating near the $0.423 support zone, a critical level to watch for the next move. For bulls to regain momentum, the price must decisively break above the $0.5773 resistance zone. This will confirm the breakout and open the door for a significant rally.
💎If #IDUSD successfully reclaims the $0.577 resistance level, the next key hurdle lies in the major resistance zone around $0.750. A breakout above this level would likely trigger a strong upward move, potentially targeting even higher levels. Watch for increased trading volume and strong bullish candles above $0.577 as confirmation of market strength.
💎On the downside, if the price fails to hold above the $0.423 support zone, a retest of the demand zone near $0.366 becomes highly probable. This area has historically attracted buyers, but if it fails to hold, the bullish setup will be invalidated.
💎A daily close below $0.366 could lead to further downside pressure, with potential targets near $0.3000 or lower. So, let's see how this #ID setup turns out, but the probability of it going up is higher.
Stay focused, patient, and disciplined, Paradisers🥂
MyCryptoParadise
iFeel the success🌴

ID is bullish#ID has some of the finest patterns the market made a good rise after hitting the past demand zone and also made a good correction which hit the fibo 0.62 level and also VWAP

ID looks bullish (2D)The larger pattern of the ID symbol appears to be a significant diametric, with ID now aiming to enter wave E.
Wave E is bullish.
If the price holds within the green zone, it can move toward the targets.
The targets are marked on the chart.
Closing a daily candle below the invalidation level will invalidate this analysis.
For risk management, please don't forget stop loss and capital management
When we reach the first target, save some profit and then change the stop to entry
Comment if you have any questions
Thank You
