#ILV/USDT Bullish Reversal in MAGICUSDT Accumulation Zone
#ILV
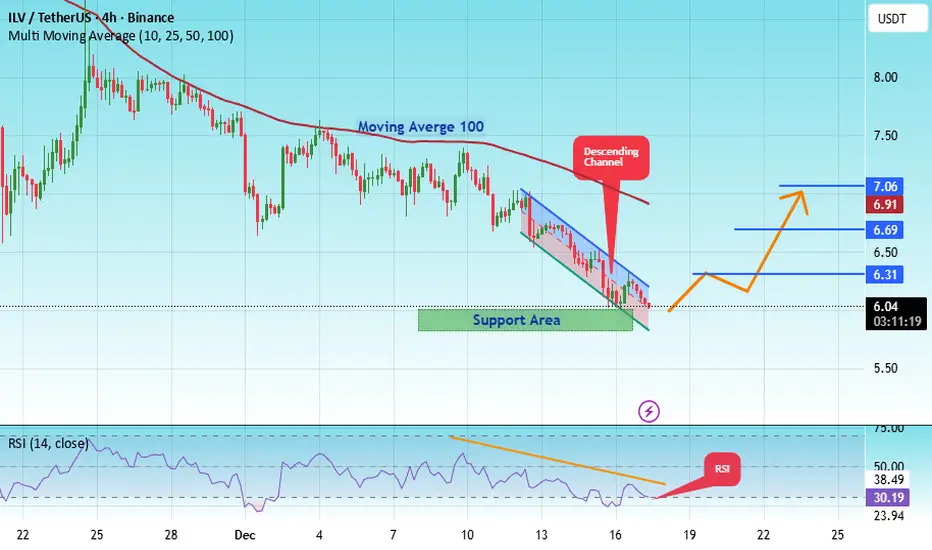
The price is moving in a descending channel on the 1-hour timeframe. It has reached the lower boundary and is heading towards breaking above it, with a retest of the upper boundary expected.
We have a downtrend on the RSI indicator, which has reached near the lower boundary, and an upward rebound is expected.
There is a key support zone in green at 5.84. The price has bounced from this zone multiple times and is expected to bounce again.
We have a trend towards consolidation above the 100-period moving average, as we are moving close to it, which supports the upward movement.
Entry price: 6.03
First target: 6.31
Second target: 6.69
Third target: 7.06
Don't forget a simple principle: money management.
Place your stop-loss below the support zone in green.
For any questions, please leave a comment.
Thank you.
Market insights
#ILV/USDT Bullish Reversal in MAGICUSDT Accumulation Zone #ILV
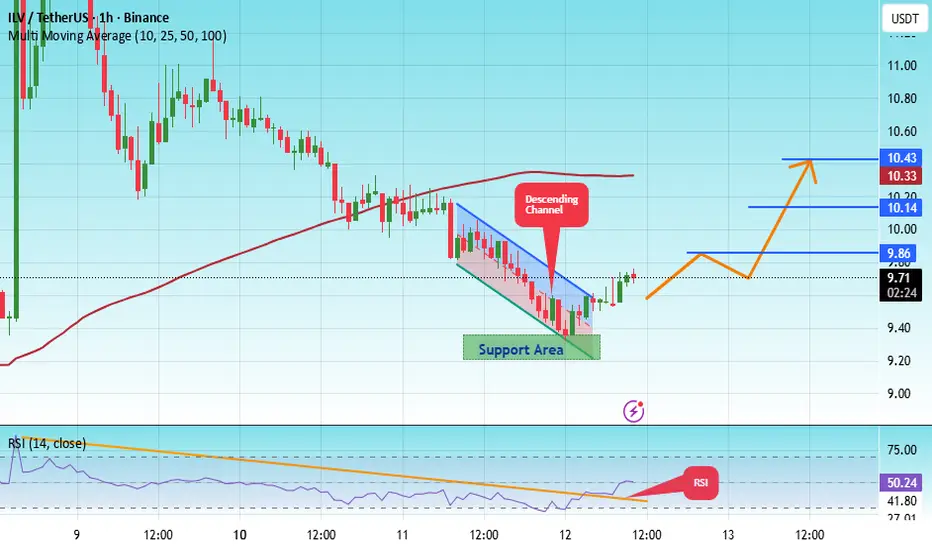
The price is moving within an ascending channel on the 1-hour timeframe and is adhering to it well. It is poised to break out strongly and retest the channel.
We have a downtrend line on the RSI indicator that is about to break and retest, which supports the upward move.
There is a key support zone in green at 9.31, representing a strong support point.
We have a trend to stabilize above the 100-period moving average.
Entry price: 9.86
First target: 9.86
Second target: 10.14
Third target: 10.43
Don't forget a simple money management rule:
Place your stop-loss order below the green support zone.
Once you reach the first target, save some money and then change your stop-loss order to an entry order.
For any questions, please leave a comment.
Thank you.
#ILV/USDT Forming Bullish Momentum !#ILV
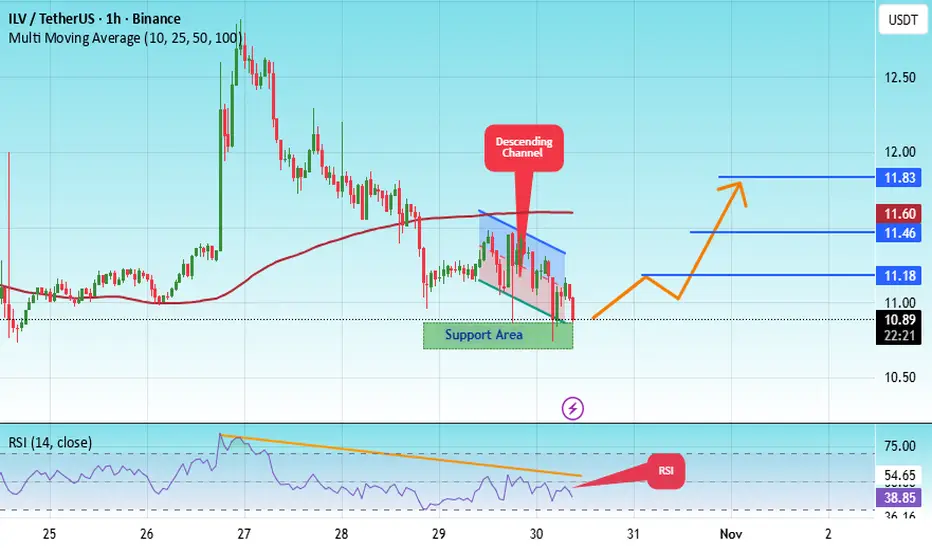
The price is moving within an ascending channel on the 1-hour timeframe and is adhering to it well. It is poised to break out strongly and retest the channel.
We have a downtrend line on the RSI indicator that is about to break and retest, which supports the upward move.
There is a key support zone in green at 10.80, representing a strong support point.
We have a trend of consolidation above the 100-period moving average.
Entry price: 10.95
First target: 11.18
Second target: 11.46
Third target: 11.83
Don't forget a simple money management rule:
Place your stop-loss order below the green support zone.
Once you reach the first target, save some money and then change your stop-loss order to an entry order.
For any questions, please leave a comment.
Thank you.
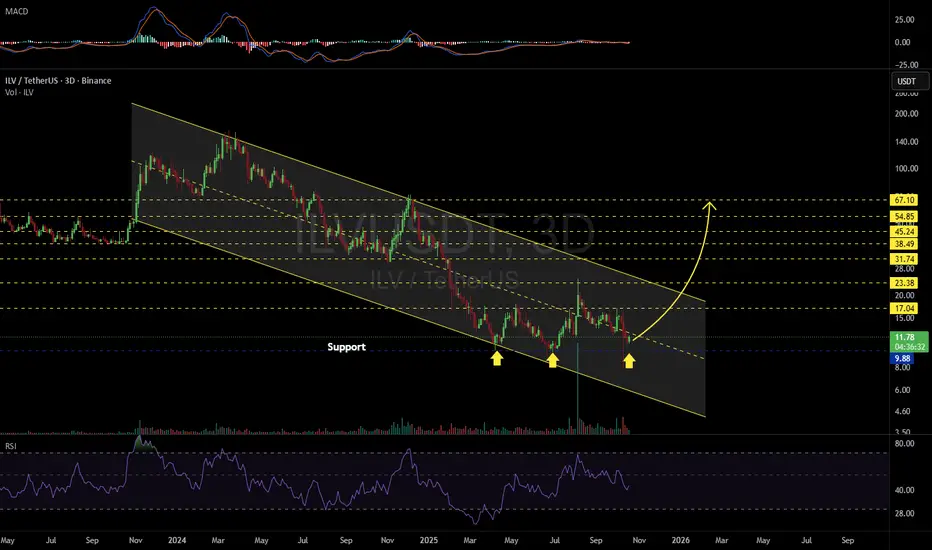
ILVUSDT 3D#ILV is moving inside a descending channel on the 3-day timeframe chart. In case of a successful bounce from the support and a breakout above the midline of the channel, we can expect the following targets:
🎯 $17.04
🎯 $23.38
🎯 $31.74
🎯 $38.49
🎯 $45.24
🎯 $54.85
🎯 $67.10
⚠️ Always remember to use a tight stop-loss and maintain proper risk management.
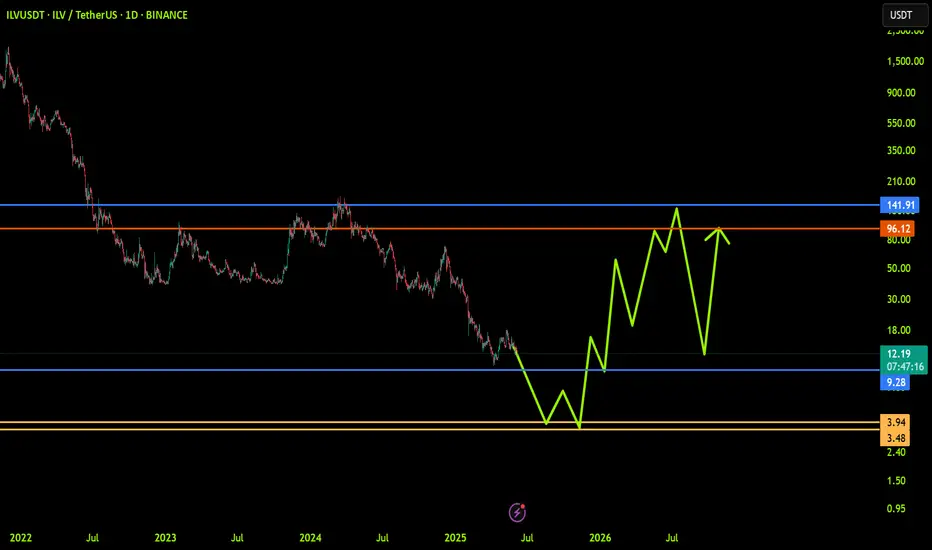
ILVUSDT: Trend in daily timeframeThe color levels are very accurate levels of support and resistance in different time frames, and we have to wait for their reaction in these areas.
So, Please pay special attention to the very accurate trend, colored levels, and you must know that SETUP is very sensitive.
Be careful
BEST
MT
ILVUSDT Forming Bullish MomentumILVUSDT has recently shown strong bullish momentum after bouncing from a major support zone. The price action indicates that buyers are stepping in aggressively, supported by good trading volume. This confirms renewed investor interest in the project, with expectations of a major rally in the coming days. Based on current market structure, ILVUSDT could deliver potential gains of 90% to 100%+ if bullish momentum sustains.
The chart suggests that ILV has established a solid foundation around its demand zone, which has held multiple times in the past. This accumulation phase has built strong buying pressure, leading to the breakout we are witnessing now. As long as price holds above this support, the path towards higher resistance levels looks promising, making it a potential high-upside trade.
Investor confidence in ILVUSDT is growing as liquidity and participation continue to rise. If market sentiment remains positive, the pair could see an explosive upward move, giving traders an attractive opportunity to capitalize on the trend. A clean break and continuation above recent highs would further confirm the bullish outlook.
✅ Show your support by hitting the like button and
✅ Leaving a comment below! (What is You opinion about this Coin)
Your feedback and engagement keep me inspired to share more insightful market analysis with you!
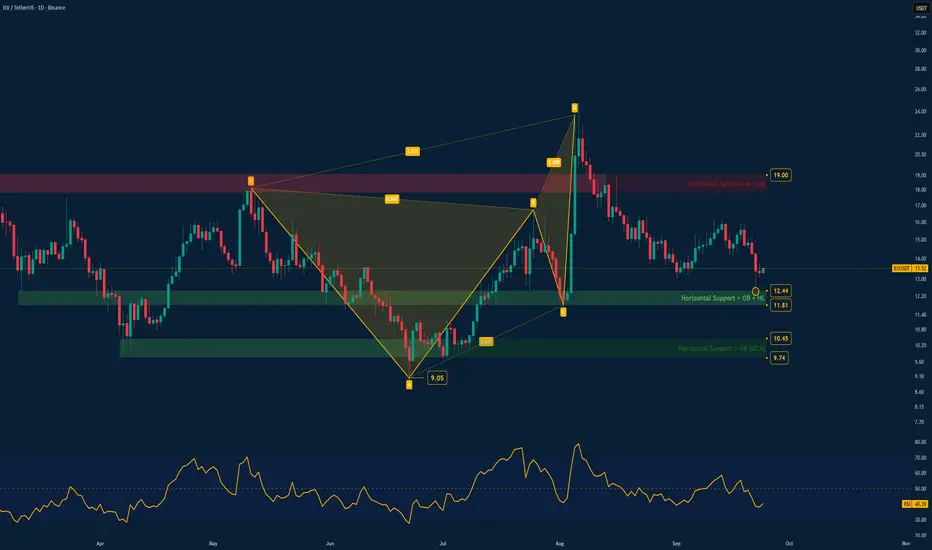
ILV/USDTBINANCE:ILVUSDT has touched the horizontal support zone corresponding to the C point of the bearish deep crab pattern.
This is strong support for ILV, and I now expect the price to turn upward.
I’ll update again if needed.
#ILV/USDT Forming Bullish Momentum !#ILV
The price is moving within an ascending channel on the 1-hour frame, adhering well to it, and is on its way to breaking strongly upwards and retesting it.
We have support from the lower boundary of the ascending channel, at 15.00.
We have a downtrend on the RSI indicator that is about to break and retest, supporting the upside.
There is a major support area in green at 14.80, which represents a strong basis for the upside.
Don't forget a simple thing: ease and capital.
When you reach the first target, save some money and then change your stop-loss order to an entry order.
For inquiries, please leave a comment.
We have a trend to hold above the 100 Moving Average.
Entry price: 15.46
First target: 16.10
Second target: 16.80
Third target: 17.70
Don't forget a simple thing: ease and capital.
When you reach the first target, save some money and then change your stop-loss order to an entry order.
For inquiries, please leave a comment.
Thank you.

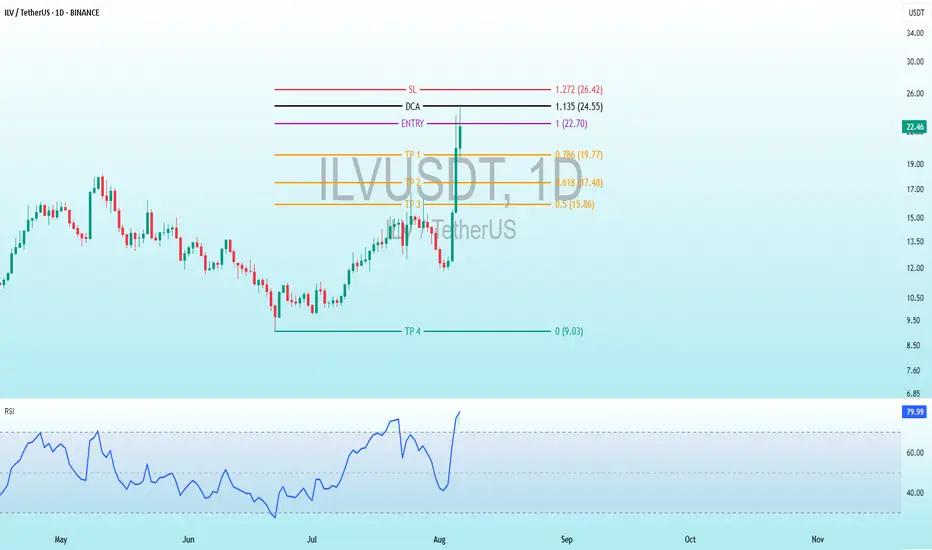
ILV Bearish DivergenceBINANCE:ILVUSDT
Trade Setup:
Target 1: 19.77(0.786 Fibonnaci Golden Zone).
Target 2: 17.48 (0.618 Fibonnaci Golden Zone).
Target 3: 15.86 (0.5 Fibonnaci Golden Zone).
Target 4: 9.03 (0 Fibonnaci).
DCA : 24.55 (1.135 Fibonacci)
Stop Loss: 26.42 (1.272 Fibonacci).
RSI Analysis: The RSI is showing a bearish divergence, suggesting potential bearish momentum. The current RSI is around 80.00, approaching oversold territory, so caution is advised.
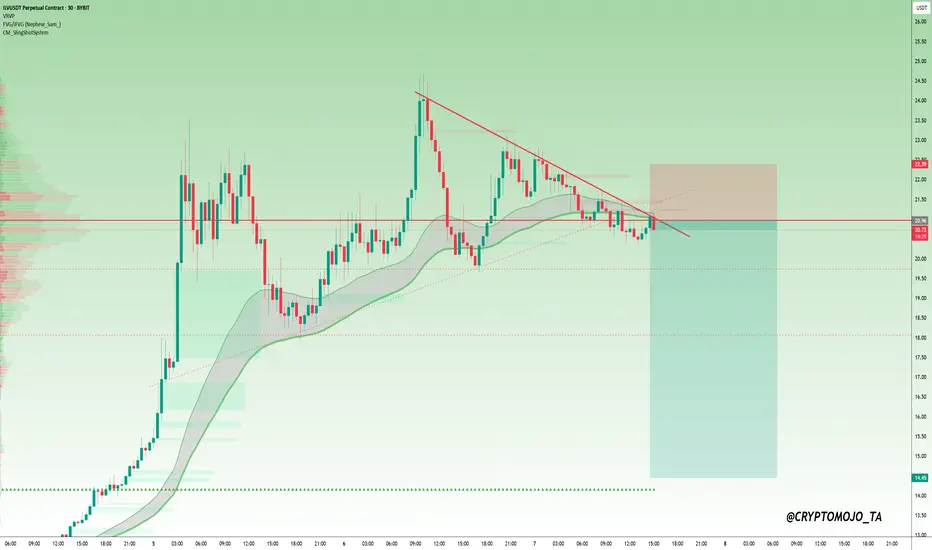
$ILV USDT Short Setup!SEED_DONKEYDAN_MARKET_CAP:ILV USDT Short Setup
Price is getting rejected from the trendline and facing resistance at the same level. A breakdown here could trigger a deeper move.
Entry Zone: Around $20.80 – $21.00
Stop Loss: Above $22.40
Targets:
Target 1: $19.50
Target 2: $18.20
Target 3: $16.70
Target 4: $14.50
DYOR, NFA
#ALTSEASON
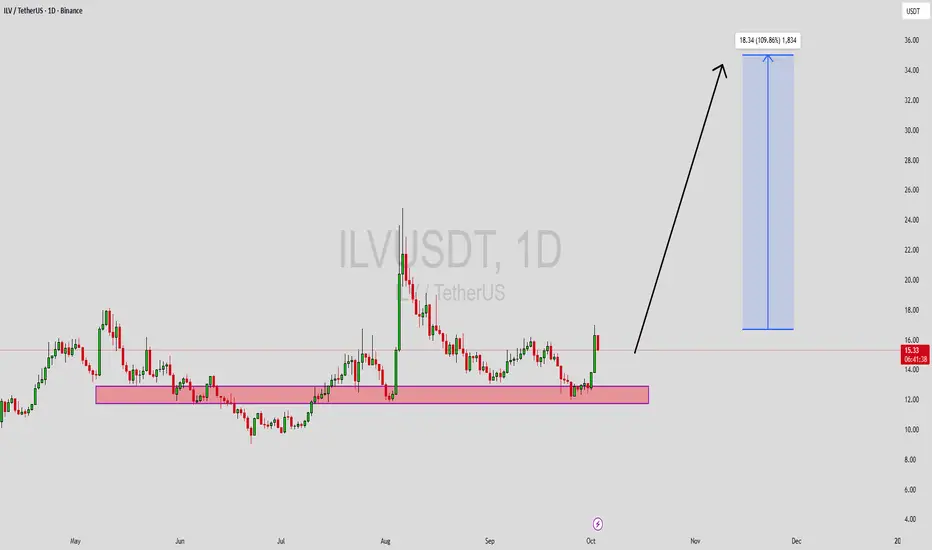
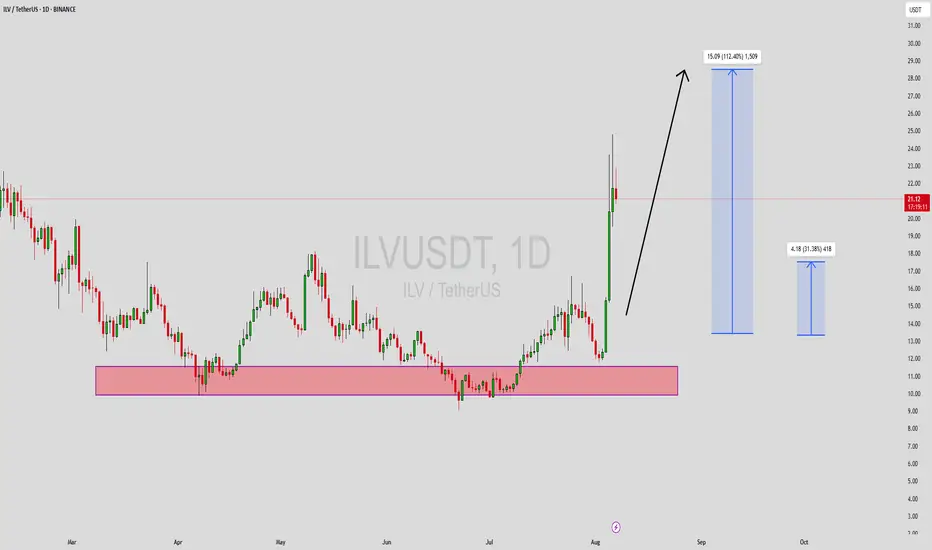
ILVUSDT Forming Bullish MomentumILVUSDT (Illuvium/USDT) has shown an impressive breakout from its recent accumulation zone, with a strong bullish momentum that’s caught the attention of smart money and retail investors alike. The price action reflects a clean recovery from a solid demand zone, where accumulation occurred for several weeks. Now that the resistance has been broken with strength, ILV is poised for further upside, and the current projection suggests a possible 100%+ gain, targeting the \$29-\$30 range.
What makes this setup more compelling is the sharp vertical movement, supported by a spike in volume, indicating institutional interest. ILV has historically delivered aggressive rallies following long consolidations, and the current breakout structure mirrors those previous bullish cycles. The daily chart clearly shows the strength of the impulse wave, and with no immediate resistance in sight until much higher levels, the risk-reward remains in favor of the bulls.
Fundamentally, Illuvium remains one of the more promising GameFi projects, combining AAA gaming quality with DeFi integration. As Web3 gaming continues to attract attention, ILV stands out as a top contender in this space. With the renewed interest in altcoins, ILV could outperform many of its peers, especially if bullish sentiment across the market persists.
This is a textbook momentum breakout setup backed by volume, fundamentals, and strong community backing. Traders looking for high-reward setups should keep ILVUSDT on their radar for potential continuation.
✅ Show your support by hitting the like button and
✅ Leaving a comment below! (What is You opinion about this Coin)
Your feedback and engagement keep me inspired to share more insightful market analysis with you!

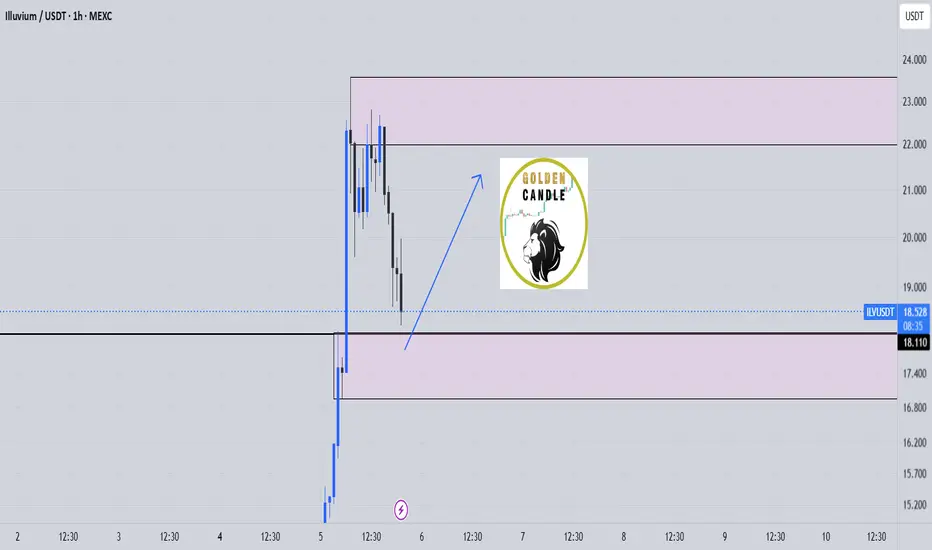
ilv buy midterm"🌟 Welcome to Golden Candle! 🌟
We're a team of 📈 passionate traders 📉 who love sharing our 🔍 technical analysis insights 🔎 with the TradingView community. 🌎
Our goal is to provide 💡 valuable perspectives 💡 on market trends and patterns, but 🚫 please note that our analyses are not intended as buy or sell recommendations. 🚫
Instead, they reflect our own 💭 personal attitudes and thoughts. 💭
Follow along and 📚 learn 📚 from our analyses! 📊💡"
Illuvium ILV price analysis, Finally risingAfter a brutal 3.5-year bear cycle (from $2000 to $10), #Illuvium has shown its first real strength — a 50% move up, backed by notable volume
Rising OKX:ILVUSDT is happening right near long-term trendline resistance, and the next resistance is in the $32–33 zone.
#GameFi sector has been forgotten for too long. If sentiment shifts — #GALA and other GameFi tokens may follow.
📍 Entry: After consolidation above $19.94
🎯 Target: $32.39 short-term, $48 medium-term
❌ Invalidation: Close below $14.76
________________
📚 Follow us ❤️ for daily crypto insights & updates!
🚀 Don’t miss out on important market moves

LONG IDEA GAMING TOKEN ILV/USDTIlluvium is an open-world fantasy battle game built on the Ethereum blockchain

ILVUSDTBULLISH Trend will start
BuyStop and SL are mention on the chart
Note: Please move your SL to EP after TP1

$ILV is up to breaking the resistanceGood opportunity of trade for the next few days, where I can see #ILV breaking up the resistance soon.

buys toward daily liquidity highdaily pullback to averages, if price holds, it's a good sign that buyers will ramp up the price to sweep the high.
wait until buyers has proven to accumulate and break the supply zone.
after proven, entry on pullback

#ILV/USDT#ILV
The price is moving within a descending channel on the 1-hour frame, adhering well to it, and is heading for a strong breakout and retest.
We are seeing a rebound from the lower boundary of the descending channel, which is support at 16.40.
We have a downtrend on the RSI indicator that is about to be broken and retested, which supports the upward trend.
We are looking for stability above the 100 moving average.
Entry price: 16.62
First target: 17.11
Second target: 17.67
Third target: 18

#ILV/USDT#ILV
The price is moving within a descending channel on the 1-hour frame, adhering well to it, and is heading for a strong breakout and retest.
We are experiencing a rebound from the lower boundary of the descending channel, which is support at 13.56.
We are experiencing a downtrend on the RSI indicator, which is about to break and retest, supporting the upward trend.
We are looking for stability above the 100 Moving Average.
Entry price: 13.80
First target: 14.00
Second target: 14.25
Third target: 14.58

ascending triangle patternSEED_DONKEYDAN_MARKET_CAP:ILV is forming an ascending triangle pattern and is approaching a key red resistance zone. If the price breaks out above this level with confirmation, the target will be the green line level.
📈 Technical Overview:
Pattern: Ascending Triangle
Resistance Zone: Red area currently being tested.
🎯 Breakout Target: Green line level upon confirmation.

If it doesn't bounce here, I don't know whereILV grazing the 1.618 FIB, this Fibbonacci set-up would explain why it went so low.
