IOSTUSDT UPDATE#IOST
UPDATE
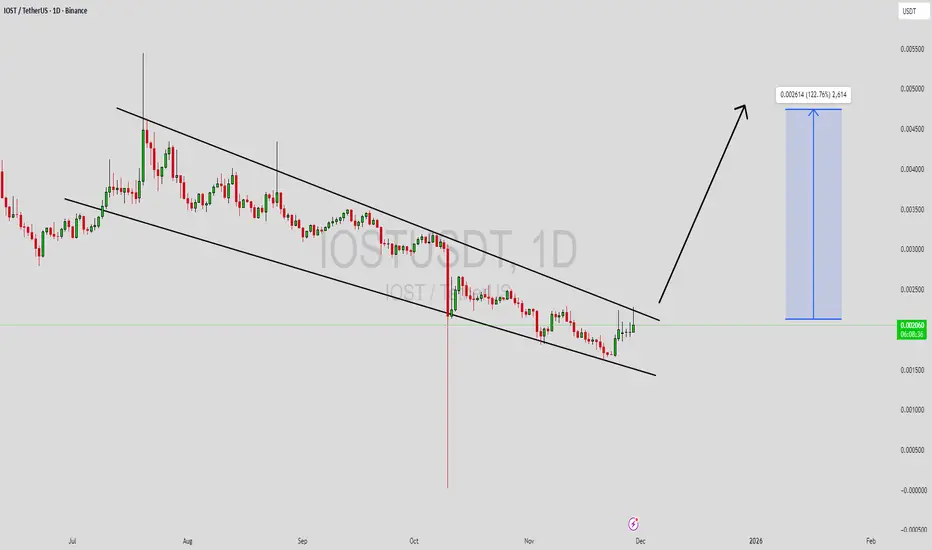
IOST Technical Setup
Pattern: Falling Wedge Pattern
Current Price: $0.00205
Target Price: $0.00368
Target % Gain: 80.65%
Technical Analysis: IOST is breaking out of a falling wedge pattern on the 1D chart, indicating strong bullish reversal potential. Price has pushed above the des

ORCAUSDT Forming Falling WedgeORCAUSDT is forming a clear falling wedge pattern, a classic bullish reversal signal that often indicates an upcoming breakout. The price has been consolidating within a narrowing range, suggesting that selling pressure is weakening while buyers are beginning to regain control. With consistent volum
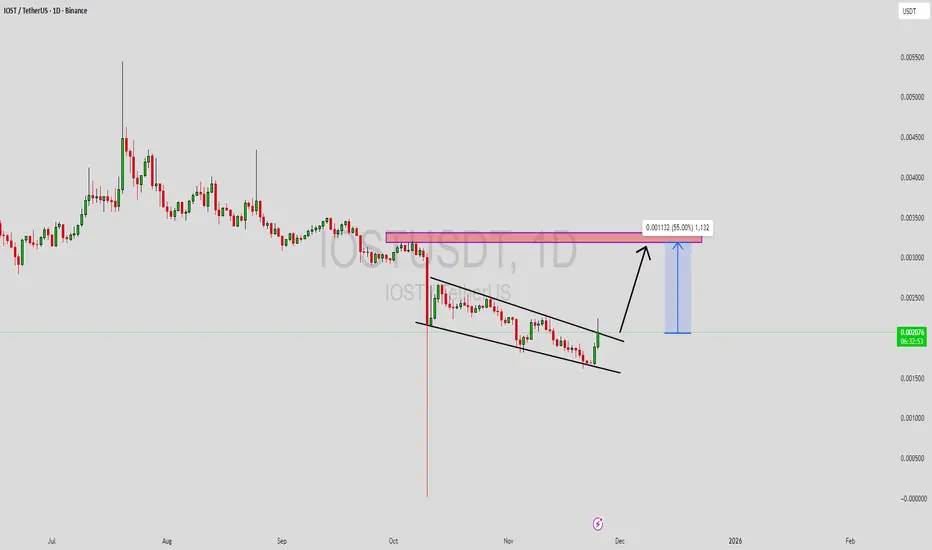
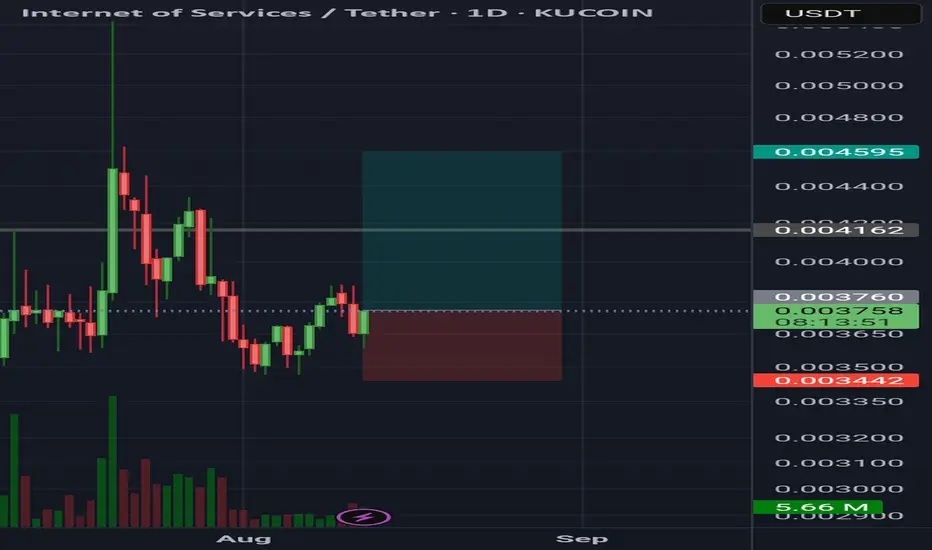
IOSTUSDT Forming Falling WedgeIOSTUSDT is forming a clear falling wedge pattern, a classic bullish reversal signal that often indicates an upcoming breakout. The price has been consolidating within a narrowing range, suggesting that selling pressure is weakening while buyers are beginning to regain control. With consistent volum

IOSTUSDT 1D#IOST is on the verge of breaking above the descending resistance and the SMA50 on the daily chart. RSI and MACD indicate the possibility of further bullish momentum. Keep an eye on it. If a breakout confirms, the potential upside targets are:
🎯 $0.002331
🎯 $0.002555
🎯 $0.002778
🎯 $0.003095
🎯 $0.00

IOSTUSDT Forming Falling WedgeIOSTUSDT is forming a clear falling wedge pattern, a classic bullish reversal signal that often indicates an upcoming breakout. The price has been consolidating within a narrowing range, suggesting that selling pressure is weakening while buyers are beginning to regain control. With consistent volum
IOST From 10 Jul to 08 Oct 2025 $3MM BuybackIOST has initiated a $3M USD buyback program as part of their ongoing commitment to ecosystem strength and growth.
Thats pure Bullish signal

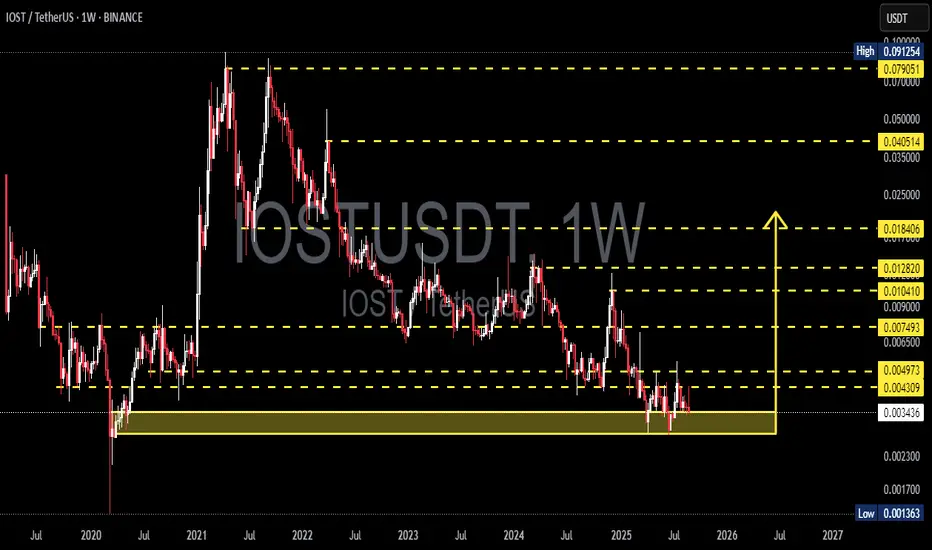
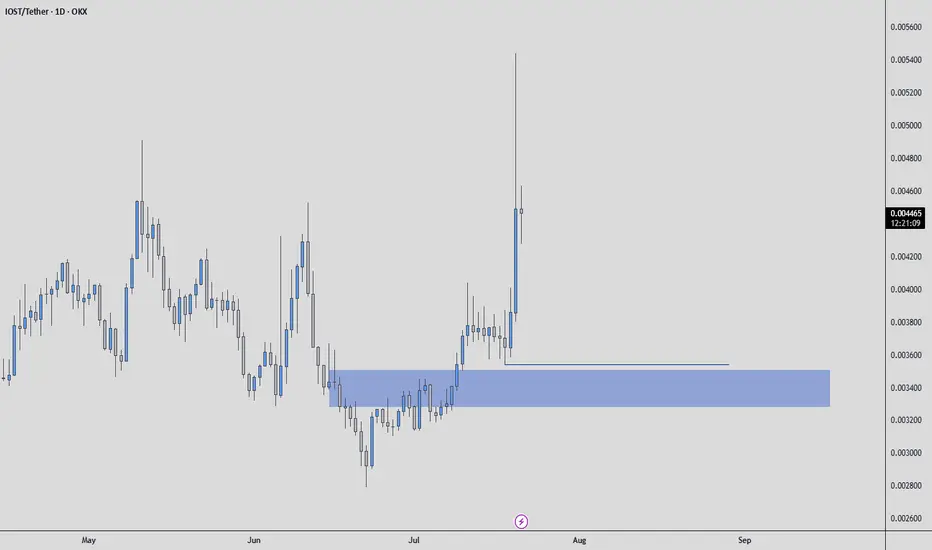
IOSTUSDT — At a Major Crossroad: Accumulation or Breakdown?🔎 Overview
IOST is currently trading inside a multi-year demand zone (0.0024–0.0037) which has repeatedly acted as a strong support since 2019. Each touch of this area has been met with buying interest, leaving long rejection wicks and suggesting hidden accumulation.
However, the broader market st
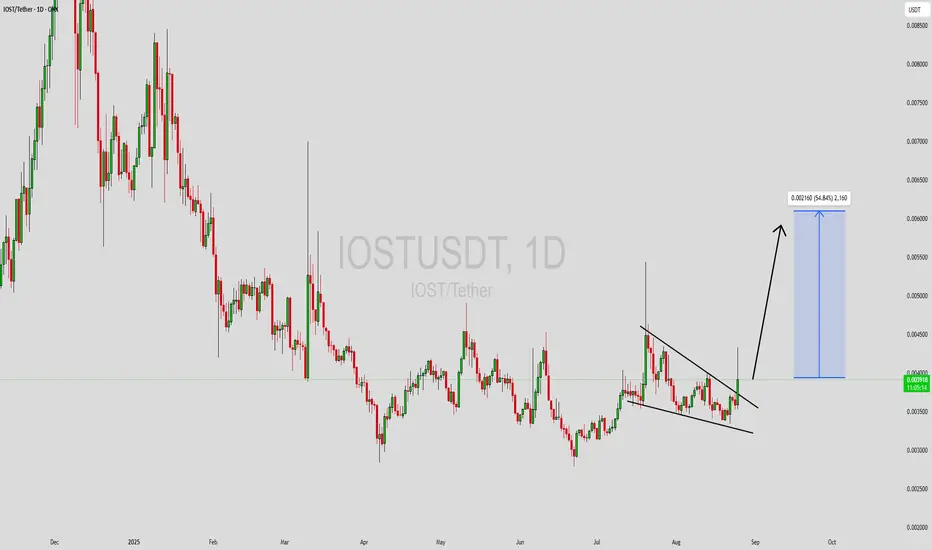
IOSTUSDT Forming Descending TriangleIOSTUSDT is currently trading within a descending triangle pattern, a setup that often signals a potential breakout move when accompanied by strong trading volume. The price action has been consolidating near a crucial support zone, while sellers are gradually losing momentum, creating an opportunit
Internet of services (IoST)Iost usdt daily analysis
Time frame daily
Risk rewards ratio >2.6 👈👌
Target = 0.0046$
IOSTUSDT - Mid Term AnalysisThe coin is good, but everything is bad unless you buy it at the right price.
I like IOST, but I won’t touch it unless it comes to a price that makes sense for me. If it drops to my levels, I will look for:
✅ Footprint absorption
✅ CDV support
✅ Structure reclaim for confirmation
If these align,
See all ideas
Summarizing what the indicators are suggesting.
Oscillators
Neutral
SellBuy
Strong sellStrong buy
Strong sellSellNeutralBuyStrong buy
Oscillators
Neutral
SellBuy
Strong sellStrong buy
Strong sellSellNeutralBuyStrong buy
Summary
Neutral
SellBuy
Strong sellStrong buy
Strong sellSellNeutralBuyStrong buy
Summary
Neutral
SellBuy
Strong sellStrong buy
Strong sellSellNeutralBuyStrong buy
Summary
Neutral
SellBuy
Strong sellStrong buy
Strong sellSellNeutralBuyStrong buy
Moving Averages
Neutral
SellBuy
Strong sellStrong buy
Strong sellSellNeutralBuyStrong buy
Moving Averages
Neutral
SellBuy
Strong sellStrong buy
Strong sellSellNeutralBuyStrong buy
Displays a symbol's price movements over previous years to identify recurring trends.