IOTXUSDT Sell/Short Signal (15M)Considering that the sell orders of the 4-hour order block have been absorbed, we can expect an internal pullback on lower timeframes.
The entry zone and targets are marked on the chart.
After the first target is reached, secure partial profits and then move the stop loss to breakeven
Do not enter the position without capital management and stop setting
Comment if you have any questions
thank you
Market insights

IOSTUSDT UPDATE#IOST
UPDATE
IOST Technical Setup
Pattern: Falling Wedge Pattern
Current Price: $0.00205
Target Price: $0.00368
Target % Gain: 80.65%
Technical Analysis: IOST is breaking out of a falling wedge pattern on the 1D chart, indicating strong bullish reversal potential. Price has pushed above the descending resistance trendline after prolonged compression, confirming the breakout structure. The measured move from the wedge projects toward the highlighted upside target zone, aligning with previous resistance levels. Holding above the breakout region keeps the bullish scenario intact and supports continuation higher.
Time Frame: 1D
Risk Management Tip: Always use proper risk management.

ORCAUSDT Forming Falling WedgeORCAUSDT is forming a clear falling wedge pattern, a classic bullish reversal signal that often indicates an upcoming breakout. The price has been consolidating within a narrowing range, suggesting that selling pressure is weakening while buyers are beginning to regain control. With consistent volume confirming accumulation at lower levels, the setup hints at a potential bullish breakout soon. The projected move could lead to an impressive gain of around 90% to 100% once the price breaks above the wedge resistance.
This falling wedge pattern is typically seen at the end of downtrends or corrective phases, and it represents a potential shift in market sentiment from bearish to bullish. Traders closely watching ORCAUSDT are noting the strengthening momentum as it nears a breakout zone. The good trading volume adds confidence to this pattern, showing that market participants are positioning early in anticipation of a reversal.
Investors’ growing interest in ORCAUSDT reflects rising confidence in the project’s long-term fundamentals and current technical strength. If the breakout confirms with sustained volume, this could mark the start of a fresh bullish leg. Traders might find this a valuable setup for medium-term gains, especially as the wedge pattern completes and buying momentum accelerates.
✅ Show your support by hitting the like button and
✅ Leaving a comment below! (What is your opinion about this Coin?)
Your feedback and engagement keep me inspired to share more insightful market analysis with you!
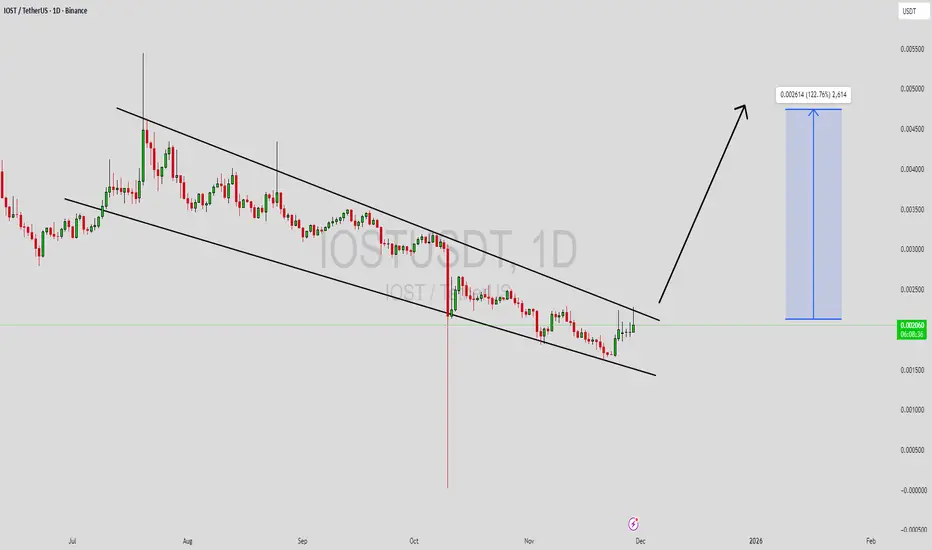
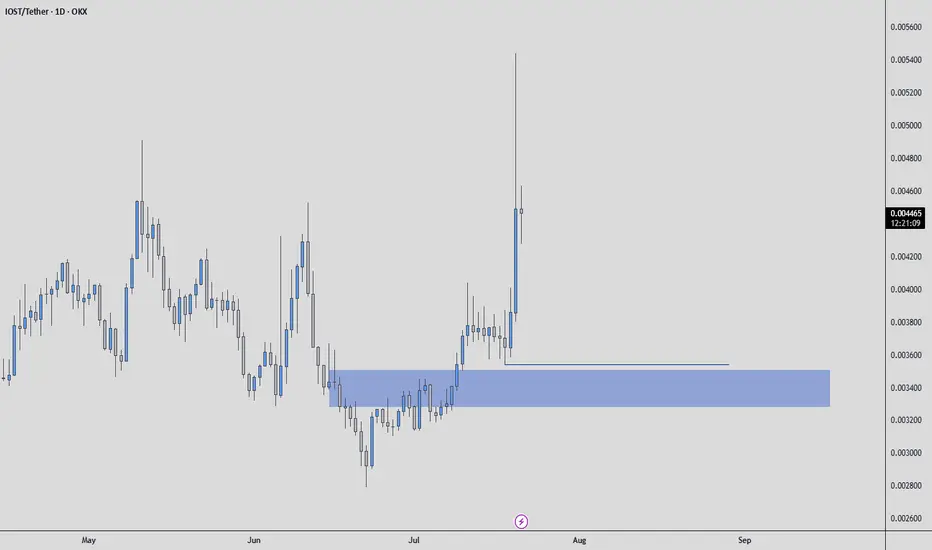
IOSTUSDT Forming Falling WedgeIOSTUSDT is forming a clear falling wedge pattern, a classic bullish reversal signal that often indicates an upcoming breakout. The price has been consolidating within a narrowing range, suggesting that selling pressure is weakening while buyers are beginning to regain control. With consistent volume confirming accumulation at lower levels, the setup hints at a potential bullish breakout soon. The projected move could lead to an impressive gain of around 90% to 100% once the price breaks above the wedge resistance.
This falling wedge pattern is typically seen at the end of downtrends or corrective phases, and it represents a potential shift in market sentiment from bearish to bullish. Traders closely watching IOSTUSDT are noting the strengthening momentum as it nears a breakout zone. The good trading volume adds confidence to this pattern, showing that market participants are positioning early in anticipation of a reversal.
Investors’ growing interest in IOSTUSDT reflects rising confidence in the project’s long-term fundamentals and current technical strength. If the breakout confirms with sustained volume, this could mark the start of a fresh bullish leg. Traders might find this a valuable setup for medium-term gains, especially as the wedge pattern completes and buying momentum accelerates.
✅ Show your support by hitting the like button and
✅ Leaving a comment below! (What is your opinion about this Coin?)
Your feedback and engagement keep me inspired to share more insightful market analysis with you!

IOSTUSDT 1D#IOST is on the verge of breaking above the descending resistance and the SMA50 on the daily chart. RSI and MACD indicate the possibility of further bullish momentum. Keep an eye on it. If a breakout confirms, the potential upside targets are:
🎯 $0.002331
🎯 $0.002555
🎯 $0.002778
🎯 $0.003095
🎯 $0.003500
⚠️ Always remember to use a tight stop-loss and maintain proper risk management.

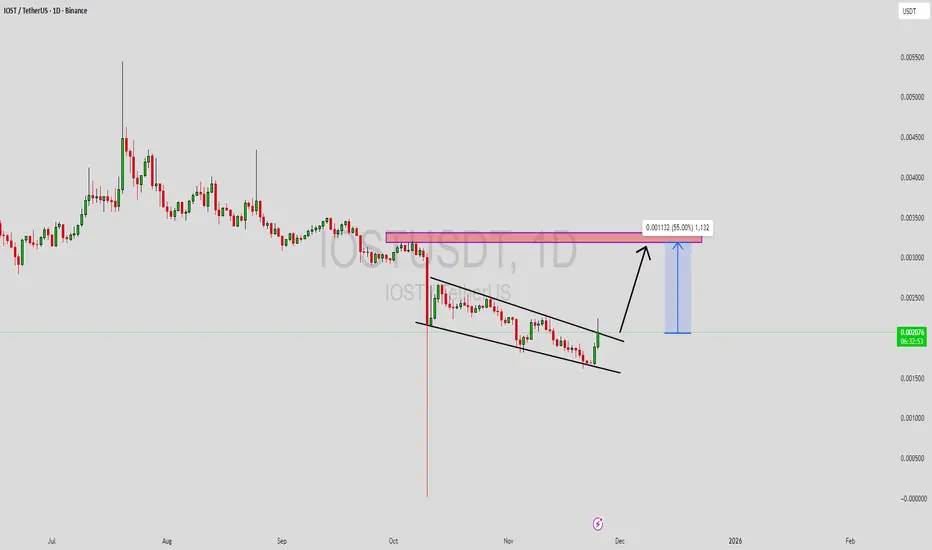
IOSTUSDT Forming Falling WedgeIOSTUSDT is forming a clear falling wedge pattern, a classic bullish reversal signal that often indicates an upcoming breakout. The price has been consolidating within a narrowing range, suggesting that selling pressure is weakening while buyers are beginning to regain control. With consistent volume confirming accumulation at lower levels, the setup hints at a potential bullish breakout soon. The projected move could lead to an impressive gain of around 40% to 50% once the price breaks above the wedge resistance.
This falling wedge pattern is typically seen at the end of downtrends or corrective phases, and it represents a potential shift in market sentiment from bearish to bullish. Traders closely watching IOSTUSDT are noting the strengthening momentum as it nears a breakout zone. The good trading volume adds confidence to this pattern, showing that market participants are positioning early in anticipation of a reversal.
Investors’ growing interest in IOSTUSDT reflects rising confidence in the project’s long-term fundamentals and current technical strength. If the breakout confirms with sustained volume, this could mark the start of a fresh bullish leg. Traders might find this a valuable setup for medium-term gains, especially as the wedge pattern completes and buying momentum accelerates.
✅ Show your support by hitting the like button and
✅ Leaving a comment below! (What is your opinion about this Coin?)
Your feedback and engagement keep me inspired to share more insightful market analysis with you!
IOST From 10 Jul to 08 Oct 2025 $3MM BuybackIOST has initiated a $3M USD buyback program as part of their ongoing commitment to ecosystem strength and growth.
Thats pure Bullish signal

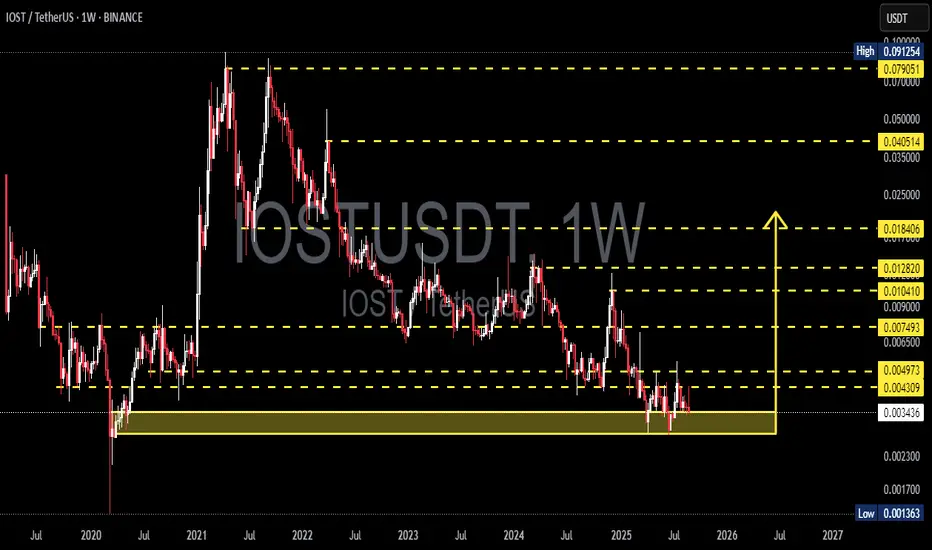
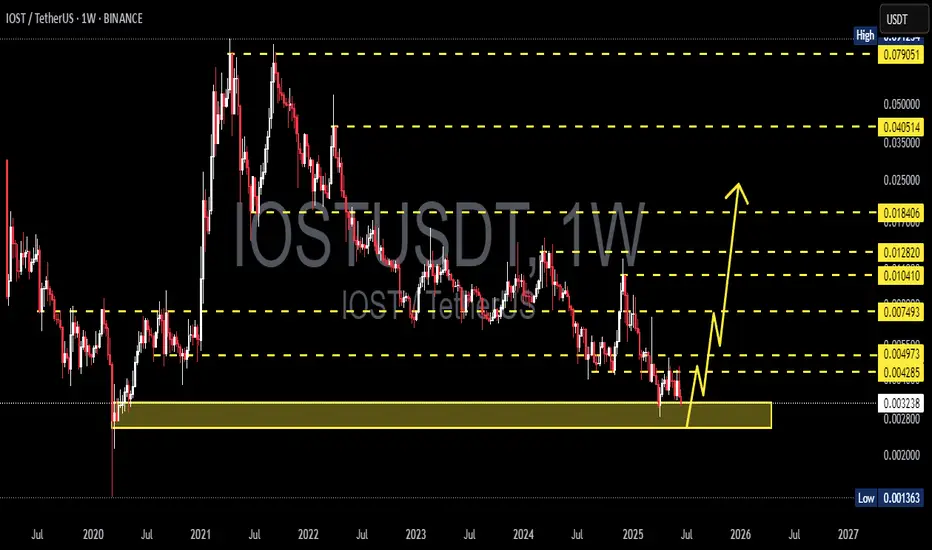
IOSTUSDT — At a Major Crossroad: Accumulation or Breakdown?🔎 Overview
IOST is currently trading inside a multi-year demand zone (0.0024–0.0037) which has repeatedly acted as a strong support since 2019. Each touch of this area has been met with buying interest, leaving long rejection wicks and suggesting hidden accumulation.
However, the broader market structure remains bearish, with a clear series of lower highs since 2021. This puts the market at a critical juncture:
➡️ Will this demand zone once again serve as a base for accumulation and trigger a major reversal?
➡️ Or will selling pressure finally push price below the floor, opening the path to historical lows at 0.00136?
---
📌 Key Technical Levels
Critical Demand Zone: 0.0024 – 0.0037
Nearest Resistance: 0.004309 → 0.004973
Mid-Term Targets: 0.007493 → 0.00900 – 0.01041
Trend Pivot: 0.01282 (a breakout here could shift the macro trend bullish)
Swing Bullish Targets: 0.018406 → 0.040514 → 0.079051
Major Invalidation: Weekly close below 0.0024 = risk of continuation down to 0.00136
---
🟢 Bullish Scenario
1. Early Confirmation: Weekly close above 0.004309 signals the first sign of buyers stepping in.
2. Minor Range Break: Breaking 0.004973 opens the way to 0.007493.
3. Momentum Expansion: Close above 0.007493 would target the supply zone at 0.009 – 0.01041.
4. Full Reversal: Sustained weekly close above 0.01282 could mark the end of the multi-year downtrend, unlocking upside potential toward 0.018406 and possibly higher (0.040–0.079).
---
🔴 Bearish Scenario
1. Failure to break 0.004309 – 0.004973 and another rejection may pull price back into the demand zone (0.0024–0.0037).
2. A weekly close below 0.0024 would confirm a breakdown from demand.
3. Next downside target lies at 0.00136 (historical low), a possible capitulation area before any larger rebound.
---
📐 Pattern & Market Behavior
Range-Bound Accumulation: Current structure is trapped in a narrow 0.0030 – 0.0049 range. Breakout in either direction will define the next major move.
Potential Wyckoff Spring: The repeated wicks below demand suggest liquidation + buyer absorption, a common pattern before strong markups.
But caution: Without a breakout confirmation above resistance, this may still turn into a bull trap.
---
🎯 Trading Idea (Not Financial Advice)
Aggressive Play: Enter within demand 0.0024–0.0037, SL below 0.0024, take partial profits at 0.00431 & 0.00497.
Conservative Play: Wait for a confirmed breakout above 0.00497 and enter on a retest, targeting 0.00749 – 0.01041.
Risk Management: Keep positions small; volatility on small-cap alts can be extremely high.
---
📝 Conclusion
IOST stands at a major decision point. As long as it holds above the multi-year demand, the case for accumulation and reversal remains alive. But if demand fails, the market could revisit 0.00136. Staying disciplined at the key levels is crucial to avoid being caught in false moves.
#IOST #IOSTUSDT #Crypto #Altcoin #PriceAction #TechnicalAnalysis #SupportResistance #DemandZone #Breakout #SwingTrade #RiskManagement #DYOR
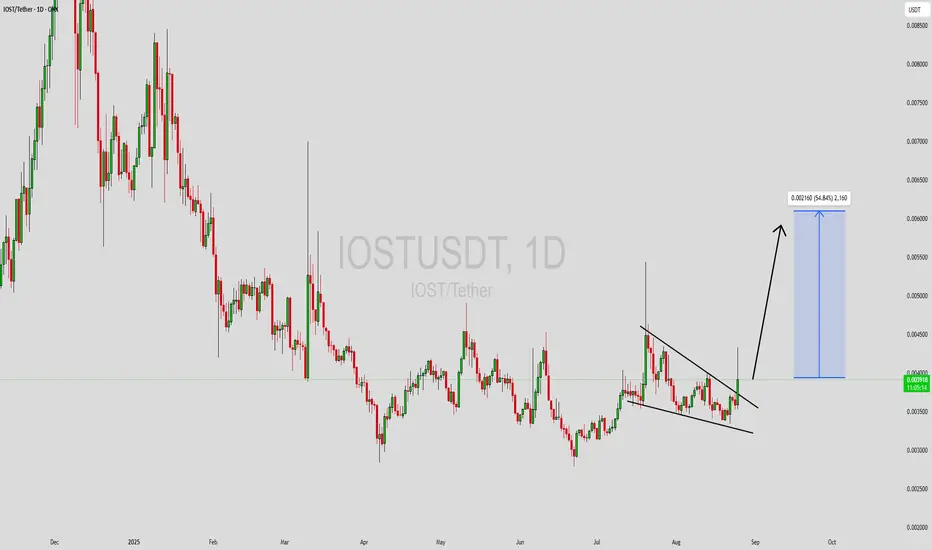
IOSTUSDT Forming Descending TriangleIOSTUSDT is currently trading within a descending triangle pattern, a setup that often signals a potential breakout move when accompanied by strong trading volume. The price action has been consolidating near a crucial support zone, while sellers are gradually losing momentum, creating an opportunity for buyers to step in. With increasing volume and renewed interest, this setup is catching the eye of many traders who are watching for a decisive breakout confirmation.
The current technical structure indicates that if IOSTUSDT manages to break out of the descending triangle with sustained volume, it could trigger a strong upward move. The expected target suggests a potential 40% to 50% gain, aligning with the measured move projection of this pattern. Such breakouts typically attract new momentum traders, adding to the buying pressure and fueling the next leg higher.
Investor sentiment around IOST has been gradually improving, as the project continues to regain attention in the altcoin market. With market conditions favoring coins showing strong chart structures, IOSTUSDT is positioned well for a potential rally. A breakout confirmation could open the doors for further bullish momentum, making it a pair worth closely monitoring.
✅ Show your support by hitting the like button and
✅ Leaving a comment below! (What is You opinion about this Coin)
Your feedback and engagement keep me inspired to share more insightful market analysis with you!
Internet of services (IoST)Iost usdt daily analysis
Time frame daily
Risk rewards ratio >2.6 👈👌
Target = 0.0046$
IOSTUSDT - Mid Term AnalysisThe coin is good, but everything is bad unless you buy it at the right price.
I like IOST, but I won’t touch it unless it comes to a price that makes sense for me. If it drops to my levels, I will look for:
✅ Footprint absorption
✅ CDV support
✅ Structure reclaim for confirmation
If these align, I will consider a long with clear risk management. If not, I will wait.
No rush, no fear of missing out. The right price or no trade.
📌I keep my charts clean and simple because I believe clarity leads to better decisions.
📌My approach is built on years of experience and a solid track record. I don’t claim to know it all but I’m confident in my ability to spot high-probability setups.
📌If you would like to learn how to use the heatmap, cumulative volume delta and volume footprint techniques that I use below to determine very accurate demand regions, you can send me a private message. I help anyone who wants it completely free of charge.
🔑I have a long list of my proven technique below:
🎯 ZENUSDT.P: Patience & Profitability | %230 Reaction from the Sniper Entry
🐶 DOGEUSDT.P: Next Move
🎨 RENDERUSDT.P: Opportunity of the Month
💎 ETHUSDT.P: Where to Retrace
🟢 BNBUSDT.P: Potential Surge
📊 BTC Dominance: Reaction Zone
🌊 WAVESUSDT.P: Demand Zone Potential
🟣 UNIUSDT.P: Long-Term Trade
🔵 XRPUSDT.P: Entry Zones
🔗 LINKUSDT.P: Follow The River
📈 BTCUSDT.P: Two Key Demand Zones
🟩 POLUSDT: Bullish Momentum
🌟 PENDLEUSDT.P: Where Opportunity Meets Precision
🔥 BTCUSDT.P: Liquidation of Highly Leveraged Longs
🌊 SOLUSDT.P: SOL's Dip - Your Opportunity
🐸 1000PEPEUSDT.P: Prime Bounce Zone Unlocked
🚀 ETHUSDT.P: Set to Explode - Don't Miss This Game Changer
🤖 IQUSDT: Smart Plan
⚡️ PONDUSDT: A Trade Not Taken Is Better Than a Losing One
💼 STMXUSDT: 2 Buying Areas
🐢 TURBOUSDT: Buy Zones and Buyer Presence
🌍 ICPUSDT.P: Massive Upside Potential | Check the Trade Update For Seeing Results
🟠 IDEXUSDT: Spot Buy Area | %26 Profit if You Trade with MSB
📌 USUALUSDT: Buyers Are Active + %70 Profit in Total
🌟 FORTHUSDT: Sniper Entry +%26 Reaction
🐳 QKCUSDT: Sniper Entry +%57 Reaction
📊 BTC.D: Retest of Key Area Highly Likely
📊 XNOUSDT %80 Reaction with a Simple Blue Box!
📊 BELUSDT Amazing %120 Reaction!
📊 Simple Red Box, Extraordinary Results
📊 TIAUSDT | Still No Buyers—Maintaining a Bearish Outlook
📊 OGNUSDT | One of Today’s Highest Volume Gainers – +32.44%
📊 TRXUSDT - I Do My Thing Again
📊 FLOKIUSDT - +%100 From Blue Box!
📊 SFP/USDT - Perfect Entry %80 Profit!
📊 AAVEUSDT - WE DID IT AGAIN!
I stopped adding to the list because it's kinda tiring to add 5-10 charts in every move but you can check my profile and see that it goes on..
IOSTUSDT 1D#IOST has broken above the falling wedge pattern on the chart, and the price is moving above the daily SMA100 and the Ichimoku Cloud — a strong bullish sign. Consider buying some #IOST here and near the support level at $0.003633.
Our targets for this setup are:
🎯 $0.004573
🎯 $0.004992
🎯 $0.005590
🎯 $0.006352
⚠️ Always use a tight stop-loss and practice proper risk management.

IOSTUSDT 1W AnalysisIOST ~ 1W Analysis
#IOST Buy back gradually from here with a short term target of at least 20%+ from this support.
IOSTUSDT.P SHORTAs we can see iost is forming a kind of head and shoulder pattern we enter short once we see the bearish momentum at right shoulder box or near the area it might spike with longer wick so wait for the confirmation before entering the trade
DYOR

IOSTUSDTIOST
Float
its just an idea please don't take it serious.
if u cant have an entry , go with flow

IOST: New All-Time High May 2026? Interesting... Must Read!The lowest price ever for IOST happened March 2020. The second lowest happened April 2025. We shouldn't expect for IOSTUSDT to go as low as March 2020, we can easily say/predict/assume that the bottom is already in.
Let me show you something really interesting.
IOST entered a bull market after the March 2020 bottom, supported by easy money. The bull market from bottom to top lasted 399 days.
If we do a time-fractal and project 399 days into the future counting from the April 2025 low, this would give us a date of May 2026. Interesting. We are set to have easy money this year as well, same conditions as in 2021.
I've been saying late 2025 or early 2026 for the full bull market to unravel, but this is an interesting date. I don't know how long the bull market will last, I don't know how far up prices will go. There is only one thing I know 1,000% certain, safe, Crypto is going up.
IOST already hit bottom and is printing a higher low. This higher low marks the start of the next leg-up, the continuation of the bullish impulse. This impulse should last a long time, long-term growth.
It would be awesome if we have a bull market until mid-2026, but be prepared for anything to happen. The most important action right now is to accumulate, buy while prices are low and hold. Hold strong. You will be happy with the results.
It will take a while but it is something certain. The bull market can end later this year or in 2026, that's ok. As long as everything grows, we can produce financial success. Financial freedom. Financial independence. Financial abundance. It is all yours to take.
Namaste.

IOSTUSDT 1WIOST ~ 1W Analysis
#IOST Buy gradually from here with a short -term target of at least 20%+. This is a very good support for now.

IOST in the low risk areahi traders
IOST is inside the downsloping channel.
It doesn't look bad where it's now.
It's close to the bottom of the channel so it's in a low-risk area.
Many will sell when it's time to buy.
The macro down-trend is still intact and the top of the formation shown on the chart is the target for longs.
Good luck

IOSTUSDT 1WIOST ~ 1W Analysis
#IOST Buy back from here with a short -term target of at least 20%+ from here.

IOST price analysis⁉️ Who knows why the price of $IOST shot up so much yesterday?
🟢 The project is old - from 2018.
🟡 Capitalization is only $100 million.
🔴 It has been in the downtrend for more than 3 years and the price of OKX:IOSTUSDT has not really grown.
What do you think, is it worth buying? 150-160% of the price movement is even within the down-trend.

IOSTUSDT CHART ANALYSİS - EDUCATIONAL POSTConclusion
The NFT market is developing extremely fast, and the blockchain infrastructure has undergone significant changes over the past few years. However, today, there are still many questions about how the NFT market can function and in which areas non-fungible tokens can be used.
For example, one potential application of NFT is the blockchain recording of unique documents. Due to the reliability of the blockchain, diplomas, certificates, and various documents can be issued in NFT format, potentially helping to eliminate the risk of forgery.
NFTs are likely to have, and are already having, some impact on formats for creating and distributing content, and art objects. For now, however, it is primarily a trending investment tool for crypto enthusiasts around the world. The numerous possibilities of this technology will be revealed in the coming years.

IOST Breakout Coming? Avoid FOMO & Trade Smart!IOST/USDT 1W chart shows a strong bounce from the support zone, indicating potential bullish momentum. The price is currently approaching the falling resistance trendline, which has acted as a major barrier in previous attempts to rally. The Stoch RSI has formed a bullish crossover, signaling a possible trend reversal.
However, a breakout above the descending resistance trendline is required to confirm further upside. If you missed the entry at the bottom, avoid emotional FOMO—wait for a confirmed breakout to capture the next leg up.

IOSTUSDT 1WIOST ~ 1W Analysis
#IOST So far it still maintains this block of support. Buy from here with a minimum target of 20%++.
