0.02 return but first is the drop As soon as dump coin BTC is done it manipulation.. we go back up but . be wary that we could be delisted if you go any lower. Stop loss always

JASMY/USDT — Approaching Demand Zone: Reversal or Capitulation?JASMY is entering one of its most decisive phases since 2022.
After forming a long series of lower highs, the price is now approaching the historical demand zone that previously triggered one of JASMY’s strongest reversals — the 0.004–0.003 region.
This yellow block isn’t just another support level

#JASMY/USDT GOOD TIME TO BUY JASMY I MARK THE TARGETS#JASMY
The price is moving in a descending channel on the 1-hour timeframe. It has reached the lower boundary and is heading towards breaking above it, with a retest of the upper boundary expected.
We have a downtrend on the RSI indicator, which has reached near the lower boundary, and an upward r

JASMYUSDT 1D#JASMY is moving inside a descending triangle on the daily chart. In case of a breakout above the pattern, the potential targets are:
🎯 $0.01337
🎯 $0.01591
🎯 $0.01795
🎯 $0.02000
🎯 $0.02292
🎯 $0.02663
⚠️ Always remember to use a tight stop-loss and maintain proper risk management.

#JASMY/USDT#JASMY
The price is moving within a descending channel on the 1-hour frame, adhering well to it, and is heading towards a strong breakout and retest.
We are experiencing a rebound from the lower boundary of the descending channel. This support is at 0.01480.
We are experiencing a downtrend on the

#JASMY/USDT GOOD TIME TO BUY JASMY I MARK THE TARGETS#JASMY
The price is moving within a descending channel on the 1-hour frame and is expected to break and continue upward.
We have a trend to stabilize above the 100 moving average once again.
We have a downtrend on the RSI indicator that supports the upward break.
We have a support area at the lo

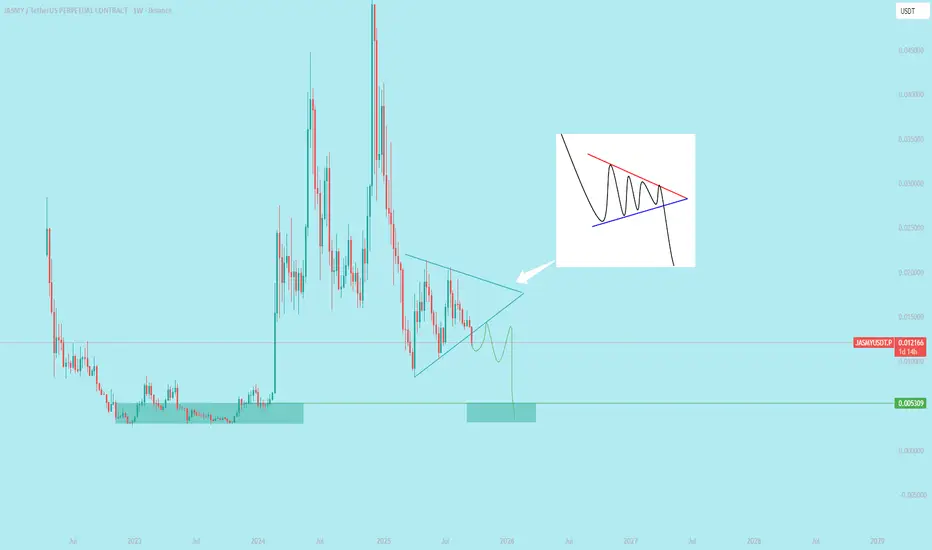
$JASMY Breakdown Bearish Symmetrical Triangle in 1W
`A bearish symmetrical triangle is a continuation pattern in technical analysis that forms during a downtrend. It signals a period of market consolidation where neither buyers nor sellers have a clear advantage, suggesting a potential continuation of the prevailing downward trend once the pattern i
JASMY - H-50 & J20Hello Friends!
I hope SEED_DONKEYDAN_MARKET_CAP:JASMY will touch the "0.058" level then it can make some corrections. After her correction, it has more chances to touch the "0.088" level. But if it create counter setup, then close it instant.
Do you have any questions, suggestions, or feedback?

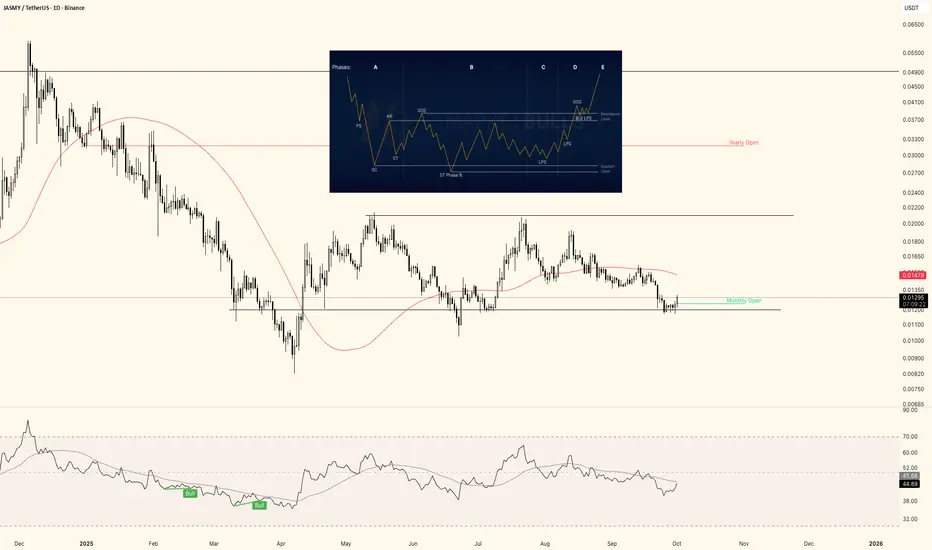
JASMY ending a wyckoff accumulation here?Question is whether we still need a wick lower to form a spring, or are we following the projected path like displayed in the image?
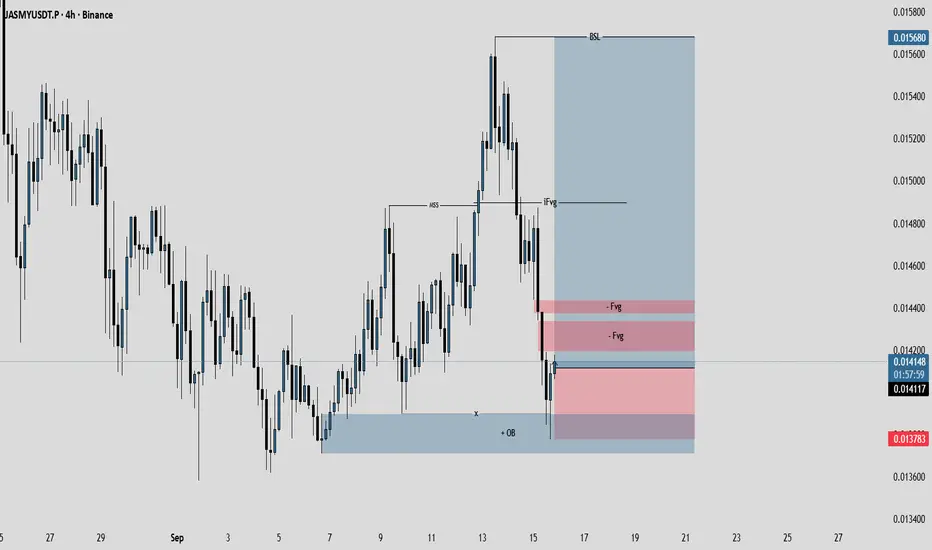
JASMY/USDT Perpetual (JASMYUSDT.P) 4H Timeframe AnalysisJASMYUSDT.P shows a short-term bearish correction within a broader neutral-to-bullish structure. The price has declined from a local high near $0.017 in late August to recent lows around $0.014, forming a descending channel with lower highs and lows. Volume appears moderate during the pullback, sugg
See all ideas
Summarizing what the indicators are suggesting.
Oscillators
Neutral
SellBuy
Strong sellStrong buy
Strong sellSellNeutralBuyStrong buy
Oscillators
Neutral
SellBuy
Strong sellStrong buy
Strong sellSellNeutralBuyStrong buy
Summary
Neutral
SellBuy
Strong sellStrong buy
Strong sellSellNeutralBuyStrong buy
Summary
Neutral
SellBuy
Strong sellStrong buy
Strong sellSellNeutralBuyStrong buy
Summary
Neutral
SellBuy
Strong sellStrong buy
Strong sellSellNeutralBuyStrong buy
Moving Averages
Neutral
SellBuy
Strong sellStrong buy
Strong sellSellNeutralBuyStrong buy
Moving Averages
Neutral
SellBuy
Strong sellStrong buy
Strong sellSellNeutralBuyStrong buy
Displays a symbol's price movements over previous years to identify recurring trends.