JOE Breakout Above Descending Trendline, Retest in ProgressJOE was trending under a strong descending trendline that capped price for an extended period. Price has now broken above this descending resistance, marking a potential shift in short-term structure.
After the breakout, JOE is currently retesting the broken trendline, which is acting as a key deci
Related pairs

JOE Analysis (4H)It seems that the JOE coin is forming a corrective diamond diatomic pattern and has now entered wave D.
If the price reaches the entry points we have identified, we will enter a long/buy position using DCA to target wave E of this pattern.
A daily candle closing below the invalidation level will i

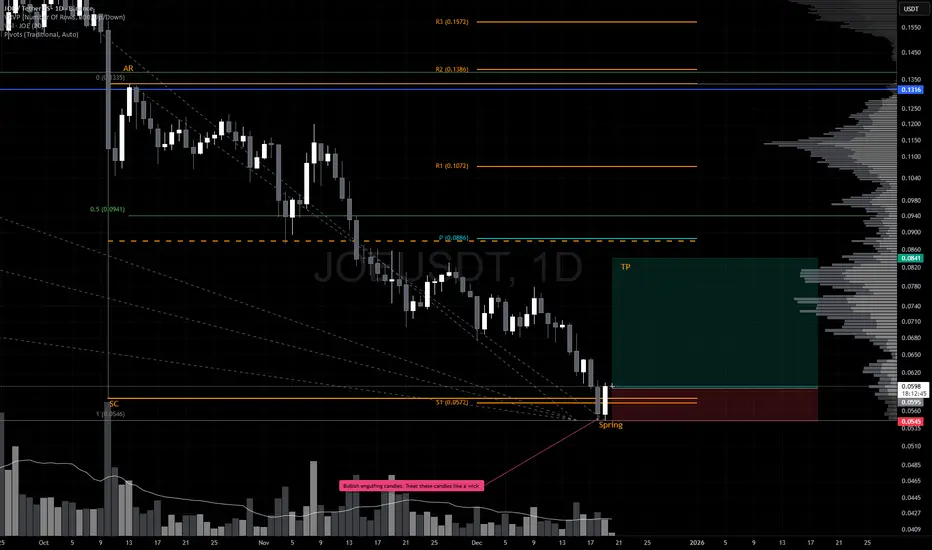
Relief Rally Inbound? JOE is shaping up for a potential reversal.
After the aggressive October 10 sell‑off, price responded with a clean Automatic Rally (AR) before rolling over into a controlled pullback. This latest dip appears to be sweeping the October 10 lows, and the December 19 bullish engulfing candle is the firs
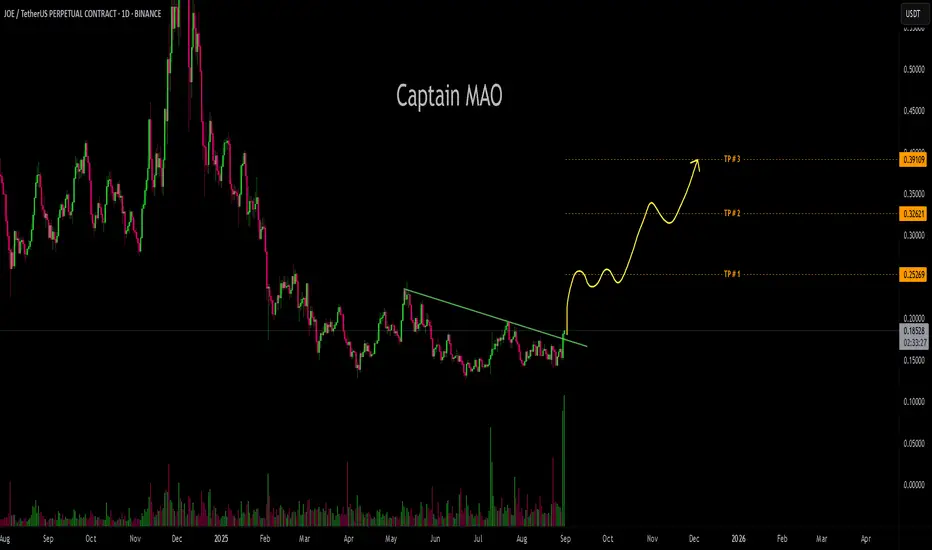
JOENYSE:JOE is shaping up for a breakout within the next 60 days. The structure is tightening, and momentum is building for a strong move. The potential upside from current levels sits around 850%, making this one of the more explosive setups on the radar.

JOE/USDT — On the Edge of a Major Reversal or Final Breakdown?The price of JOE is currently sitting on a critical historical support zone around $0.1517 – $0.1241 (highlighted in yellow).
This area has repeatedly acted as a strong demand zone since 2023, suggesting a potential accumulation base for mid-term investors.
However, each retest without a strong reb

JOE ANALYSIS📊#JOE Analysis
✅There is a formation of Descending triangle pattern on daily chart🧐
Pattern signals potential bullish movement incoming after a small retest 📉
👀Current Price: $0.1944
🚀 Target Price: $0.2370
⚡️What to do ?
👀Keep an eye on #JOE price action and volume. We can trade according

JOEUSDT Forming Bullish MomentumJOEUSDT is forming a strong technical structure that signals potential bullish momentum. The chart indicates price consolidation within a tightening range, often a precursor to a breakout move. With good trading volume supporting the current price action, the conditions are aligning for a significan

JOEUSDT TRADE ANALYSIS.OEUSDT – 15m Analysis
Bias: ✅ Bullish continuation possible
Key Structure Update:
Clear CHoCH marked – shift from bearish → bullish order flow.
Price already broke short-term structure and is pulling back.
POI Level:
OB + FVG confluence zone at 0.154–0.155 USDT.
SSL liquidity sits just above

JOE/USDT After a prolonged downtrend, JOE/USDT is showing strong signs that the bearish cycle is nearly over. On the daily timeframe, price has delivered a clean breakout above the trendline, followed by a successful retest of structure
JOE/USDT Approaching a Major Turning Point: Will Buyers Step In?🔎 Market Overview & Structure:
JOE/USDT is currently trading within a major historical demand zone between $0.1241 – $0.1548, a level that has proven to be a strong support since early 2023. Each time the price revisits this area, we’ve seen significant bounces — indicating that buyers continue to

See all ideas
Summarizing what the indicators are suggesting.
Oscillators
Neutral
SellBuy
Strong sellStrong buy
Strong sellSellNeutralBuyStrong buy
Oscillators
Neutral
SellBuy
Strong sellStrong buy
Strong sellSellNeutralBuyStrong buy
Summary
Neutral
SellBuy
Strong sellStrong buy
Strong sellSellNeutralBuyStrong buy
Summary
Neutral
SellBuy
Strong sellStrong buy
Strong sellSellNeutralBuyStrong buy
Summary
Neutral
SellBuy
Strong sellStrong buy
Strong sellSellNeutralBuyStrong buy
Moving Averages
Neutral
SellBuy
Strong sellStrong buy
Strong sellSellNeutralBuyStrong buy
Moving Averages
Neutral
SellBuy
Strong sellStrong buy
Strong sellSellNeutralBuyStrong buy
Displays a symbol's price movements over previous years to identify recurring trends.
Frequently Asked Questions
The current price of JOE/USD TETHER (JOE) is 0.0632 USDT — it has risen 0.31% in the past 24 hours. Try placing this info into the context by checking out what coins are also gaining and losing at the moment and seeing JOE price chart.
JOE/USD TETHER price has risen by 10.24% over the last week, its month performance shows a −20.63% decrease, and as for the last year, JOE/USD TETHER has decreased by −84.02%. See more dynamics on JOE price chart.
Keep track of coins' changes with our Crypto Coins Heatmap.
Keep track of coins' changes with our Crypto Coins Heatmap.
JOE/USD TETHER (JOE) reached its highest price on Dec 6, 2024 — it amounted to 0.6530 USDT. Find more insights on the JOE price chart.
See the list of crypto gainers and choose what best fits your strategy.
See the list of crypto gainers and choose what best fits your strategy.
JOE/USD TETHER (JOE) reached the lowest price of 0.0543 USDT on Dec 19, 2025. View more JOE/USD TETHER dynamics on the price chart.
See the list of crypto losers to find unexpected opportunities.
See the list of crypto losers to find unexpected opportunities.
The safest choice when buying JOE is to go to a well-known crypto exchange. Some of the popular names are Binance, Coinbase, Kraken. But you'll have to find a reliable broker and create an account first. You can trade JOE right from TradingView charts — just choose a broker and connect to your account.
Crypto markets are famous for their volatility, so one should study all the available stats before adding crypto assets to their portfolio. Very often it's technical analysis that comes in handy. We prepared technical ratings for JOE/USD TETHER (JOE): today its technical analysis shows the sell signal, and according to the 1 week rating JOE shows the sell signal. And you'd better dig deeper and study 1 month rating too — it's sell. Find inspiration in JOE/USD TETHER trading ideas and keep track of what's moving crypto markets with our crypto news feed.
JOE/USD TETHER (JOE) is just as reliable as any other crypto asset — this corner of the world market is highly volatile. Today, for instance, JOE/USD TETHER is estimated as 6.16% volatile. The only thing it means is that you must prepare and examine all available information before making a decision. And if you're not sure about JOE/USD TETHER, you can find more inspiration in our curated watchlists.
You can discuss JOE/USD TETHER (JOE) with other users in our public chats, Minds or in the comments to Ideas.