Our opinion on the current state of MASTDRILL(MDI)Master Drilling (MDI) is a South African company that specialises in drilling exploration and other holes for the mining industry. It has diversified into drilling for hydro-electrical projects and construction. The company has moved away from the South African mining industry and now provides servi
4 ZAR
319.29 M ZAR
4.97 B ZAR
65.58 M
About Master Drilling Group Ltd.
Sector
Industry
CEO
Daniël Coenraad Pretorius
Website
Headquarters
Fochville
Founded
1986
ISIN
ZAE000171948
FIGI
BBG003PRXWQ1
IPO date
Dec 19, 2012
IPO offer price
0.91 USD
Master Drilling Group Ltd. is an investment holding company, which engages in the provision of specialized drilling services to blue chip major and mid-tier companies in mining, civil engineering, construction, and hydro-electric power sectors. It operates through the following geographical segments: Africa, Central and North America, Rest of the World, and South America. The company was founded by Daniël Coenraad Pretorius in 1986 and is headquartered in Fochville, South Africa.
Related stocks

Our opinion on the current state of MASTDRILL(MDI)Master Drilling (MDI) is a South African company specializing in drilling exploration and other services for the mining industry, with a diversified portfolio that now includes drilling for hydro-electric projects and construction. The company has strategically shifted its focus away from the South

Our opinion on the current state of MASTDRILL(MDI)Master Drilling (MDI) is a South African company specializing in drilling exploration and other holes for the mining industry, and it has diversified into drilling for hydro-electrical projects and construction. The company has moved away from the South African mining industry and now provides servi

Our opinion on the current state of MDIMaster Drilling (MDI) is a South African company that specialises in drilling exploration and other holes for the mining industry, and which has diversified into drilling for hydro-electrical projects and construction. The company has moved away from the South African mining industry and now provide

Our opinion on the current state of MDIMaster Drilling (MDI) is a South African company that specialises in drilling exploration and other holes for the mining industry, and which has diversified into drilling for hydro-electrical projects and construction. The company has moved away from the South African mining industry and now provide

Master Drilling Interim ReportJSE:MDI came out with positive figures; 34% revenue growth, 57% EPS increase, and 19% cash increase from continuing operations. No interim dividend as per company's dividend policy.
Technically, the stock is on an uptrend, at an area of value. Potential buy area, R14.50/share.


MASTER DRILLa strong move higher technically is possible if fundamentals could align master drill a strong buy
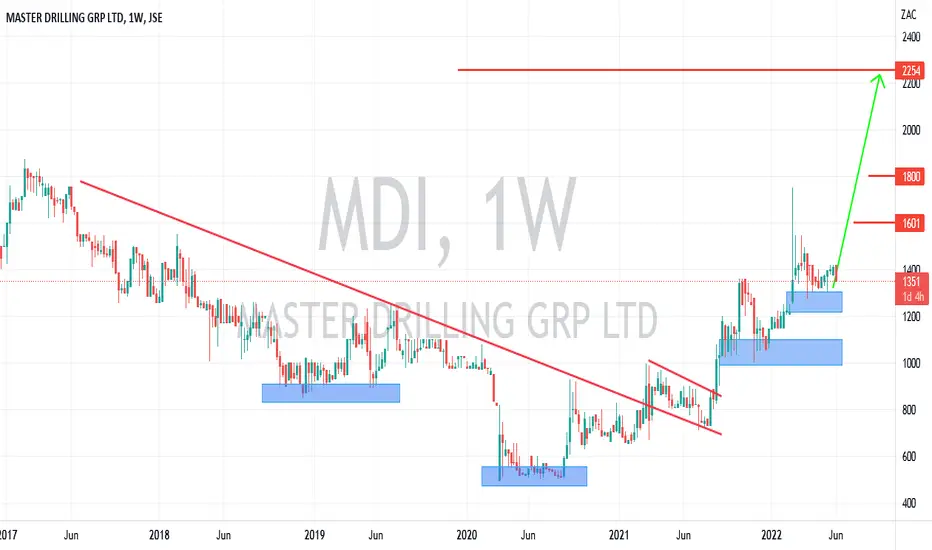
$JSEMDI Master Drilling Company. Consolidating Master drilling has been consolidating in a flag pattern since the strong move up from 520c levels to 900c levels. A convincing (volume) break above 800c could see this share go to 930c and 978c levels.
Warning: Low liquidity on this share could see some wild swings.

See all ideas
Summarizing what the indicators are suggesting.
Oscillators
Neutral
SellBuy
Strong sellStrong buy
Strong sellSellNeutralBuyStrong buy
Oscillators
Neutral
SellBuy
Strong sellStrong buy
Strong sellSellNeutralBuyStrong buy
Summary
Neutral
SellBuy
Strong sellStrong buy
Strong sellSellNeutralBuyStrong buy
Summary
Neutral
SellBuy
Strong sellStrong buy
Strong sellSellNeutralBuyStrong buy
Summary
Neutral
SellBuy
Strong sellStrong buy
Strong sellSellNeutralBuyStrong buy
Moving Averages
Neutral
SellBuy
Strong sellStrong buy
Strong sellSellNeutralBuyStrong buy
Moving Averages
Neutral
SellBuy
Strong sellStrong buy
Strong sellSellNeutralBuyStrong buy
Displays a symbol's price movements over previous years to identify recurring trends.
Frequently Asked Questions
The current price of MDI is 1,570 ZAC — it hasn't changed in the past 24 hours. Watch Master Drilling Group Ltd. stock price performance more closely on the chart.
Depending on the exchange, the stock ticker may vary. For instance, on JSE exchange Master Drilling Group Ltd. stocks are traded under the ticker MDI.
MDI stock has fallen by −0.19% compared to the previous week, the month change is a −3.13% fall, over the last year Master Drilling Group Ltd. has showed a 17.16% increase.
MDI stock is 1.29% volatile and has beta coefficient of −0.08. Track Master Drilling Group Ltd. stock price on the chart and check out the list of the most volatile stocks — is Master Drilling Group Ltd. there?
Today Master Drilling Group Ltd. has the market capitalization of 2.33 B, it has decreased by −1.54% over the last week.
Yes, you can track Master Drilling Group Ltd. financials in yearly and quarterly reports right on TradingView.
MDI net income for the last half-year is 324.52 M ZAR, while the previous report showed 259.44 M ZAR of net income which accounts for 25.08% change. Track more Master Drilling Group Ltd. financial stats to get the full picture.
Master Drilling Group Ltd. dividend yield was 4.78% in 2024, and payout ratio reached 30.74%. The year before the numbers were 3.86% and 20.93% correspondingly. See high-dividend stocks and find more opportunities for your portfolio.
EBITDA measures a company's operating performance, its growth signifies an improvement in the efficiency of a company. Master Drilling Group Ltd. EBITDA is 1.02 B ZAR, and current EBITDA margin is 20.73%. See more stats in Master Drilling Group Ltd. financial statements.
Like other stocks, MDI shares are traded on stock exchanges, e.g. Nasdaq, Nyse, Euronext, and the easiest way to buy them is through an online stock broker. To do this, you need to open an account and follow a broker's procedures, then start trading. You can trade Master Drilling Group Ltd. stock right from TradingView charts — choose your broker and connect to your account.
Investing in stocks requires a comprehensive research: you should carefully study all the available data, e.g. company's financials, related news, and its technical analysis. So Master Drilling Group Ltd. technincal analysis shows the neutral today, and its 1 week rating is buy. Since market conditions are prone to changes, it's worth looking a bit further into the future — according to the 1 month rating Master Drilling Group Ltd. stock shows the buy signal. See more of Master Drilling Group Ltd. technicals for a more comprehensive analysis.
If you're still not sure, try looking for inspiration in our curated watchlists.
If you're still not sure, try looking for inspiration in our curated watchlists.