The key is whether the price can break above the 0.04032-0.04342
Hello, traders!
Follow us to get the latest information quickly.
Have a great day.
-------------------------------------
(JSTUSDT 1M chart)
If the price holds above 0.03942, a full-scale uptrend is expected to begin.
-
(1W chart)
If the price rises with support near 0.03942, an upward breakou

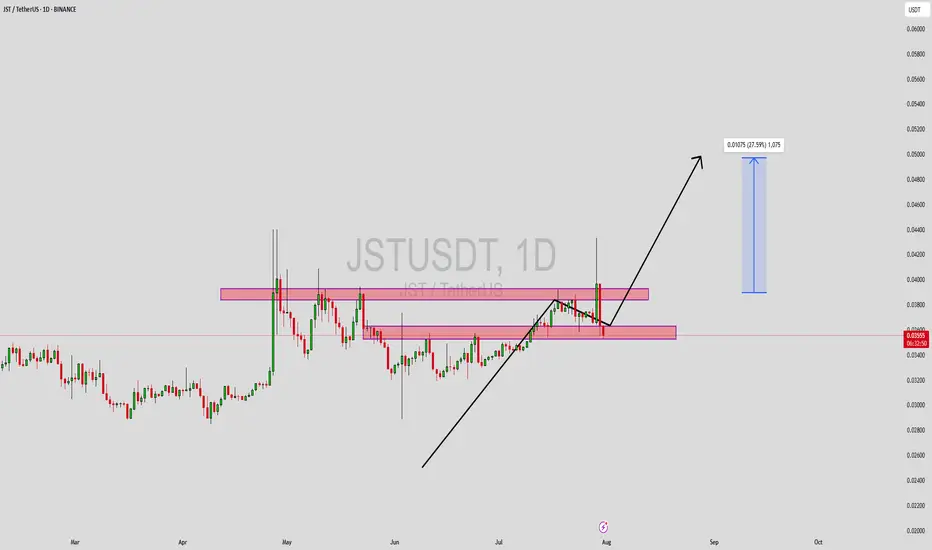
JSTUSDT 1D#JST is moving inside a falling wedge pattern on the daily chart and is on the verge of breaking out above the resistance cluster, which includes the wedge resistance, the Ichimoku cloud, and the daily SMA200. If that happens, the potential targets are:
🎯 $0.03527
🎯 $0.03694
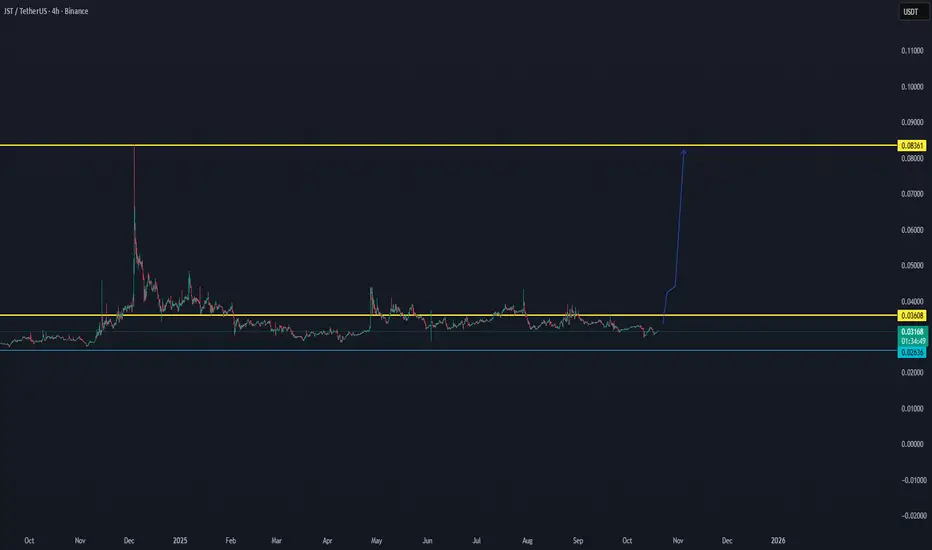
🎯 $0.03861
🎯 $0.04098
🎯

JST/USDT — Major Reversal Setup Forming, 200% Potential AheadJST/USDT — Major Reversal Setup Forming, 200% Potential Ahead 🚀
JST is showing early signs of a trend reversal after an extended accumulation phase. The price is stabilizing around $0.032, with visible compression and increasing volume — both classic signals of an upcoming breakout move.
The next

JST/USDT Second BREAKOUT ON WAY..Data view shows that there is a high chance JST can break out for the second time since the last volume data. We will follow these coming time frames to see what is able to do.
JUSDT Short-Term Retrace vs Long-Term UptrendJST is not trading at bottom prices because the low was hit November 2022, but the bigger picture still looks like a long-term consolidation pattern. Sideways for years, this precedes a major bull market.
Good morning my fellow Cryptocurrency trader, I hope you are having a wonderful day.
JSTUSDT

JSTUSDT Forming Bullish MomentumJSTUSDT has recently gained attention among traders as it moves closer to a key breakout level. The chart shows a series of higher lows, indicating underlying bullish momentum despite short-term rejections near resistance zones. The price action reflects a coiling structure with tightening price ran
JSTUSDT – Long-term Spot Buy Recommendation (2025)JSTUSDT – Long-term Spot Buy Recommendation (2025)
Context: The altcoin market has been bottoming out relentlessly since 2023. JST is no exception.
Out of thousands of tokens, why JST?
Because JST has just triggered a confirmed bottom signal this week, making it a prime candidate to buy.

JSTUSDT Forming Bullish WaveJSTUSDT is exhibiting a classic bullish wave pattern, signaling the potential for a trend reversal and a significant upward price movement. Recent price action suggests a solid base has been formed, with higher lows indicating growing buying pressure. As volume picks up, this adds weight to the bull
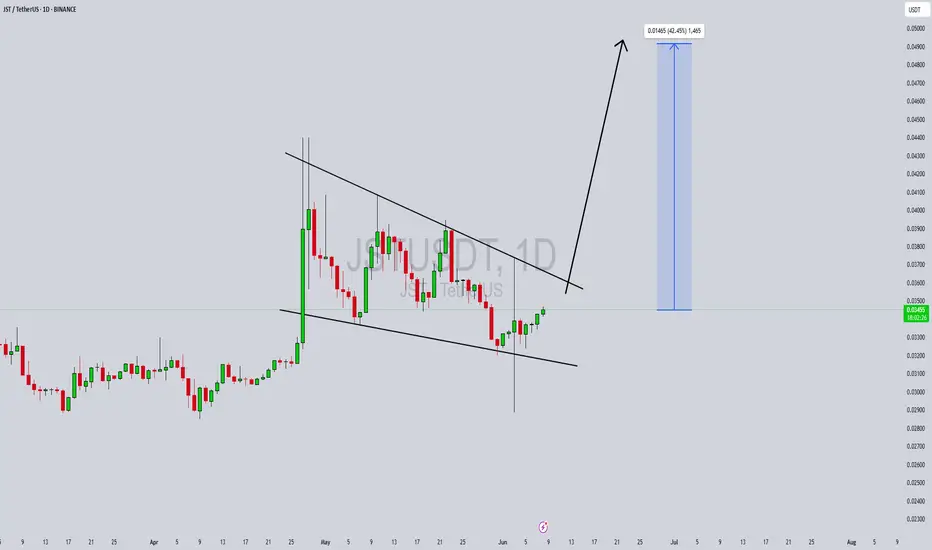
JSTUSDT 12H#JST is moving inside a symmetrical triangle pattern on the 12H timeframe.
To maintain bullish momentum, it must hold above the 12H EMA50. A breakout above the triangle resistance could trigger the next leg up.
In case of a breakout, the targets are:
🎯 $0.04140
🎯 $0.04323
🎯 $0.04583
🎯 $0.04915
⚠️

JUST x20 in 20251. DWF Labs made the first purchase with their new altcoin wallets. Justin Sun's #JST token has been purchased
2. On April 28, Sun stated that he believes that JST will become a 100x token.
3. Justin Sun knows how to make pumps. This is bullish

See all ideas
Summarizing what the indicators are suggesting.
Oscillators
Neutral
SellBuy
Strong sellStrong buy
Strong sellSellNeutralBuyStrong buy
Oscillators
Neutral
SellBuy
Strong sellStrong buy
Strong sellSellNeutralBuyStrong buy
Summary
Neutral
SellBuy
Strong sellStrong buy
Strong sellSellNeutralBuyStrong buy
Summary
Neutral
SellBuy
Strong sellStrong buy
Strong sellSellNeutralBuyStrong buy
Summary
Neutral
SellBuy
Strong sellStrong buy
Strong sellSellNeutralBuyStrong buy
Moving Averages
Neutral
SellBuy
Strong sellStrong buy
Strong sellSellNeutralBuyStrong buy
Moving Averages
Neutral
SellBuy
Strong sellStrong buy
Strong sellSellNeutralBuyStrong buy
Displays a symbol's price movements over previous years to identify recurring trends.