KASPA Is Compressing Into a Macro Coil — Big Move Approaching?📉➡️📈 KASPA Weekly Falling Wedge – Compression Before a Larger Move
_______________________________________________________________________________
KASPA (KASUSD) – Weekly Falling Wedge Analysis
Kaspa has been forming a large falling wedge on the weekly timeframe, a structure often associated with decreasing selling pressure and potential bullish reversal setups. The trendlines have held for months, and price continues to compress as it approaches the apex of the pattern. Confidence is medium at this stage: the pattern remains valid, but momentum has not yet confirmed a breakout.
_______________________________________________________________________________
📉 Structure Overview
On the weekly chart, price action has been steadily narrowing between lower highs and relatively stable lows. The lower trendline has been tested multiple times, and the aggressive wick on October 6th highlighted strong buying interest at this support. Since the Kraken listing, volume has gradually declined, which is typical behavior in the later stages of a wedge. Based on the current trajectory, a breakout still appears to be several weeks away as the market continues its compression.
_______________________________________________________________________________
🐂 Bullish Scenario
If Kaspa continues to respect the wedge support, the first significant move would likely be a push toward the upper boundary of the structure near $0.09. Should price break out of the wedge, the next areas of interest become:
🎯 $0.09 – First touch of upper wedge resistance
🎯 $0.10 to $0.11 – Key structural resistance zone
🎯 $0.13 – A measured-move extension and historical supply area
The strong wick reaction at the lower boundary suggests that buyers are active at these levels, which supports the idea that upside continuation is a realistic scenario if structure holds.
_______________________________________________________________________________
🐻 Bearish Scenario
A full weekly candle close below the wedge would invalidate the structure and would likely lead to increased bearish momentum. If this breakdown occurs, the next downside levels to watch are:
🔻 $0.032 – First major support
🔻 $0.015 – Broader structural low
Although this outcome is technically possible, it currently appears less probable due to the strength of demand visible along the lower trendline.
_______________________________________________________________________________
📐 Why This Pattern Matters
A falling wedge represents tightening volatility and a reduction in selling strength as the pattern matures. These conditions often create a coiled-spring effect, leading to significant movement once the structure resolves. On a weekly chart, wedge breakouts tend to result in multi-week or multi-month directional moves, which makes this current setup important to monitor.
💡 Fundamental Tailwinds Supporting Long-Term Strength
Kaspa’s fundamentals continue to evolve alongside this technical setup.
_______________________________________________________________________________
🧠 VProgs (Virtual Programs)
VProgs introduce customizable, programmable rules directly into transactions. This allows users to define spending conditions, automate certain behaviors, and create more complex logic without relying on a full smart contract engine. They deliver much of the flexibility associated with smart contracts while keeping execution lightweight and efficient.
_______________________________________________________________________________
⚙️ Smart-Contract-Like Capabilities via the BlockDAG
Kaspa’s BlockDAG architecture, combined with VProgs, provides room for expressive, rule-based applications while maintaining extremely fast confirmation times and strong Proof-of-Work security. This positions Kaspa to serve as a high-throughput programmable network without the bloat or congestion common in legacy smart contract environments.
These fundamental developments support strong long-term potential, even as price compresses in the short term.
_______________________________________________________________________________
📌 Summary and Final Outlook
Kaspa is approaching the apex of a clean falling wedge on the weekly chart. Volume is tapering, structure remains intact, and both bullish and bearish scenarios are clearly defined. The next major move will likely emerge once price resolves this tightening pattern.
_______________________________________________________________________________
Bullish Targets:
📈 $0.09 → $0.10–$0.11 → $0.13
Bearish Invalidations:
📉 Weekly close below the wedge → $0.032 → $0.015
Overall, Kaspa continues to show long-term promise, supported by both technical structure and evolving fundamentals. Traders should watch closely as price approaches the point of resolution within this macro wedge.
Trade ideas


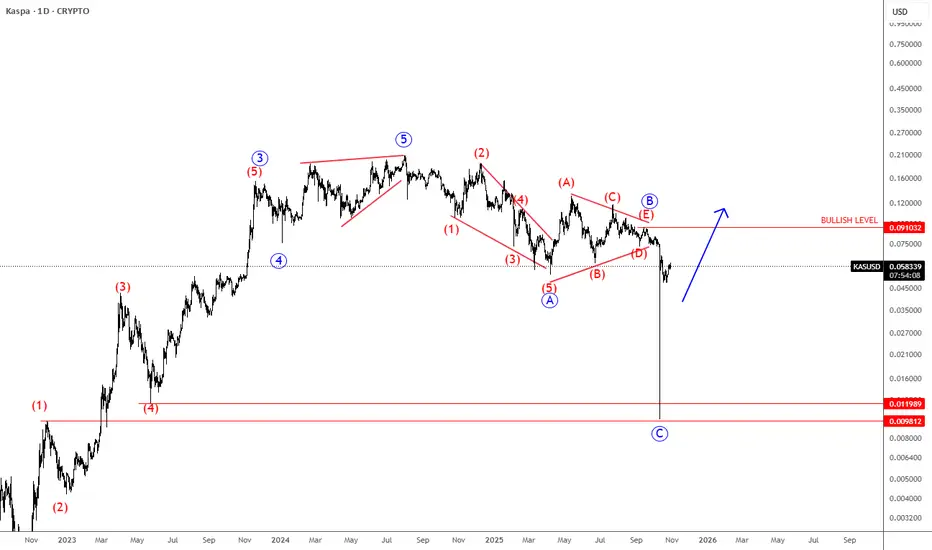
Kaspa Completes A Correction After A Huge SpikeKaspa Completes A Correction After A Huge Spike that can be supportive, as we see a corrective structure within the uptrend by Elliott wave theory.
Kaspa is a proof-of-work (PoW) cryptocurrency that uses the novel GHOSTDAG protocol (a block-DAG consensus rather than a single linear chain) to allow many blocks to be produced more rapidly and co-exist. It was launched without an ICO / pre-mine (fair launch) and positions itself as more scalable than many PoW chains. Because of this, it has attracted interest as a “next-gen PoW” or “fast chain” alternative.
Kaspa’s sell-off appears of a combination of leveraged long liquidations intensifying a move down, weak macro/altcoin sentiment and structural risks (adoption/supply concentration). Despite a massive price drop, sparking fear and pessimism across the market, such deep pullbacks often create opportunity rather than signal failure. Despite the volatility, Kaspa’s fundamentals remain solid. Its innovative GHOSTDAG technology, fair launch, and strong network activity continue to set it apart. When fear dominates and sentiment turns overly negative, it can actually be a supportive setup for long-term investors looking to accumulate quality projects at discounted levels.
From Elliott wave perspective, KASUSD(Kaspa) spiked down out of a wave B triangle pattern into wave C, so it’s a higher degree ABC correction. It still looks promising for the future, and we may still see some rally in the current bullish cycle. Bullish confirmation is above 0.091 area.
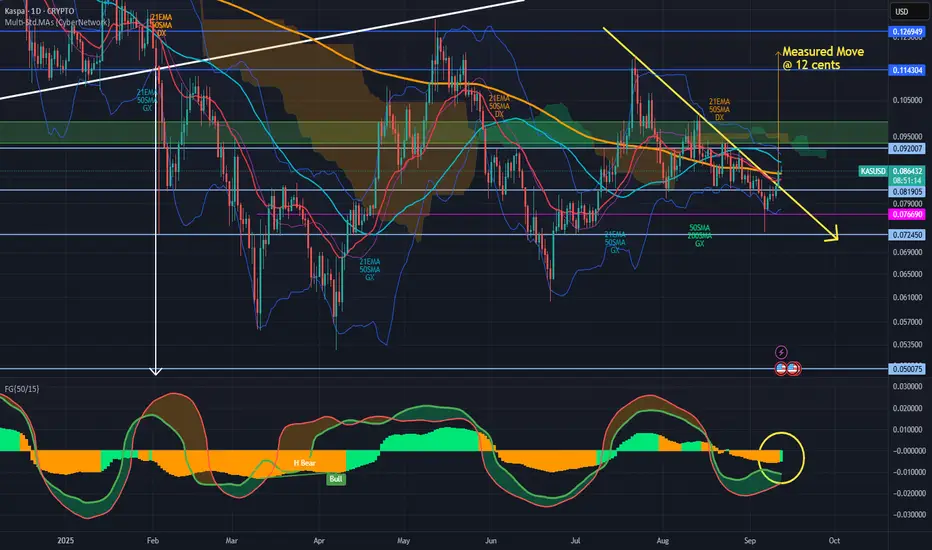
Kaspa has finally broken out with confirmation.Measured move at 12 cents.
FG histogram turned green again.
Attempting to support above the orange 200 SMA line right now.
Kaspa Bullish Gartley?Noticed this harmonic pattern developing on the Kaspa chart. Let’s see how this plays out over the coming weeks

Kaspa (KAS) Price Prediction – Stuck Between $0.085 and $0.10 KAS is stuck in a sideways grind just above its 200-day SMA. $0.10 remains the wall to beat — can bulls break through or will $0.085 give way first?
Kaspa (KAS) price remains trapped in a tight range, holding just above the 200-day SMA...
Kaspa (KAS) price remains trapped in a tight range, holding just above the 200-day SMA but repeatedly failing to clear the $0.10–$0.105 resistance zone. Since peaking at $0.118 in July, KAS has been stuck between key support and resistance levels, now trading at $0.08956 (-9.37% in the last 24h).
The descending trendline from April’s $0.125 high, connecting to July’s $0.118 peak, is still capping upside moves. Support at $0.085 has held multiple times since late July; losing it could bring $0.080 back into play.
⸻
Daily Overview (August 15):
• Current Price: $0.08956
• RSI (14): 48.70 – neutral
• MACD: mild bullish momentum
• ADX: 29.07 – strong but bearish trend
• CCI: 61.90 – leaning bullish
• ROC: 2.664 – positive change
• Bull/Bear Power: 0.0028 – slight buyer edge
⸻
Bullish scenario:
A breakout above $0.10 could target $0.105–$0.110, with a possible extension to $0.118–$0.120 if momentum accelerates.
Neutral scenario:
Price stays between $0.085 and $0.10 until a catalyst sparks a move.
Bearish scenario:
A daily close under $0.087 could lead to $0.084–$0.085, with $0.080 as the next support.
⸻
Chart Notes:
• Resistance: $0.10, $0.105, $0.110
• Support: $0.085, $0.080
• Descending trendline from April high still in control.
• 200-day SMA acting as a critical floor for buyers.
KAS - world of pain incomingKAS slowly loosing momentum. It kept breaking supports and then pushed higher but each push higher had less and less slope (aka power). We once again broke support which is almost horizontal, tried to climb back above it but were rejected. Trend has reversed and now we start sloping supports downward. Once we loose fibb 0.236 horizontal support I expect move down to speed up (like OM did). Have no interests in it till we hit fibb 0.886 range...

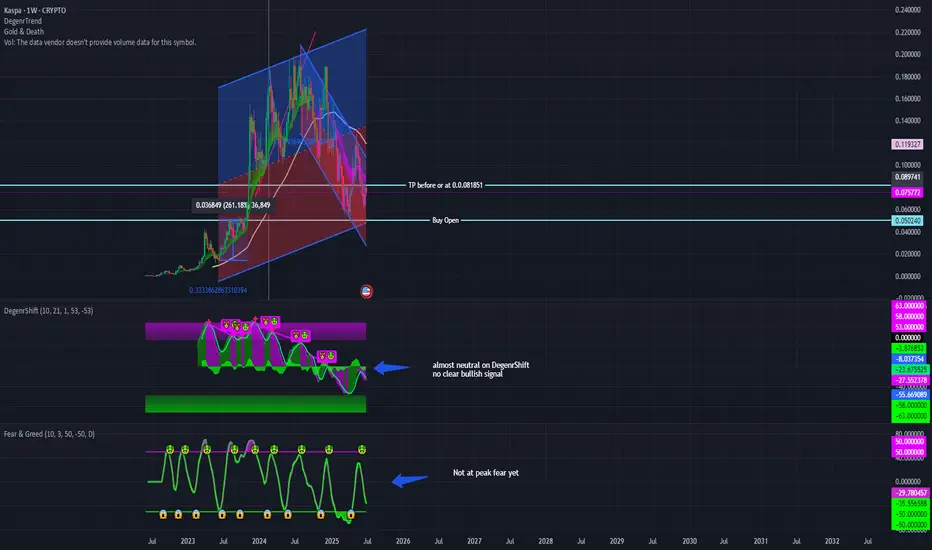
KAS - Short then longStill has some room to go on fear and greed index, not bullish on DegenrShift yet, potential downside before longing at 0.05, TP at or before 0.8. Is it stink bid'ish...sure but why not.
KASPA: $0.08 | Loyalty Check is Over - Blessing to Followhad this few moons ago
got shaken out and bidded out
when public took over pump it to sensational highs
it is the fastes coolest layer 1 out there
fairly allocated and decently priced in
for both speculators investors and PERPS folks in the futures
volume significant
and fundamentally DEVS are growing
so is community
and yet under rated
off the social scene
think of this like AMAZON at early stages selling books
strategy: time to hop on

Kaspa 2025 possible peak PA projectionsKaspa price action has been a heated subject over the last 12 or so months and now that we are getting closer to the end of this 4 year cycle we need to delve into possible scenarios. With all the great future points coming for kaspa it is hard not to see this asset climb within the 6 months that we have until the end of year for 2025. Kaspa is about to roll out smart contracts, tier 1 exchanges like Binance, Coinbase, OKX, Robinhood and a few tier 2's for listings, stabel tokens like USDC and USDT will be coming for Kaspa this year as well. All this is very bullish along with the recent upgrade on the network moving from 1 block per second to 10 blocks per second confirmations on mainnet. It is hard not to see price action move aggressively and fast for Kaspa given all these points playing out within 6 months from current date. I have the power-law from PlanK on the daily chart and although this may not be an accurate indicator it does work well for the emmission shcedule for Kaspa. I also have a parabola from lowest point to the recent low which came after the Wycoff Distribution bottom we just had at $0.05. I have a hunch that price action will just not be a skimpy or low of $0.50 but rather much higher ranging between $1.50 to $6.42 by end of this year sometime.

Kaspa - game over?Weekly TF
Chart inverted
Looking at this chart - what would you do here? Kaspa has been unable to exceed the $0.19 - 0.20 high. And has broken below 2 x key trend lines.
I seem to be missing some historical data on this chart but if we use the lowest price point and use a fibbonahi retracement tool, the 0.5 puts is roughly $0.010 - 0.012. Equal to a 80-90% drop.
If KAS sees continuation to the downside I believe this is where price could head next 📉
This coin had a good run for c.700 days, followed by 200 days of flat p.a. /consolidation - it makes sense that there would be a significant correction.

KASUSD is heating up the engine!About KASUSD:
1. Both RSI and MACD indicate a breakout, with MACD showing a divergence.
2. The price has reached the historical trendline.
3. According to the Elliott Wave theory, the price appears to be in a corrective phase, potentially reaching around the 61% retracement level (approximately $0.08). This price can be a good level for entry.

KAS/USDTRetesting the ascending channel has failed, which confirms that we will head towards the big downward trend. Welcome to the profitssss

Kaspa on Its Path to Glory (TA + Trading Plan) + UPDATETechnical Analysis for KASPA (KAS)
Current Price: 0.11268 USD
Timeframe: 4-Hour Chart
Indicators and Key Observations:
Price Action: Kaspa is currently in an ascending triangle pattern, with price action approaching the resistance line, which has been tested multiple times without a clear break. This pattern indicates the possibility of a breakout if the price moves above the resistance line.
Support Zone: The support level has been consistent, forming a base near 0.1070 USD. This is a crucial area where buying interest has been observed.
Resistance Line: The price is approaching the resistance at around 0.1130 USD. A breakout above this level could signal bullish continuation towards higher targets (potentially 0.1900 USD as indicated by the chart’s blue arrow).
Technical Indicators:
VWC Cipher B Divergences: The indicator shows bullish signals, suggesting that price might continue to rise, especially if it successfully breaks the resistance line.
RSI (Relative Strength Index): The RSI is sitting at around 52.96, indicating that the asset is neither overbought nor oversold. This gives space for potential bullish momentum.
MFI (Money Flow Index): The MFI is relatively neutral, indicating that there is no immediate imbalance between buying and selling pressure.
Stochastic Oscillator: The oscillator shows a potential bullish crossover, with the signal line moving towards the overbought zone.
Trading Plan for KASPA (KAS)
Entry Strategy:
Long Entry: Consider entering a long position once the price breaks and closes above the resistance line around 0.1130 USD. Look for confirmation through a strong green candle to ensure momentum continuation.
Target: The primary target for this trade is 0.18 USD, as indicated by the blue arrow in the chart. A second target can be placed near the psychological level of 0.20 USD, depending on market conditions and price action.
Stop-Loss Strategy:
Place the stop-loss slightly below the support zone, ideally around 0.1060-0.1070 USD, to protect against a false breakout. The stop-loss should be adjusted as the price moves in your favor to lock in profits.
Risk-Reward Ratio:
The risk-reward ratio for this trade is favorable, as the potential upside (0.18-0.20 USD) significantly outweighs the downside risk (stop-loss below 0.1070 USD). A risk-reward ratio of 2:1 or higher is ideal for entering the trade.
Volume Confirmation:
Ensure that the breakout above resistance is accompanied by an increase in volume. Low-volume breakouts can lead to false signals, so confirming the move with higher-than-average volume is crucial for a successful trade.
Risk Management:
As always, never risk more than 2% of your trading account on any single trade. Use proper position sizing and adjust your stop-loss accordingly to maintain a controlled risk profile.
Recent News - Crescendo Upgrade 🚀
Today, Kaspa has rolled out its Crescendo upgrade, which boosts the network speed to 10 blocks per second. This is a major leap in scalability, enhancing transaction speed and efficiency. The upgrade is expected to drive greater adoption and increase investor interest, potentially providing additional support for the upward momentum in the KAS market.
Kaspa (KAS) is showing signs of bullish momentum, with key technical indicators pointing to a potential breakout above resistance. The recent Crescendo upgrade adds further optimism for the coin's future prospects, making this an exciting trade to consider. Be sure to monitor price action closely and implement strict risk management strategies for optimal results.

Kaspa looking ready for the next leg up.Successful retest of breakout level.
Next target at 12 cents.
10 BPS incoming.
IGRA smart contract layer incoming.

Kaspa Vs Eth have finally broken out. Heading to ATH?After a period of DCAing, especially within the green zone (golden pocket), Kaspa had finally set a higher high, and now have broken out above the long-term yellow resistance line.
Orange measured-move line indicates that Kaspa will be heading up to retest the ATH (vs ETH) again.
Here's a zoomed-out view of the long-term support/resistance lines drawn.

Reworked Kaspa Weekly and Daily Cycles using KAS/USDReworked Cycle counts on Kaspa/USD chart
Using Fiance Camels "How to set up Cyvle count on a specific Asset", I reworked the Dailt (DCL) and Weekly (WCL) counts.
DCL form in 60 days (+/- 10%), and there are 5 DCL within the larger WCL (D/WCL-DCL-DCL-DCL-DD/Wcl)
WCLs are ~ 32 WKs (+/- 10%)

KAS potential setup $$KAS appears to be recovering nicely, suggesting that the selling pressure has subsided, and buyers are stepping back in. Buying on SPOT here could potentially benefit good gains over the medium term.
Profit Targets:
First Target: 0.125 (immediate resistance).
Second Target: 0.15 (psychological resistance and potential area for profit-taking).
Third Target: 0.20 (long-term resistance if the bullish trend continues).
Stop-Loss Area: Place a stop-loss just below the key support level at 0.077 to limit downside risk. This ensures that if the recovery fails, losses are minimized.
Cheers!
KASUSD Channel Down bottom rebound. When to sell again?Kaspa (KASUSD) is trading within a (blue) Channel Down pattern since the July 31 2024 High. The formation only broke for 4 days last December. Last Monday, the price touched the bottom (Lower Lows trend-line) of the Channel Down and today we see the technical rebound reaction in full effect.
The 1D RSI turning oversold (<30.00) is a major part of this. The current Bullish Leg should target at least the 0.618 Fibonacci retracement level at 0.12500, as all 3 previous rebounds within the long-term Channel Down did.
It is very likely to see a rejection there, as it is the top (Lower Highs trend-line) of the diverging (dotted) Channel Down, which was initiated on the December 08 2024 High. We expect the bearish reversal to hit at least 0.07500, potentially at the same time the 1D RSI turns oversold again.
-------------------------------------------------------------------------------
** Please LIKE 👍, FOLLOW ✅, SHARE 🙌 and COMMENT ✍ if you enjoy this idea! Also share your ideas and charts in the comments section below! This is best way to keep it relevant, support us, keep the content here free and allow the idea to reach as many people as possible. **
-------------------------------------------------------------------------------
💸💸💸💸💸💸
👇 👇 👇 👇 👇 👇

KASPA accumulation from ETH strategy, continued..I was waiting to sell about 25 more ETH to accumulate ~1 million Kaspa if KAS/ETH hits ~0.000025 or lower; base on the orange measured move drawn and circled (at the bottom thick yellow support line).
However, it appears a bullish is starting to form on the FG{50/15} histogram, and the previous daily candle on the 7Feb2025 engulfs the previous red candle on the 6Feb2025.
If KAS/ETH is able to break above the golden pocket (dashed horizontal thick yellow line), and then subsequently breaks above the top of the narrowing wedge (defined by thin white lines), then it is likely for KAS to continue above the 50 Fib retrace level and to the top of the thick yellow long-term resistance level.
Note: Here the Fib levels were redrawn, as comparted to my earlier published analysis.
If KAS/ETH breaks below the golden pocket at the 65% retrace lvl, then opportunity to accumulate KAS from ETH at or below 0.000025 ETH per KAS will then become likely.

Long Trade: Kaspa vs Ethereum Daily ChartFG-Histogram turned green and into the positive zone, as well as Bullish Divergence established on the daily.
Previously, a bearish divergence with the FG-Histogram subsequently turning orange marked the start of the dump in September 2024.
Have been slowly DCAing more into KAS from ETH within the golden pocket again, while setting stop limit below the 65% retrace level.

Kaspa Yin Yang pattern for 2025 target $6.42Kaspa Yin Yang pattern for 2025 target $6.42
I am giving this post a new name for a chart pattern which I am calling the Yin Yang chart pattern. This pattern is based on the curves of the Yin Yang pattern and not really on the philosophical aspects or traits that it illustrates.
I know this may sound strange and I had to try to contain the excitement over this possibility. Maybe some of you professional technical traders can enlighten me as I need it so many times when looking at the charts.
What we are looking at is a Fibonacci Retracement from the high price of Kaspa on July 31st, 2024 to the high of June 3rd, 2022. On June 3rd the price of Kaspa was at $0.00062 while the price on July 31st, 2024 was at $0.20781. When we apply the fib retracement we get a fib zone of 1.618 at a price target of $6.42. The interesting thing that shocked me was I posted on X back in 2023 that Kaspa would hit a target price of $6.42 and I based this on several metrics on mining and hash power plus price for both BTC and Kaspa which gave me this crazy $6.42 target. Today is when I decided to plot the Fibonacci zones and to my excitement the 1.618 was right on the price that I came up with back in late 2023. I wanted to share this post so that we can see if this will even happen. This is all speculative but fibonacci numbers are pretty solid targets to consider when looking into future price action.

KASPA in 2025#Kaspa seems to be in a triangle within a 3rd wave.
Breaking $0.1030 invalidates this idea.
Passing $0.1895 confirms targeting a new all-time high.
