Chainlink (LINK) – The Final Stage of a 5-Year CompressionChainlink (LINK) – The Final Stage of a 5-Year Compression**
The chart is telling one very clear story:
> **Chainlink is approaching the end of a 4-year descending macro trend while sitting on a 3-year accumulation floor.**
> The moment these two structures converge, a major regime shift usually follows.
**“The 5-Year Pressure Is About to Break.”**
---
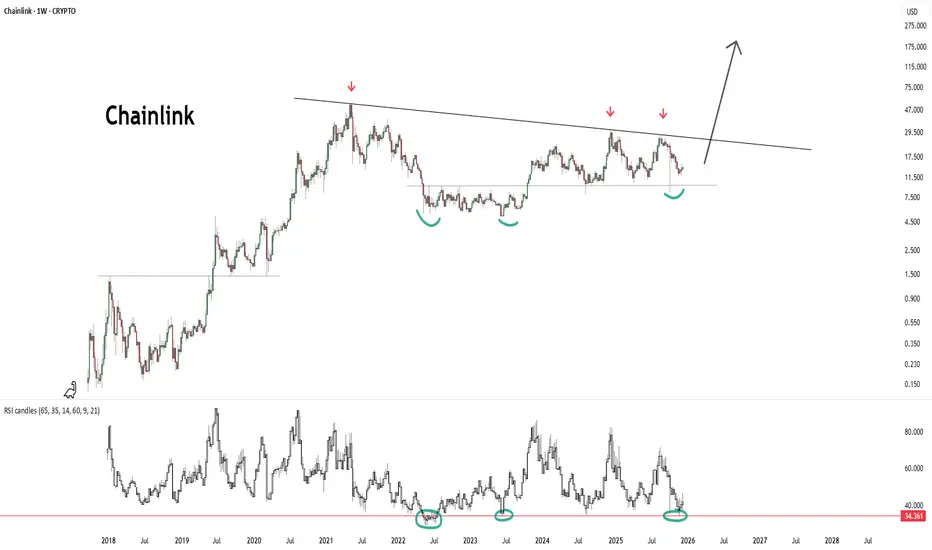
🔹 **1) The 4-Year Descending Macro Trend (2021 → 2025)**
The red arrows mark the same long-term trendline connecting the major tops of:
* 2021
* 2022
* 2024
This line has acted as the **spine of the bear market**.
And LINK is now marching **back into this line for the next major test**.
A break here is not just a trend break.
It is a **market regime shift**.
---
🔹 **2) The 3-Year Horizontal Accumulation Floor**
The green curved bottoms highlight how:
* 2022
* 2023
* 2024
* and late 2025
have all produced **identical bottom structures** around the 12–13$ region.
This is:
**A large, asymmetric inverse H&S (iH&S) structure**
Ugly, uneven, but extremely powerful.
Key observations:
* Bottoms don’t break
* Selling is absorbed
* Volatility is compressing
* Strong structural demand refuses to give way
This is **large-scale accumulation**, not weakness.
---
🔹 **3) Weekly RSI – The Macro Cycle Floor**
The RSI bottom line around **34** has marked every major cyclical low since 2018:
* 2018 bear bottom
* 2020 crash
* 2022 bear bottom
* 2023 correction
* **And right now**
LINK’s **macro oscillator cycle is at bottom territory** — a region historically followed by multi-month expansions.
---
🔹 **4) Technically, the picture is this:**
* **A 4-year descending trendline above**
* **A 3-year accumulation zone below**
* **RSI sitting at cycle lows inside**
This is the type of setup that precedes massive impulsive waves.
---
⭐ **"Chainlink is coiled inside a high-timeframe expansion structure."**
When these structures break, they don’t produce small moves —
they produce **cycle expansions**.
---
🔹 **5) Fundamental Drivers – Why This Cycle Is Different for LINK**
Chainlink now sits at the center of crypto’s real infrastructure layer.
**1) CCIP (Cross-Chain Interoperability Protocol)**
Adopted by:
* BlackRock
* DTCC
* SWIFT
* Multiple banks and RWA platforms
2024–2025 marks the first time traditional finance begins using LINK’s infrastructure at scale.
**2) Oracle fee growth**
The rise of RWA (Real-World Assets) means:
* More data feeds
* More volume
* More fees
* More burn pressure on the token economy
Chainlink’s tokenomics finally enter a structurally bullish regime.
**3) Macro Altcoin Liquidity Expansion**
In every cycle, certain infrastructure tokens become early movers.
LINK is positioned to be one of them due to:
* Dominance in the oracle sector
* Institutional integrations
* Network effects
---
🧭 **6) Probable Scenario (Technical)**
**Bullish scenario (primary expectation):**
* Break above the 4-year trendline
* Weekly close above **18–20$**
→ 29–32$
→ 46$
→ **Macro target: 70–75$**
**Bearish scenario (lower probability):**
* Breakdown below 13$
→ liquidity sweep toward 9–10$
(Indicators currently reject this scenario)
Log MACD
---
LINK/BTC 1w
LINKBTC has been compressing inside a falling wedge for nearly 6 years — one of the longest and cleanest structures in the entire market.
Multi-cycle descending trendline overhead
Perfectly defended accumulation line below
Volatility squeezed to historical lows
Sellers exhausted
Breakout energy building
LINKUSD and LINKBTC both aligning for macro upside
This is not a short-term chart.
This is a cycle-level setup.
And setups like this usually end the same way:
“Compression → Breakout → Parabolic Repricing vs Bitcoin.”
LINKBTC has been “ignored” for years because LINK’s USD pair looked stable while BTC outperformed.
But structurally:
BTC strength pushed LINKBTC down
LINK never lost its demand trendline
A massive energy coil has formed
When BTC dominance stalls or rotates,
LINKBTC normally enters a full expansion cycle.
Historically:
LINKBTC expansions are violent
They outperform BTC by 2–4× in strong phases
This pattern is setting the stage for another one.
🎯 **Conclusion
**Chainlink is approaching the most important structural point since 2020.**
The alignment is extremely rare:
* RSI at cycle lows
* Price at a 3-year demand floor
* Approaching a 4-year macro trendline
* CCIP adoption accelerating
* RWA growth pulling LINK into real-world usage
This is not a normal chart.
This is a **macro cycle setup**.
And these setups usually play out like this:
> **“Trend breaks → FOMO awakens → Expansion begins.”**
Trade ideas
$LINK MultiAs with the rest of the market, we are scraping the lower end of a multi year channel. Time will tell. Sentiment is entirely split.
2026 Approaches.
Let's see what happens.

LINK It will grow soon...The wedge pattern will break in the direction it is breached, and the price will move in that direction. In my opinion, the price could be Bullish and may up to $17.

Is this correct? Need help figuring this stuff out. Checking to see if I am reading these trends properly. Any help would be greatly appreciated! Thanks and God Bless

CHAINLINK – LONG - A WHISPER BEFORE THE BREAKOUTTraders,
I believe BINANCE:LINKUSDT is quietly setting up for another leg up. Let me walk you through the logic.
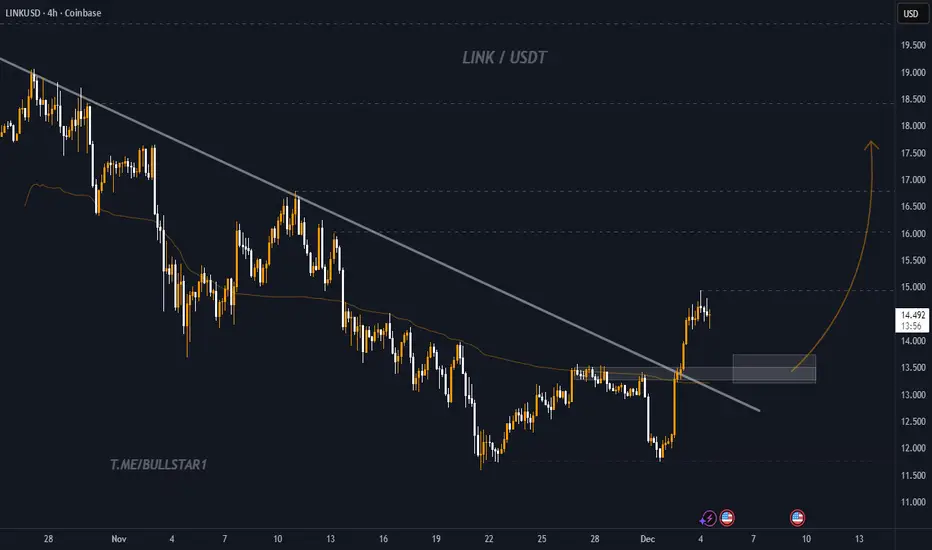
HTF structure - wedge breakout and retest
Price has broken out of a HTF falling wedge that has been guiding price action for weeks. A falling wedge is a compression pattern where:
Highs and lows are both trending lower
The upper trendline is steeper than the lower one
So sellers are still in control on the surface, but every push down is getting less effective. Once price breaks above the upper wedge line with an impulsive move, it usually means:
Most of the aggressive sell pressure inside the pattern has been absorbed
New buyers are willing to chase higher outside of that structure
That is exactly what I see on $LINKUSDT.
After the breakout, price rotated back down and is currently testing an imbalance zone around 13.75. This area:
Is the origin of the last impulsive leg up
Lines up with a clean Fib potential reversal zone on the LTF
So from a pure structure point of view this is a classic breakout → retest → potential continuation setup.
Order flow - hidden bull divergence and absorption
To see if the idea is backed by real flows, I zoomed into the CVDs and open interest.
On the pullback into 13.7 to 13.8:
Aggregated CVD Spot makes lower lows
Aggregated CVD Futures (stablecoin margined and coin margined) also print lower lows
While price holds a higher low compared to the previous swing
That is a hidden bullish divergence between price and CVD. In simple language: more market selling is hitting the books, but price refuses to break down. This usually means:
Sell pressure is being absorbed by passive buyers
Strong hands are using the dip to accumulate rather than distribute
Open interest supports that idea:
Stablecoin margined OI bled lower during the pullback, which suggests late longs getting flushed and some short covering
Coin margined OI is starting to curl up from the lows, which often signals new directional positioning right where CVD is making new lows and price is holding
That combination looks more like reloading than topping.
Targets and TPO weak highs
Now to the upside magnets. On the HTF and weekly TPO I am watching a series of weak highs that have not been properly tested:
1. 19.03 area - weekly TPO weak high
Formed with very little excess on the profile
Built mostly outside RTH, so it carries less conviction
These kinds of highs often get swept for liquidity before any real reversal happens
2. 20.20 area - second weekly TPO weak high
Similar story, clean horizontal high, thin rejection
Again, not much time spent there, so it looks more like an unfinished auction than a completed top
In my view, both of these levels are liquidity pools rather than solid resistance. If the current wedge breakout plays out, I expect price to at least probe and likely run these highs. From there, my HTF roadmap looks roughly like this:
Major Target 1: sweep the 19.0 weak high and push into the 20.0 to 20.2 block
Major Target 2: extension toward the 10 October liquidation event local high, which I have marked on the chart, and beyond that into the 22.7 to 23.6 region if momentum really kicks in
I also believe that altcoins as a group are eyeing that 10 October liquidation event local high. Many charts show similar untested spikes there, so a broad alt sweep of that zone would fit nicely with this BINANCE:LINKUSDT structure.
Invalidation
No setup is complete without an invalidation. For me the idea loses its edge if:
Price accepts back inside the broken wedge, not just a wick, but clear trade and structure back under the upper wedge line
Especially if that happens with CVD rolling over and OI expanding to the downside
If we get that, it would tell me that the breakout was a trap and that the current demand at 13.7 to 13.8 was not strong enough to hold.
Until that happens, as long as price is holding above the wedge and above the imbalance, I treat this as a constructive continuation setup with unfinished business at those weekly weak highs and the October local high.
As always, the market speaks softly before it moves loudly . Listen well, Nomads.
---------------------------------------------------------------------
If this helped, feel free to like, comment, or share your thoughts below.
---------------------------------------------------------------------
Abbreviation List
HTF – Higher Time Frame
LTF – Lower Time Frame
CVD – Cumulative Volume Delta
OI – Open Interest
TPO – Time Price Opportunity
PRZ – Potential Reversal Zone
RTH – Regular Trading Hours

LINK Breakout and Retest for a Bullish ContinuationLINK has finally broken its long term downtrend and reclaimed momentum.
Price made a strong breakout and is now pulling back toward the retest zone around the previous trendline. If this area holds as support, LINK may continue its upward move toward higher targets. Structure looks clean and bullish as long as the retest confirms support.
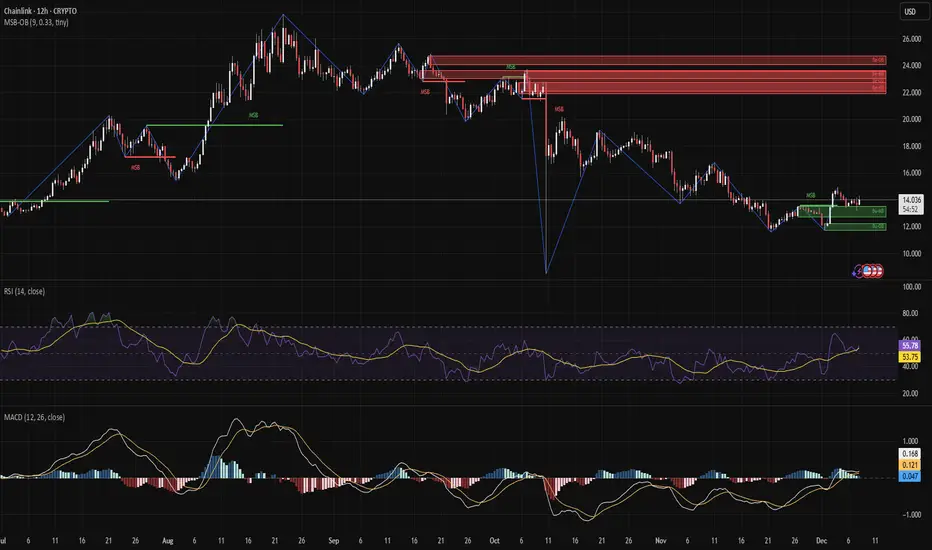
LINK Breaks Out from Demand – First MSB in WeeksChainlink just printed a clean bullish MSB after bouncing off the 12–12.5 OB zone. RSI is pushing above 56 and MACD flipped positive, showing early signs of a trend reversal.
Now sitting around 14.00, LINK needs to hold above 13.5 to avoid a fakeout. Targets toward 16–18 open up if momentum continues.
This is the first structural shift in weeks — bulls finally stepping in.
Bias: Bullish
Pair: LINK/USDT
Timeframe: 12H
This is not financial advice, only data analysis. Please consult a qualified financial professional for personalized guidance.
LINK Surges Off the Lows – Bulls Eye 16 NextChainlink printed a strong move off the lows and is now retesting previous structure zones. RSI tapped 59 and MACD is flipping bullish — early signs of momentum shifting.
Key resistance sits near 16–18. If bulls hold 13.5+, a run toward that OB zone is on the table. Market structure still needs a clean MSB to flip fully bullish.
Bias: Bullish
Pair: LINK/USDT
Timeframe: 12H
This is not financial advice, only data analysis. Please consult a qualified financial professional for personalized guidance.

LINK/USD LONG SET UP(Swing Trade)Entry 1 $12.50
Entry 2 $10.00
Stop loss $8.50
Take profit 1- $16.50
(Close 25%)
Take profit 2- $20.50
(Close 50%)
Take profit 3-$24.50
(Close 75%)
Take profit 4-$28.50
(Close 100%)

LINKUSD - ChainLink | Biggest Oracle In CryptoHi,
Chainlink is the biggest blockchain platform that bridges blockchain-based smart contracts and real-time external data.
This is not a trading advice.
Thanks
Gex

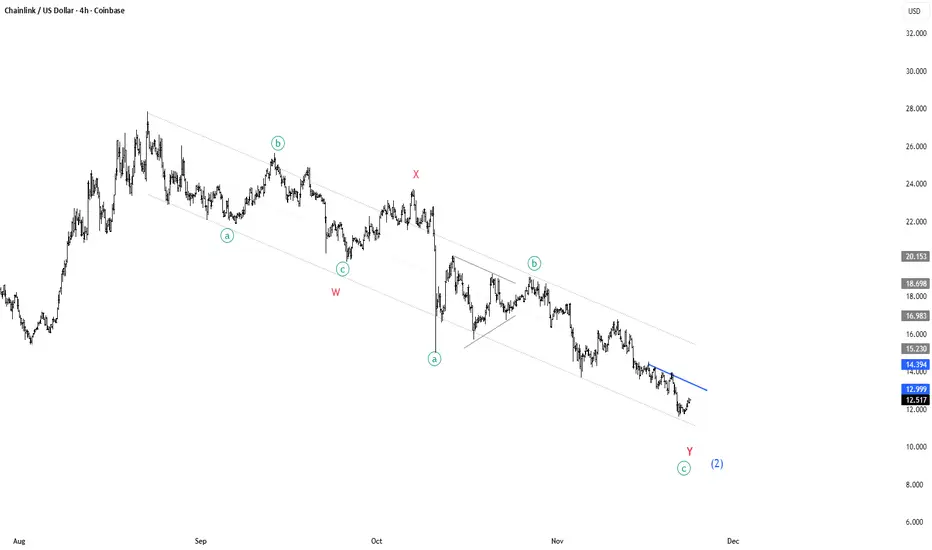
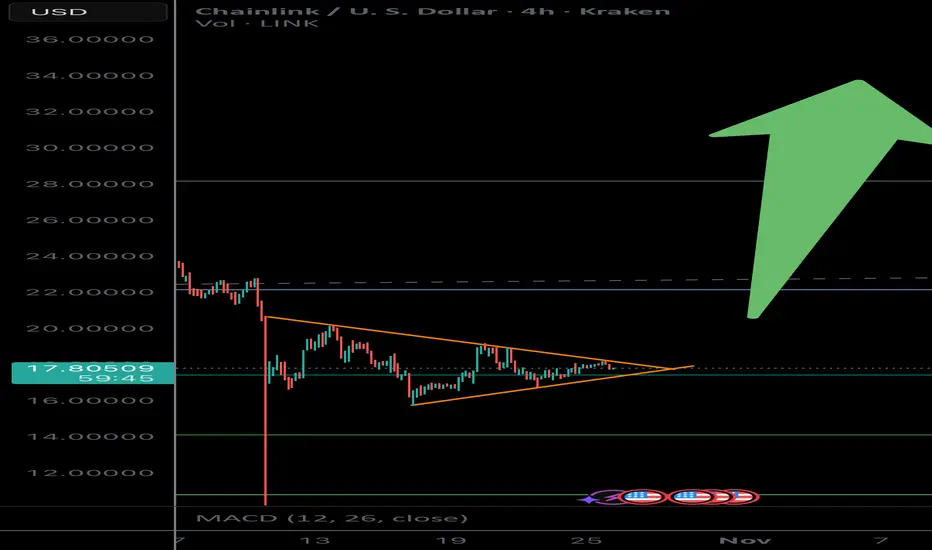
CHAINLINK is turning around for a massive rally!🔗 CRYPTOCAP:LINK – Elliott Wave Breakdown (4H Chart)
Current structure still fits a W–X–Y corrective decline, but we’re now approaching a critical trigger level. A clean punch through the blue trendline = buy signal. 🎯
🟦 What the structure shows:
🔻 Wave W complete:
• Clear a–b–c zigzag
• Strong reaction into the X connector
🔷 Wave X at the mid-channel zone:
• Acts as the next major upside target if we break out
• Provides structural symmetry between W and Y
🔻 Wave Y in progress:
• Again forming a–b–c
• C-leg looks terminal, aligning with channel support
📉 Price is compressing under the descending blue trendline (b-wave resistance of Y)
🚀 Trade trigger:
A decisive breakout above the blue trendline = start of the next impulsive leg
Upside target: the region around the prior X high
That zone is both:
• 🔹 Structural retracement
• 🔹 Upper channel magnet
• 🔹 Ideal first take-profit region
📌 Summary:
Break the blue line ➜ bullish confirmation ➜ target = X-level.
Still corrective, but the next impulse is close. ⚡
Link - Not far off a massive buy zoneChainlink is around 10% away from my buy zone. Multiple previous support and resistance areas will provide massive support around $10. Be greedy when others are fearful

LongAccording to the analysis of the waves and the help of the Gann method, it can be expected that the price will return to the green zone again.
This is my personal opinion. Please don't use it as your trading criteria. Good luck

So Sorry $LINK MarinesI hope this won't happen again, BUT, by the market, I will buy back to support you guys at $3.
Promised!!

CHAINLINK LINK - 1D - 1W TFAfter the end of the bear trend, price started forming a clean ascending channel.
The midline of the channel (dashed zone) marks a phase of uncertainty, often leading to shakeouts or temporary consolidations.
Area between the white dashed and green line can be viewed as a position-building zone, where smart money accumulates before a short-term or long-term upward move (ellipses).
Once the price breaks and confirms above this range, the probability of a move toward the upper boundary of the channel increases significantly.

$LINK – SOFI Fractal PlayBIST:LINK
Jumped in a little too early last time — got bullish right at resistance even though the chart was screaming “pullback incoming.” Lesson learned.
Updated outlook: I’m tracking a SOFI fractal that looks almost identical to LINK’s current structure. If it keeps following the same path, 2026 could get real interesting 👀

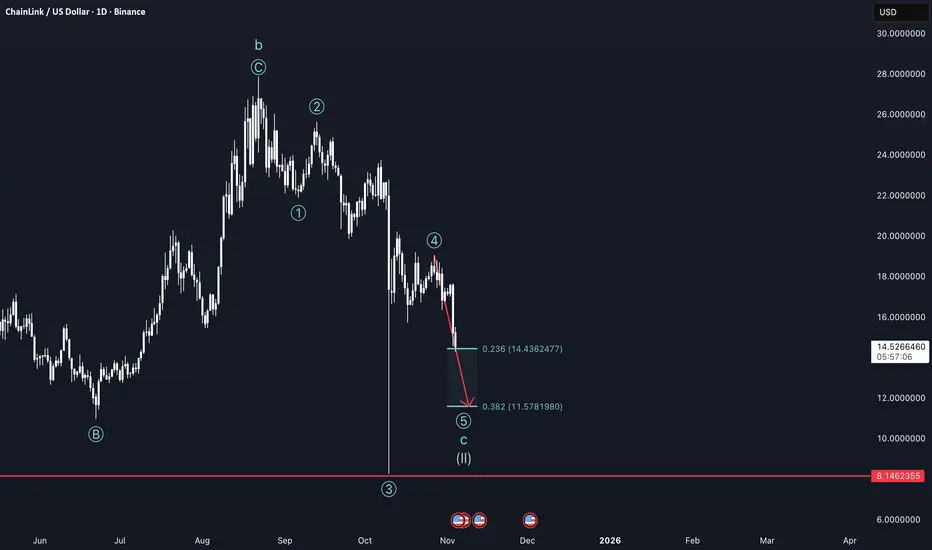
Chasing Lows - LINK weekly update Nov 04 - 10thAfter an astronomical gym session, I am now happy to review Chainlink to you!
Due to a negative macro outlook short-term, Altcoins and Bitcoin dropped in the beginning of the week and will be dropping further throughout the week.
Looking at the structure I am considering the current movement to be part of a larger correction of the supercycle wave 2, were we are internally at the wave c on the cycle and in the fifth wave in the primary cycle. For now we technically reached the first price target for short fifth waves, but since I expect Ethereum to also go down I believe we are gonna drop to the 0.382 extension level of the fifth wave, at $11.57.
On the way there we are going to fill a lot of orders as the orderbook shows a lot of them, also at the price target. As we go down I do not recommend opening short positions because a lot of people will call Altcoins and the Alt-Season dead, leading to a lot of shorts and a gradually increasing chance of short-squeezes. The bottom could be in if funding rates on the daily turn negative, and RSI enters oversold areas on the 2 week chart.
This thesis also gets supported by the VIX, which is rising and therefore indicates a risk off sentiment and the USDT dominance chart as it rises also and gets near the top.
I urgently need to point out that at this point an ending of the downtrend gets more possible the lower we fall. Buying here is a great opportunity and the lower we get the more the effect of dollar cost averaging comes into play.
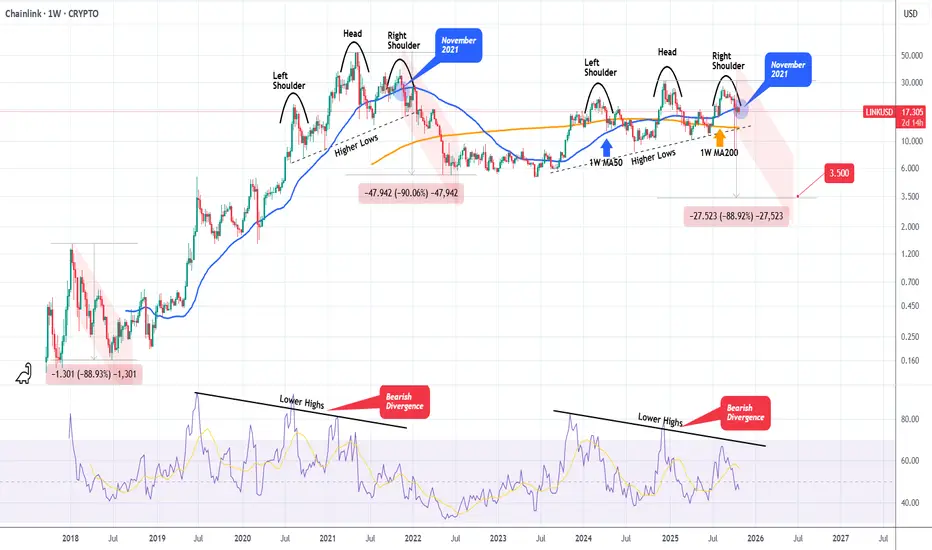
LINKUSD Massive Head and Shoulders starting the new Bear Cycle. Chainlink (LINKUSD) has been steadily rising within a Channel Up during this Bull Cycle but on the recent August 18 2025 High, it failed to make a Higher High and got rejected instead.
The Channel Up seems to have transitioned into a Head and Shoulders (H&S) pattern, while the 1W RSI has been on a Bearish Divergence (Lower Highs trend-line against the price's Higher Highs).
We saw a similar H&S forming at the end of the previous Bull Cycle (2021), which essentially paved the way to the 2022 Bear Cycle. Symmetrically it appears to also work quite well as right now we are on a similar spot (1W MA50, blue trend-line) as November 2021.
The two Bear Cycles of LINK declined by -88.90% and -90.00% respectively. As a result, if history repeats, we are looking at a potential bottom at at least $3.500 (-88.90%).
Do you think that's a realistic expectation?
-------------------------------------------------------------------------------
** Please LIKE 👍, FOLLOW ✅, SHARE 🙌 and COMMENT ✍ if you enjoy this idea! Also share your ideas and charts in the comments section below! This is best way to keep it relevant, support us, keep the content here free and allow the idea to reach as many people as possible. **
-------------------------------------------------------------------------------
💸💸💸💸💸💸
👇 👇 👇 👇 👇 👇
LINK: Shows Upward Momentum LINK has recently shown modest upward momentum. Under our primary scenario, we anticipate that turquoise wave 1 will push price above the resistance level at $30.95, followed by a corrective wave 2. However, if price continues to decline and falls below support at $8.25, we will expect a new wave alt.(B) low in magenta to form within our similarly colored alternative Target Zone ranging from $7.04 to $2.12 (probability: 37%).

The Chainlink Standard Ecosystem BreakoutI’m very bullish on Chainlink again and now it’s more comprehensive ecosystem.
CRYPTOCAP:LINK $stLINK BSE:SDL reSDL $XSwap
I’ve been expecting a Q4 breakout. Recently federal regulations have been clarified and Chainlink’s institutional partners are now ready to adopt the CRYPTOCAP:LINK standard.
Price has consolidated and it’s ready for a break out in the next day or two. It’s plausible we see a false start or even trading sideways for a week. With such significant potential the following breakout will be … noteworthy.
Chainlink hosts their annual SmartCon on Nov 4. With guest like the US Federal Reserve, SWIFT, DTCC, etc, it is extremely likely to cause some commotion.
LINK Shows Strong RecoveryChainlink (LINK) has shown remarkable strength following the recent market crash. The project continues to boast strong fundamentals, and its adoption has accelerated significantly over the past few months. This growth trajectory could expand exponentially in the near future. It’s worth remembering that during the 2018–2019 bear market, LINK was one of the few assets that increased in value. History could repeat itself in the coming years, even if Bitcoin enters another bear cycle.

Be careful with LINK !!!Unfortunately, the price has broken below the 200 moving average, which could act as a significant resistance and potentially push the price lower. In my view, the price may drop toward the PRZ (Potential Reversal Zone), and from there, it could resume its upward movement.

Long According to the analysis of the waves and the help of the Gann method, it can be expected that the price will return to the green zone again.
This is my personal opinion. Please don't use it as your trading criteria. Good luck
